Growth In Money Supply 2010-06
•
0 likes•198 views

The document analyzes data from the Federal Reserve Bank of St. Louis regarding US dollars in circulation from 1918 to 2013. It finds that unprecedented increases in the money supply since 2008 have led to all-time record highs in the year-to-year, 12-month rolling average, 24-month rolling average, and longer rolling averages of percentage increases compared to previous decades. This massive increase in the money supply could seriously risk hyperinflation and negatively impact the value of the US dollar for years to come unless corrective measures are taken.

Recommended
Recommended
More Related Content
Featured
Featured (20)
Growth In Money Supply 2010-06
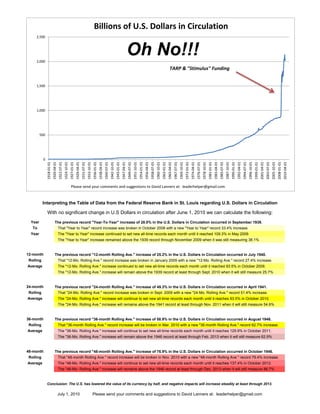
- 1. Billions of U.S. Dollars in Circulation 2,500 2,000 Oh No!!! TARP & "Stimulus" Funding 1,500 1,000 500 0 1918‐01‐01 1920‐04‐01 1922‐07‐01 1924‐10‐01 1927‐01‐01 1929‐04‐01 1931‐07‐01 1933‐10‐01 1936‐01‐01 1938‐04‐01 1940‐07‐01 1942‐10‐01 1945‐01‐01 1947‐04‐01 1949‐07‐01 1951‐10‐01 1954‐01‐01 1956‐04‐01 1958‐07‐01 1960‐10‐01 1963‐01‐01 1965‐04‐01 1967‐07‐01 1969‐10‐01 1972‐01‐01 1974‐04‐01 1976‐07‐01 1978‐10‐01 1981‐01‐01 1983‐04‐01 1985‐07‐01 1987‐10‐01 1990‐01‐01 1992‐04‐01 1994‐07‐01 1996‐10‐01 1999‐01‐01 2001‐04‐01 2003‐07‐01 2005‐10‐01 2008‐01‐01 2010‐04‐01 Please send your comments and suggestions to David Lanners at: leaderhelper@gmail.com Interpreting the Table of Data from the Federal Reserve Bank in St. Louis regarding U.S. Dollars in Circulation With no significant change in U.S Dollars in circulation after June 1, 2010 we can calculate the following: Year The previous record "Year-To-Year" increase of 28.0% in the U.S. Dollars in Circulation occurred in September 1939. To That "Year to Year" record increase was broken in October 2008 with a new "Year to Year" record 33.4% increase. Year The "Year to Year" increase continued to set new all-time records each month until it reached 109.3% in May 2009. The "Year to Year" increase remained above the 1939 record through November 2009 when it was still measuring 38.1% 12-month The previous record "12-month Rolling Ave." increase of 25.2% in the U.S. Dollars in Circulation occurred in July 1940. Rolling That "12-Mo. Rolling Ave." record increase was broken in January 2009 with a new "12-Mo. Rolling Ave." record 27.4% increase. Average The "12-Mo. Rolling Ave." increase continued to set new all-time records each month until it reached 93.5% in October 2009. The "12-Mo. Rolling Ave." increase will remain above the 1939 record at least through Sept. 2010 when it will still measure 25.7% 24-month The previous record "24-month Rolling Ave." increase of 49.3% in the U.S. Dollars in Circulation occurred in April 1941. Rolling That "24-Mo. Rolling Ave." record increase was broken in Sept. 2009 with a new "24-Mo. Rolling Ave." record 51.4% increase. Average The "24-Mo. Rolling Ave." increase will continue to set new all-time records each month until it reaches 93.5% in October 2010. The "24-Mo. Rolling Ave." increase will remaine above the 1941 record at least through Nov. 2011 when it will still measure 54.6% 36-month The previous record "36-month Rolling Ave." increase of 58.9% in the U.S. Dollars in Circulation occurred in August 1946. Rolling That "36-month Rolling Ave." record increase will be broken in Mar. 2010 with a new "36-month Rolling Ave." record 62.7% increase. Average The "36-Mo. Rolling Ave." increase will continue to set new all-time records each month until it reaches 129.9% in October 2011. The "36-Mo. Rolling Ave." increase will remain above the 1946 record at least through Feb. 2013 when it will still measure 62.9% 48-month The previous record "48-month Rolling Ave." increase of 76.9% in the U.S. Dollars in Circulation occurred in October 1946. Rolling That "48-month Rolling Ave." record increase will be broken in Nov. 2010 with a new "48-month Rolling Ave." record 79.4% increase. Average The "48-Mo. Rolling Ave." increase will continue to set new all-time records each month until it reaches 137.4% in October 2012. The "48-Mo. Rolling Ave." increase will remaine above the 1946 record at least through Dec. 2013 when it will still measure 86.7% Conclusion: The U.S. has lowered the value of its currency by half, and negative impacts will increase steadily at least through 2013. July 1, 2010 Please send your comments and suggestions to David Lanners at: leaderhelper@gmail.com
- 2. Research Division Federal Reserve - St. Louis AMBNS = Adjusted Monetary Base (Not Seasonaly Adjusted) Link: http://research.stlouisfed.org/fred2/series/AMBNS . Top Hedges Against "RED" Indicates Adjusted Hyper-Inflation are: serious risk of Hyper-Inflation Money Year to 12-month 24-month 36-month 48-month Precious Metal (1st) Monthly Supply Year Average Average Average Average "Real Estate" (2nd) Data (Billions) Increase Increase Increase Increase Increase 1918-01-01 4.874 Previous Highs 1939-09-01 14.259 28.0% 23.5% 13.4% 20.3% 41.2% Previous YearToYear High 1940-07-01 16.581 25.5% 25.2% 37.6% 28.2% 40.6% Previous 12mo/12mo High 1941-04-01 17.170 11.1% 18.8% 49.3% 44.9% 46.0% Previous 24mo/24mo High 1946-08-01 33.377 3.9% 9.3% 36.5% 58.9% 76.7% Previous 36mo/36mo High 1946-10-01 33.641 2.1% 7.1% 34.0% 58.8% 76.9% Previous 48mo/48mo High ... ... ... ... ... ... ... ... 2008-10-01 1135.809 33.4% 4.8% 6.4% 11.3% 19.3% New YearToYear High 2009-01-01 1737.869 103.2% 27.4% 17.6% 18.8% 24.7% New 12mo/12mo High 2009-09-01 1819.599 92.1% 93.2% 51.4% 41.2% 41.3% New 24mo/24mo High 2010-03-01 2097.813 26.3% 57.0% 84.1% 62.7% 57.2% New 36mo/36mo High 2010-11-01 2021.304 2.5% 18.3% 115.4% 93.0% 79.4% New 48mo/48mo High 2010-12-01 2021.304 2.6% 16.6% 109.1% 96.7% 82.1% New Highs 2011-01-01 2021.304 3.9% 15.4% 102.6% 100.5% 84.8% 2011-02-01 2021.304 -2.0% 12.4% 98.5% 104.2% 87.5% 2011-03-01 2021.304 0.0% 10.2% 93.7% 108.0% 90.2% 2011-04-01 2021.304 0.0% 8.7% 87.9% 111.7% 92.9% 2011-05-01 2021.304 0.0% 7.3% 82.4% 115.4% 95.6% 2011-06-01 2021.304 0.0% 5.6% 78.1% 119.1% 98.3% 2011-07-01 2021.304 0.0% 3.8% 74.3% 122.7% 100.9% 2011-08-01 2021.304 0.0% 2.2% 70.3% 126.2% 103.6% 2011-09-01 2021.304 0.0% 1.1% 65.8% 129.1% 106.2% 2011-10-01 2021.304 0.0% 0.6% 60.3% 129.9% 108.9% 2011-11-01 2021.304 0.0% 0.4% 54.6% 127.0% 111.5% 2011-12-01 2021.304 0.0% 0.1% 49.3% 122.1% 114.1% 2012-01-01 2021.304 0.0% -0.2% 44.6% 117.2% 116.8% 2012-02-01 2021.304 0.0% 0.0% 39.3% 113.9% 119.4% 2012-03-01 2021.304 0.0% 0.0% 34.7% 110.0% 122.0% 2012-04-01 2021.304 0.0% 0.0% 30.3% 105.3% 124.7% 2012-05-01 2021.304 0.0% 0.0% 26.3% 100.8% 127.3% 2012-06-01 2021.304 0.0% 0.0% 22.5% 97.2% 129.9% 2012-07-01 2021.304 0.0% 0.0% 18.9% 93.8% 132.5% 2012-08-01 2021.304 0.0% 0.0% 15.6% 90.4% 135.0% 2012-09-01 2021.304 0.0% 0.0% 12.6% 86.4% 137.0% 2012-10-01 2021.304 0.0% 0.0% 10.2% 81.7% 137.4% 2012-11-01 2021.304 0.0% 0.0% 8.8% 76.7% 134.9% 2012-12-01 2021.304 0.0% 0.0% 7.8% 72.0% 130.9% 2013-01-01 2021.304 0.0% 0.0% 7.0% 67.7% 126.7% 2013-02-01 2021.304 0.0% 0.0% 5.8% 62.9% 123.8% 2013-03-01 2021.304 0.0% 0.0% 4.9% 58.6% 120.4% 2013-04-01 2021.304 0.0% 0.0% 4.2% 54.5% 116.4% 2013-05-01 2021.304 0.0% 0.0% 3.5% 50.7% 112.4% 2013-06-01 2021.304 0.0% 0.0% 2.7% 47.0% 109.2% 2013-07-01 2021.304 0.0% 0.0% 1.9% 43.5% 106.2% 2013-08-01 2021.304 0.0% 0.0% 1.1% 40.2% 103.1% 2013-09-01 2021.304 0.0% 0.0% 0.5% 37.1% 99.6% 2013-10-01 2021.304 0.0% 0.0% 0.3% 34.0% 95.4% 2013-11-01 2021.304 0.0% 0.0% 0.2% 31.1% 90.9% 2013-12-01 2021.304 0.0% 0.0% 0.1% 28.4% 86.7% * Presumes no change in money supply after June 1, 2010. July 1, 2010 Please send your comments and suggestions to David Lanners at: leaderhelper@gmail.com