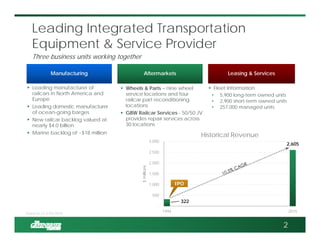
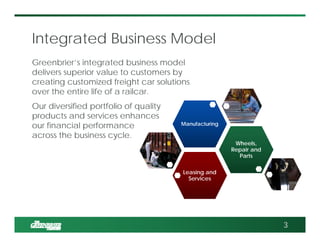
- Greenbrier is a leading manufacturer and lessor of railroad freight cars in North America. It has a diversified business model including manufacturing, leasing and services, and wheels/parts.
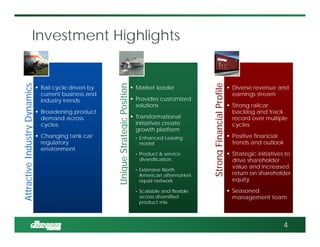
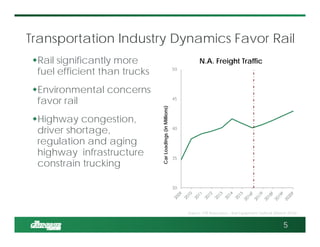
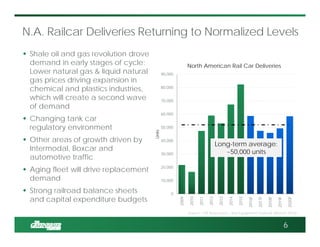
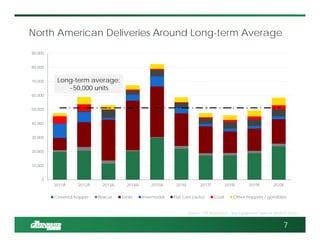
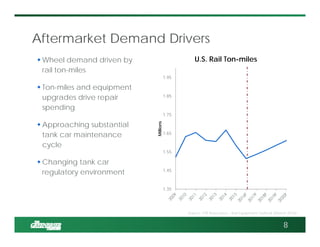
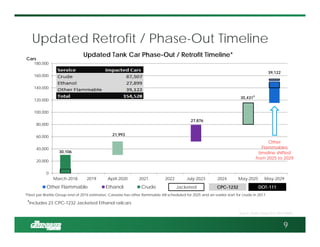
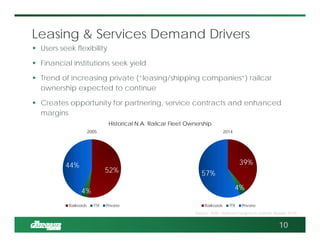
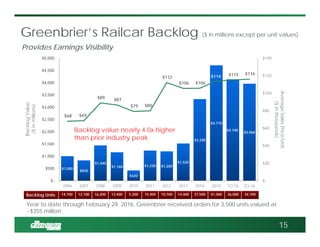
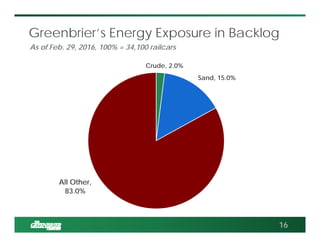
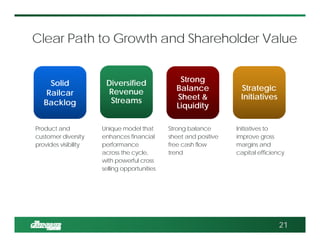
- The company has a large backlog of orders valued at nearly $4 billion which provides earnings visibility. Demand drivers include increasing rail traffic, an aging fleet requiring replacement, and changing tank car regulations.
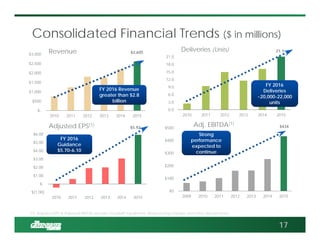
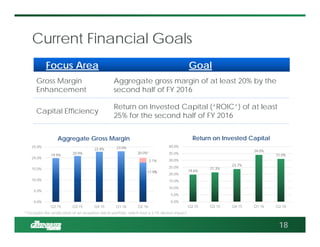
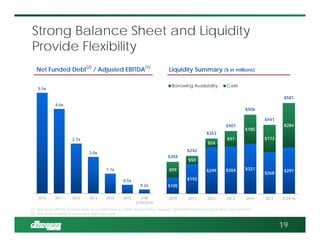
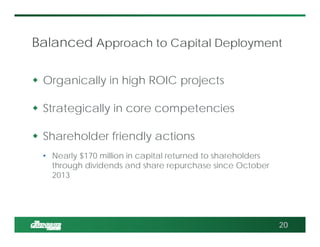
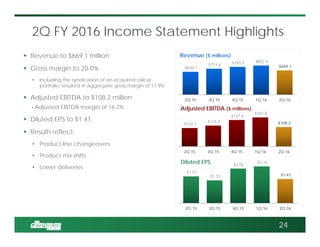
- Greenbrier is pursuing initiatives to enhance margins and returns through diversification, international expansion, and leveraging its integrated business model across the railcar lifecycle. It expects continued strong financial performance in fiscal year 2016.