Dokumen tersebut berisi contoh-contoh soal dan jawaban mengenai penyajian data statistik dalam bentuk diagram dan grafik, seperti diagram garis, diagram batang, diagram lingkaran, histogram, poligon, dan ogive. Terdapat 10 halaman contoh soal dan penyelesaiannya.
Thông báo tuyển sinh trung cấp tiếng hàn năm 2015Nam_Khanh
Trường Trung Cấp Công Nghệ Bách Khoa Hà Nội thông báo tuyển sinh trung cấp tiếng Hàn hệ chính quy năm 2015 học ngoài giờ hành chính.
http://bachkhoahanoi.edu.vn/
Since the dawn of man, we have wrestled with how the work we do to make a living impacts our happiness, our health, and our relationships. And while laws and technological advancements have greatly improved working conditions in the United States, many of us are now faced with coordinating across timezones and being available after-hours to get work done. Burn out is rampant, happiness is dampened, and work-life balance seems impossible. Rewind to when you were in elementary school: you were sleeping more, eating in a more balanced way, communicating and expressing yourself through creative mediums, constantly curious, and on the whole you were just happier. In her BOLD TALK, Leslie will share some of the things she's done to return to the fundamentals of childhood that have enabled her to be at the top of her game professionally.
These days, we're encouraged to be better and faster than the people around us. We're pushed by peers and competition. And constantly encouraged to carry a dogged determination to get the job done. All of this comes with a healthy dose of egotism and arrogance---even though it is often contrived and even more often corrosive. What if taking a more humble path could be a more rewarding---and palatable---way of reaching your goals?
Data adalah kumpulan informasi yang diperoleh dari suatu pengamatan. Informasi ini bisa berupa angka, lambang, atau keadaan objek yang sedang diamati. Misalnya, pada percobaan Biologi, kamu disuruh mengamati pertumbuhan tanaman kacang hijau.
Pada bagian ini fokus pembahasan hanya pada mengenal data, tabel, dan juga diagram batang.
Pembahasan tentang cara penyajian data yang lain akan dibahas pada bagian 2.
Similar to Grafik buatan hardi ganteng2 ganteng (8)
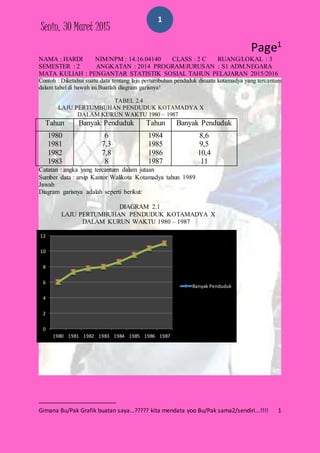
1. Senin, 30 Maret 2015
1
Page1
NAMA : HARDI NIM/NPM : 14.16.04140 CLASS : 2 C RUANG/LOKAL : 3
SEMESTER : 2 ANGKATAN : 2014 PROGRAM/JURUSAN : S1 ADM.NEGARA
MATA KULIAH : PENGANTAR STATISTIK SOSIAL TAHUN PELAJARAN 2015/2016
Contoh : Diketahui suatu data tentang laju pertumbuhan penduduk disuatu kotamadya yang tercantum
dalam tabel di bawah ini.Buatlah diagram garisnya!
TABEL 2.4
LAJU PERTUMBUHAN PENDUDUK KOTAMADYA X
DALAM KURUN WAKTU 1980 – 1987
Tahun Banyak Penduduk Tahun Banyak Penduduk
1980
1981
1982
1983
6
7,3
7,8
8
1984
1985
1986
1987
8,6
9,5
10,4
11
Catatan : angka yang tercantum dalam jutaan
Sumber data : arsip Kantor Walikota Kotamadya tahun 1989
Jawab
Diagram garisnya adalah seperti berikut:
DIAGRAM 2.1
LAJU PERTUMBUHAN PENDUDUK KOTAMADYA X
DALAM KURUN WAKTU 1980 – 1987
Gimana Bu/Pak Grafik buatan saya...????? kita mendata yoo Bu/Pak sama2/sendiri...!!!! 1
0
2
4
6
8
10
12
1980 1981 1982 1983 1984 1985 1986 1987
Banyak Penduduk
2. Senin, 30 Maret 2015
2
Page2
Contoh : Berikut ini didapat data tentang perkembangan suhu tubuh 2 pasien rumah sakit
umum “A” kamar nomor 1 yang tercatat dalam bentuk tabel berikut:
TABEL 2.5
PERKEMBANGAN SUHU TUBUH PASIEN RSU “A”
KAMAR NOMOR 1
Pukul
Suhu Tubuh
Pasien A Pasien B
05.00
06.00
07.00
08.00
09.00
10.00
11.00
12.00
42
42
41
40
39
39
37
36
36
37
37
38
40
40
41
42
DIAGRAM 2.2
PERKEMBANGAN SUHU TUBUH PASIEN RSU “A”
KAMAR NOMOR 1
Gimana Bu/Pak Grafik buatan saya...????? kita mendata yoo Bu/Pak sama2/sendiri...!!!! 2
33
34
35
36
37
38
39
40
41
42
43
05.00 06.00 07.00 08.00 09.00 10.00 11.00 12.00
Pasien A
Pasien B
3. Senin, 30 Maret 2015
3
Page3
Contoh : Misalkan jumlah penduduk di kota A, B, C, D, E Provinsi “X” tahun 1993 adalah
sbb:
Jumlah penduduk di kota A ada 8.500 orang
Jumlah penduduk di kota B ada 12.500 orang
Jumlah penduduk di kota C ada 14.000 orang
Jumlah penduduk di kota D ada 10.500 orang
Jumlah penduduk di kota E ada 15.000 orang
Sajikan data di atas ke dalam diagram batang!
DIAGRAM 2.3
JUMLAH PENDUDUK DI KOTA A,B,C,D, DAN E
PROVINSI “X” TAHUN 1993
Contoh : Dari penelitian terhadap 300 orang pegawai di wilayah A tentang kendaraan yang
mereka gunakan untuk pergi ketempat kerja, diperoleh data sbb:
25 orang menggunakan mobil pribadi, 50 orang menggunakan sepeda motor, 100 orang
menggunakan Bis Kota, 50 orang menggunakan kendaraan taxsi dan sisanya jalan kaki.
Sajikanlah data tersebut ke dalam bentuk diagram lingkaran.
Jenis Kendaraan Frekuensi Persentase (%) Kategori
Mobil
Sepeda Motor
Bis Kota
Taxsi
Jalan Kaki
25
50
100
50
75
8,3
16,7
33,3
16,7
25
300
600
1200
600
900
Gimana Bu/Pak Grafik buatan saya...????? kita mendata yoo Bu/Pak sama2/sendiri...!!!! 3
0
2,000
4,000
6,000
8,000
10,000
12,000
14,000
16,000
A B C D E
JUMLAH PENDUDUK
4. Senin, 30 Maret 2015
4
Page4
DIAGRAM 2.5
PERSENTASE JENIS KENDARAAN YANG DIGUNAKAN
KETEMPAT KERJA DARI 300 ORANG DI WILAYAH A
DIAGRAM 2.6
PERSENTASE JENIS KENDARAAN YANG DIGUNAKAN
KETEMPAT KERJA DARI 300 ORANG DI WILAYAH A
Gimana Bu/Pak Grafik buatan saya...????? kita mendata yoo Bu/Pak sama2/sendiri...!!!! 4
Jenis Kendaraan
Mobil
Sepeda Motor
Bis Kota
Taxsi
Jalan Kaki
Jenis Kendaraan
Mobil
Sepeda Motor
Bis Kota
Taxsi
Jalan Kaki
6. Senin, 30 Maret 2015
6
Page6
TABEL 3.9
JUMLAH MURID DI DAERAH X
MENURUT JENJANG SEKOLAH DAN JENIS KELAMIN
JENJANG
SEKOLAH
JUMLAH MURID
JUMLAH
LAKI-LAKI PEREMPUAN
SMA 275 525 800
SMK 215 285 500
SMP 500 1000 1500
SD 875 1025 1900
TK 515 885 1400
Grafik 3.3 : Jumlah Murid di Daerah X Menurut Jenjang Sekolah
Grafik 3.5 : Jumlah Murid di Daerah X Menurut Jenjang Sekolah
Gimana Bu/Pak Grafik buatan saya...????? kita mendata yoo Bu/Pak sama2/sendiri...!!!! 6
1400
1900
1500
500
800
0
500
1000
1500
2000
TK SD SMP SMK SMA
0
200
400
600
800
1000
1200
1400
1600
1800
2000
SMA
SMK
SMP
SD
TK
7. Senin, 30 Maret 2015
7
Page7
Grafik 3.9 : Jumlah Murid di Daerah X Menurut Jenis Kelamin dan Jenjang Sekolah
Grafik 3.12 : Jumlah Murid di Daerah X Menurut Jenis Kelamin dan Jenjang Sekolah
Grafik 3.13 : Jumlah Murid di Daerah X Menurut Jenis Kelamin dan Jenjang Sekolah
Gimana Bu/Pak Grafik buatan saya...????? kita mendata yoo Bu/Pak sama2/sendiri...!!!! 7
0
200
400
600
800
1000
1200
TK SD SMP SMK SMA
LAKI-LAKI
PEREMPUAN
0
200
400
600
800
1000
1200
TK SD SMP SMK SMA
Laki-Laki
Perempuan
0
500
1000
1500
2000
TK SD SMP SMK SMA
Perempuan
Laki-Laki
8. Senin, 30 Maret 2015
8
Page8
Grafik 3.12 : Jumlah Murid di Daerah X Menurut Jenjang Sekolah
TABEL 3.10
HASEL TES STATISTIKA 80 MAHASISWA
Interval Xi fi
51 – 57 54 2
58 – 64 61 12
65 – 71 68 13
72 – 78 75 27
79 – 85 82 12
86 – 92 89 7
93 – 99 96 7
Jumlah - 80
Grafik 3.10 : Poligon Hasil Tes Statistika 80 Mahasiswa
Gimana Bu/Pak Grafik buatan saya...????? kita mendata yoo Bu/Pak sama2/sendiri...!!!! 8
0
5
10
15
20
25
30
51-57 58-64 65-71 72-78 79-85 86-92 93-99
0
200
400
600
800
1000
1200
1400
1600
1800
2000
TK SD SMP SMK SMA
9. Senin, 30 Maret 2015
9
Page9
Grafik 3.11 : Poligon Hasil Tes Statistika 80 Mahasiswa
Gimana Bu/Pak Grafik buatan saya...????? kita mendata yoo Bu/Pak sama2/sendiri...!!!! 9
0
5
10
15
20
25
30
51-57 58-64 65-71 72-78 79-85 86-92 93-99