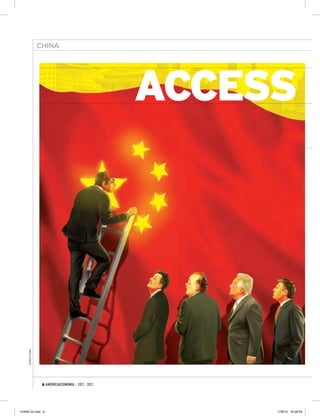
500 BUSINESS
                                 THE             THE


                               LARGEST
                                       BEST
                               COMPANIES   SCHOOLS
     www.americaeconomia.com


   GLOBAL
   ISSUE
    Special reports on Latin America
    FOR THE GLOBAL MARKET
                The
                                            The


                     and


                                             2012 - 2013   US$ 5.-


TAPA GLOBAL 201 2.indd 1                                     17/8/12 16:59:30
9   Countries


        GET TO KNOW US                                                         +177,450
                                                                               Direct Jobs in
                                                                               Latin America.
        ACTIONS CREATING VALUE
        OVER 120 YEARS LEVERAGING
        OUR GROWTH TO SATISFY OUR
        CONSUMERS, CREATING ECONOMIC
        AND SOCIAL VALUE,
                                                                                                         +215
                                                                               37
        SIMULTANEOUSLY.                                                                                               Million
                                                                                                             consumers served.


                                                                               Bottling plants
                                                                               in Latin America.


                                                                                                   +10,000      OXXO stores.


                                                                                                        +8
                                                                                                      Million transactions
                                                                                                       per day at OXXO stores.


        FEMSA is a leading company that participates in the
        beverage industry through Coca-Cola FEMSA, the


                                                                               20%
        largest bottler of Coca-Cola products in the world; in
        the retail industry through FEMSA Comercio, operating
        OXXO, the largest and fastest-growing chain of stores
        in Latin America, and in the beer industry, through
        its ownership of the second largest equity stake in
        Heineken, one of the world’s largest breweries with
        operations in over 70 countries.
                                                                               Economic interest
                                                                               in Heineken.


        Investor Relations: (52.81) 8328.6167 - investor@femsa.com.mx
        Corporate Communications: (52.81) 8328.6046 - comunicacion@femsa.com
        www.femsa.com                                                                               @femsa   /femsa


BASE PAGINA COMPLETA.indd 1                                                                                             16/08/2012 9:43:59
BASE PAGINA COMPLETA.indd 2   16/08/2012 9:43:59
BASE PAGINA COMPLETA.indd 3   16/08/2012 9:43:59
CONTENIDO


                            GLOBAL
                            ISSUE
                            Special reports on Latin America
                            FOR THE GLOBAL MARKET


              6                                               40
                      CHINA`S LABYRINTH                            SEND US YOUR TALENT
                      Very few Latin American companies            A growing number of global Business
                      have succeeded in selling something          Schools are focusing their attention
                      beyond commodities. Why?                     to Latin American students.


             10                                               44
                      AFTER THE BONANZA                            GO WEST, YOUNG MAN
                      Latin America`s largest companies            An increasing number of Latin
                      showed a strong if slower growth in          American companies are becoming
                      2011.                                        full-fledged multilationals.


             14                                               46
                      AMERICAECONOMIA´S 500                        MEET THE MULTILATINA
                      From Big Oil to mega retailers and           How much do they sell, invest and
                      telcos, meet Latin America`s biggest         hire? Where? The new Latin global
                      corporate players .                          players are a force to reckon.


             34                                               48
                      THE NEW MBA                                  IN THOU WE TRUST
                      Latin America`s best Business                Big global banks are suffering their
                      Schools face a new challenge: how to         worst times ever. Latin American
                      innovate.                                    banks are booming. For how long?
                                                                                                                    COVER DESING: ÁLVARO ARAYA URQUIZA


             36                                               52
                      THE B-SCHOOL’S WHO’S WHO                     LET THE GOOD TIMES ROLL
                      The region`s best school ranked              The region´s 250 largest banks
                      by faculty, publications, global net-        ranked by assets and other financial
                      works and other relevant criteria.           ratios.


                                                                              2012 - 2013 / AMÉRICAECONOMÍA 3


CONTENIDO GI.indd 3                                                                                         17/8/12 16:38:04
MEMO


            PUBLISHER & EDITOR
            Elías Selman C.
                                                                                      NEW CHALLENGES
                                                                                      O
            EXECUTIVE EDITOR
            Carlos Tromben
                                                                                              ver the last 25 years, but             on their pension systems. Cities
            ART DIRECTOR                                                                      especially from the late               may experience an increase in drug-
            Álvaro Araya Urquiza
                                                                                              nineteen nineties onwards,             related violence (if authorities fail to
            DEPUTY EDITOR                                                             Latin America underwent some of                tackle the status quo). Many regions
            Rodrigo Lara Serrano
                                                                                      the most dramatic changes in its               are facing severe water shortages.
            EDITORS                                                                   history. Democracy was restored,                    This is the environment in
            Fernando Chevarría (Lima)
            Paula Pacheco (São Paulo)                                                 economies were opened up, and tariff           which AméricaEconomía operates,
            Samuel Silva (Santiago)                                                   barriers lowered. Latin American               providing its readers with insightful
            Gisela Raymond (Guayaquil)                                                governments on the left and right              information, analysis and news from
            REPORTERS                                                                 deregulated                                                               a Latin American
            Ximena Bravo, David Cornejo y Tamara Muñoz (Santiago), Graziele
            Dal-Bo (São Paulo), María Cristina Prezet y Natalia Vera (Lima),
                                                                                      markets, while                                                            perspective.
            David Santa Cruz (Mexico City), Jenny C. González (Bogota),               introducing strict                                                        The www.
                                                                                                                                   500 BUSINESS
                                                                                                                                                                THE           THE


            Gonzalo León (Buenos Aires), Hebe Schmidt (Madrid), Loreto Urbina         rules on banking                             LARGEST
                                                                                                                                             BEST               americaeconomia.
            (London), Montserrat Nicolás (Washington D.C.)                                                                         COMPANIES S C H O O L S
                                                                                      (a precaution that                                                        com news site and

                                                                                                                                GLOBAL
            CONSEJEROS EDITORIALES                                                    has paid off today).                                                      AméricaEconomía’s
            Peter Hakim (Washington), Enrique García (Caracas)
                                                                                      China was not on                                                          regional and local


                                                                                                                                ISSUE
            PHOTOGRAPHY EDITOR                                                        anyone’s radar back                                                       stories offer the
            Miguel Candia
            DESIGNERS                                                                 then, but it is now                                                       clearest window
            César Leyton y Pablo Reyes                                                fueling one of the                                                        through which
            ILLUSTRATIONS                                                             most sustained                                                            to observe Latin
            Patricio Otniel                                                                                      Special reports on Latin America
            PROOF READER                                                              periods of economic        FOR THE GLOBAL MARKET                          American business.
            Mario Pozo V.                                                             growth in Latin              The
                                                                                                                                               The
                                                                                                                                                                    This Global Issue
            AMÉRICAECONOMÍA INTELLIGENCE                                              America.                                                                  is a compilation of
            (surveys and Special Pojects)                                                 Latin Americans            and
                                                                                                                                                                AméricaEconomía’s
            DIRECTOR
            Jaime Contreras Soria                                                     are now healthier,                                                        best-selling
            SENIOR RESEARCHER                                                         richer, but also                                                          products, rankings
            Andrés Almeida                                                            more critical of                                                          and news stories.
            FINANCE RESEARCHER
            Catherine Lacourt                                                         their political                                                           You will find the
                                                                                      institutions, and                                                         region’s largest
            AMÉRICAECONOMÍA.COM
            EDITOR                                                                    more demanding as consumers and                companies, ranked by revenue and
            Lino Solís de Ovando                                                      citizens. Millions of Latin Americans          other indicators, the best MBA
            JOURNALISTS
            Daniela Arce, Alejandra Araya, Patricio Díaz, Gastón Meza, Pablo
                                                                                      are first-generation professionals;             programs and business schools,
            Albarracín, Christopher Holloway, Jennifer Roig, Loreto Oda, David        they are the major force behind both           and the Multilatinas ranking, a
            Montolio.                                                                 the region’s consumer boom and                 Who’s Who of Latin America’s most-
            DEVELOPMENT
            Leonardo Cabrera, Richard Suing, Óscar Quiroz, Carla Vilches.             declining birth rates.                         globalized business groups and
                                                                                          But this bonanza could end badly           companies.
            GENERAL MANAGER
            Eduardo Albornoz                                                          if Latin America does not prepare for               Go on. You won’t regret it.
                                                                                      the future. The region’s commodity-
            COO
            Rodrigo Guaiquil C.                                                       driven boom is suffocating
                                                                                      innovation, exposing its economies
            CFO
            Carlos Quevedo Barra                                                      to the dreaded Dutch disease,
                                                                                      and leaving major environmental
            MARKETING CHIEF
            Consuelo Alcaíno                                                          liabilities for future generations
                                                                                      to clean up. Twenty or thirty years
            ONLINE PRODUCT MANAGER                                                    from now, major Latin American
            Carol Kast
                                                                                      countries will pass demographic                                      Elías Selman C.
            OPERATIONS MANAGER                                                        thresholds which will put pressure                               Publisher & editor
            Matías Agurto
            CHAIRMAN
            Robert R. Paradise


                                    AMÉRICAECONOMÍA is published monthly by Nanbei Ltd. Printed in Gráfica Andes, postage paid. Periodical publication. Registry PP09-0011. Certificate of lawfulness Title Nº 4090. Certificate of content
                                    lawfulness Nº 3346. AMÉRICAECONOMÍA is a Nanbei Ltd. monthly publication.
                                    AMÉRICAECONOMÍA magazine (USPS #023106) is published monthly in Santiago, Chile by AMÉRICAECONOMÍA. AMÉRICAECONOMÍA is distributed in the United States by DL Distribution Group, 7301 SW 100
                                    Ct, Miami, FL. 33173-4651 PH: (305) 595-5505. Periodicals Postage paid at Miami, Florida. POSTMASTER: send address changes to DL DISTRIBUTION GROUP 7301 Miami, FL 33173-4651


            4 AMÉRICAECONOMÍA / 2012 - 2013


MEMO GI.indd 4                                                                                                                                                                                                                   17/8/12 16:39:24
Aviso Falso


BASE PAGINA COMPLETA.indd 1                 26/04/2012 12:21:15
CHINA


                                                          ACCESS R
     PATRICIO OTNIEL


                        6 AMÉRICAECONOMÍA / 2012 - 2013


CHINA GI.indd 6                                                17/8/12 16:39:55
CHINA


RESTRICTED   Latin American companies have been unable to achieve
             success when they try to sell anything in China apart
             from raw materials. If they continue with their current
             strategies, perhaps they never will. Carlos Tromben


             A
                                t first sight, Harbin is    local firm Aviation Industry Corporation      carmona family, which has become in
                                not a typical Chinese       of China (AVIC). However, as oil prices       recent years a successful producer of
                                city. Located in the        rose, the jets become less competitive        turbines for hydroelectric and wind en-
                                northeast of the coun-      and they decided to halt production.          ergy projects. In the nineteen eighties, it
                                try, its architecture and   Embraer’s plan was to use the plant           became a leading global producer of port
                                street plan, marked with    in frozen Harbin to build bigger, more        cranes, the enormous structures which
                                wide boulevards and         sophisticated aircraft, like the ERJ-190,     can load and unload containers in just
                                Orthodox churches, bear     which can carry up to 100 passengers.         a few minutes. The firm opened offices
             witness to the thousands of expatriated        However, it never obtained authoriza-         in Hong Kong and Beijing in order to
             Russians who arrived before and after          tion from the Chinese government to           attack the Chinese market.
             the Bolshevik Revolution of 1917. But          build it there. Without approval, the             “Our first project in China was to
             its Siberian climate (which allows it to       plant in Harbin was destined to fail and      supply cranes to the Port of Shanghai,”
             hold one of the world’s most famous            only intervention by Brazilian president      says the company’s vice-president Sofia
             ice sculpture festivals) is not exactly the    Dilma Rousseff during her official visit to   Pescarmona. “We began building with
             right one to lift the spirits of the seven     China last April resur-                                           a Chinese subcon-
             Brazilian employees of airplane maker          rected the possibility   In Latin America,                        tractor and the added
             Embraer. Especially given that its fac-        of definitive approval                                            value parts we did in
             tory in the city has not been very active      which has still not      business and                             Mendoza.”
             since April 2011.
                 Like other industrial firms from Latin
                                                            been granted.
                                                                Embraer’s diffi-
                                                                                     friendship are                               However, the
                                                                                                                              company was soon
             America which set up shop in China in          culties in China are     kept separate:                           in trouble with the
             a bid to participate in the expansion of       no exception. The                                                 Chinese contractor
             this enormous market, Embraer’s Chi-           Eastern giant has be-    in China, doing                          which became a com-
             nese operations have been trapped in
             a labyrinth of regulations, permits and
                                                            come one of Latin
                                                            America’s biggest
                                                                                     business means                           petitor and, in 1992,
                                                                                                                              founded Shanghai
             political shenanigans which have kept it       trading partners, with   exchanging favors.                       Zhenhua Port Ma-
             a heartbeat away from definite closure         annual trade hitting                                              chinery (SZPM). “It
             for months.                                    US$200 billion, and                                               received huge subsi-
                 It is an unusual situation for a company   several companies                                                 dies from the Chinese
             which has become the pride of Brazilian        from the region have taken the plunge         state, they gave them a port, ten vessels,
             industry, building up a position in the        of investing directly in China. But they      and very cheap money, and it was prac-
             global market for regional jets - aircraft     have little to show for their efforts.        tically impossible for us and the rest
             with up to fifty seats, such as Embraer’s          Many have even preferred to with-         of the world’s suppliers to compete,”
             ERJ-150. In China, Embraer produced            draw. They include Argentina’s IMPSA,         recalls Pescarmona. Today, SZPM has
             these airplanes in association with the        the industrial arm of the powerful Pes-       more than 70% of the global market for


                                                                                                                       2012 - 2013 / AMÉRICAECONOMÍA 7


CHINA GI.indd 7                                                                                                                                      17/8/12 16:40:02
CHINA


             port cranes, many of which are sold in
             Latin America. “Today the world sees
             the price of these cranes is rising,” says
             Pescarmona, speaking at the Multilatinas
             Forum, organized by AméricaEconomía.
             Her analysis is clear: “China’s vocation
             is to be an industrial producer of added
             value products which has also been our
             vocation for the last hundred years,” the
             Argentinean says. “Asia continues to be
             an interesting market, which we tackle
             from Malaysia, but not the domestic
             Chinese market.”
                 The story has aspects in common with
                                                             Dilma Rousseff
             that of Beijing Copper Tube, a corpora-
             tion created in 1987 between Chilean            in Beijing: put-
             mining firm Codelco, Chilean copper             ting in a word
             tube and cable fabricator Madeco and the        for Embraer
             Chinese government to produce copper
             tube in a city which had previously only          But putting this into practice is harder   a clear example. “Embraer is a great
             produced lead pipe. The promising deal         than it sounds. Despite an auspicious         company thanks to its declared aim of
             was one of the steps which led Chile to        name for the Chinese market, the Brazil-      buying in the best parts and systems for
             become the first country in the world to       ian bus maker Marcopolo has not been          its airplanes,” says Richard Abulafia,
             recognize China as a market economy            able to repeat in China the production        vice-president of the Teal Group, an
             which helped its subsequent accession          models which it has successfully trans-       aerospace and defense industry consul-
             to the World Trade Organization.               planted to South Africa, Egypt and, most      tancy. “China, on the other hand, buys
                 However, faced                                                 recently, India.          parts and systems from anyone who is
             with the joint venture’s  China’s                                      “China is the on-     prepared to hand over its technology,
             poor results, the Chil-                                            ly one of our plants      just like the former USSR used to do.”
             ean companies pulled      vocation is to                           in which we do not        IMPSA’s Sofia Pescarmona makes a
             out in 1991, selling
             their shares to the Chi-
                                       be an industrial                         make buses, we just
                                                                                produce parts and
                                                                                                          similar argument. “China will not let
                                                                                                          us produce in their country unless we
             nese government.          producer with                            pieces,” says Rubens      give up our knowledge, which it has
                 For Osvaldo Rosa-                                              de la Rosa, Marco-        cost us a great deal to develop over
             les, director of foreign  high added value,                        polo’s Brazilian chief    the last hundred years. We prefer not
             trade at the United
             Nations’ Economic
                                       but it is a highly                       executive. “Why do
                                                                                we not have the same
                                                                                                          to,” she says.
                                                                                                              China experts explain that cultural
             Commission for Lat-       nuanced market.                          authorizations as lo-     differences lie behind many of the
             in America and the                                                 cal producers? Hav-       problems faced by Latin American
             Caribbean, the pivot                                               ing volume is a big       firms which have tried to break into
             shift in international                                             competitive advan-        the country which refers to itself as the
             economic relations poses a huge chal-          tage and China does not share it.”            Middle Kingdom. That concept reduces
             lenge to Latin American governments                                                          the rest of the world to a periphery on
             and business.                                  COMING AND GOING                              the outside trying to look in.
                 “One possible stance is passive: let       The problem is that the powerful model            “They remember that there have
             China drag us along, which is what they        of industrialization which China is           only been 200 years in the history of
             are doing,” says Rosales. “Another is to try   pursuing is very different from that          mankind in which China and India were
             and participate in the Asian value chains      which has produced numerous success           not the main powers,” says ECLAC’s
             which are built around China.”                 stories in Latin America. Embraer is          Rosales.


             8 AMÉRICAECONOMÍA / 2012 - 2013


CHINA GI.indd 8                                                                                                                                       17/8/12 16:40:21
CHINA


                  The limits of Guanxi
                  T
                       he case of Pollo Campero is a classic case            has opened up a bit, but the economy is still centralized   did not see the upside of Guanxi. “By the way nego-
                       of misunderstood Guanxi. The Guatemalan               and controlled by the state.”                               tiations were going, we had the sensation that the
                       fast-food chain, whose secret chicken recipe          Regulations required Pallo Campero to operate for two       only thing that they wanted was the chicken recipe
                  is even sought by Kentucky Fried Chicken, has suc-         years before it could sell franchises in China, which is    so they could make it themselves.”
                  cessfully opened four hundred of its restaurants.          how the Guatemalans planned to drive growth. During         Gutierrez continued in China for another two years
                  Three hundred are in Latin America, while another          those two years, the government evaluated the quality       to secure approvals from the authorities that will let
                  hundred are spread across the United States, Spain,        of their business and its contribution to the community.    him return when the company is better prepared to
                  the Middle East, Indonesia, and India, making it one       Meanwhile, Gutiérrez realized that the Chinese market       tackle the market.
                  of Latin America’s most globalized businesses. In          was totally different from anything he had seen. Firstly,   “Lots of people tell us that if we had stayed we would
                  2006, the firm was attracted by the opportunity the        Chinese consumers demand more innovation than other         have quickly recovered the investment, although
                  Chinese market represented and so began work on            consumers. “In order to maintain a permanent flow of        it is not clear how many years of losses and how
                  opening its first restaurant in Shanghai. It studied       customers, we had to be changing the recipes and pro-       much investment we would have needed to make
                  locations, marketing and regulations before taking         motions, not every month like before, but every week,”      a return.” It took KFC more than ten years. Others,
                  the plunge. The plan was to have between 300 and           says Gutiérrez. “The same characteristic which sees the     such as Burger King and Pizza Hut, never made it.
                  500 restaurants within five years. By the middle           Chinese change mobile phones every three months meant       In addition, staying in China would have forced
                  of 2007, it had just four. Today the chain is not          they are always asking for new recipes and products         Campero to divert resources and talent which it
                  present in China.                                          at the restaurants where they dine. We were not fully       is today using to expand in new markets such as
                  “The state intervenes in the whole process: it owns        prepared for that.”                                         Europe and the United States, where it opened a large
                  the ground so you have to pay rent, it interferes in the   However, what led Gutierrez to finally abandon China        Pollo Campero restaurant in the middle of Disney
                  supplier structure and is permanently supervising the      was the attitude of the Chinese businessmen to whom         World, the successful tourism and entertainment
                  development of the business,” says Pollo Campero           he planned to sell the franchise.                           complex in Florida.
                  CEO Juan Jose Gutierrez from Guatemala. “It was            “They asked us for two years’ grace, paying nothing for     “The most curious thing is that 38% of the clients
                  to be expected: this is a Communist country which          use of the brand and our recipes,” says Gutierrez who       in that restaurant are Chinese.”

                 To a culture which has seen Dutch,                          term describes the network of recipro-                         Like networking, guanxi is a more
             Portuguese and British merchants come                           cal favors and connections on whose                         binding system than its equivalents in
             and go, the West’s economic presence                            strength business in China depends.                         the West. “When you recommend some-
             looks like another passing fad. Accord-                         Guanxi predates the Communist Party                         one in China, you are not just passing
             ing to Michael David, senior consultant                         and its bureaucracy and begins with an                      on a number, but extending a bond and
             for Boston Consulting Group in Beijing,                         individual’s own family, expanding                          imposing on the recommended party a
             the multilatinas are novices in this game                       through school, further education, etc.                     duty not to fail; if they do, you must bear
             who have a lot to learn from other for-                         Guanxi does not mean networking as it                       responsibility,” explains Julie Kim.
             eign firms which have been in China                             is often understood in Latin America, but                      Many foreigners are perplexed by how
             for longer. “You have to commit to a                            rather an exchange of duties and rights,                    their Chinese colleagues operate. “The
             long-term vision as the learning curve                          a chain of favors. The giving is known                      deadlines are often different. I have heard
             is long,” he says.                                              as Mianzi, and describes the attributes                     more than one Westerner complain of
                 China’s cultural nuances and subtle-                        of an individual who could be useful to                     having gone to eight meetings or seven
             ties represent an initial challenge on a                        the network. The giving back is called                      karaoke sessions and still not being able
             scale which is difficult to underestimate.                      Renqing and is a kind of debt which                         to close the deal,” says Kim.
             “In Latin America, people say don’t mix                         can be cashed in the future but whose
             business with friendship. But in Asia, it is                    content and size is unknown.                                GUANXI IN ACTION
             totally different,” says Julie Kim, director                        Each time that two people meet for                      Chilean shipping firm Compañía
             of the Asia-Pacific Center of the Diego                         the first time, a significant part of the                   Sudamericana de Vapores and Mexi-
             Portales University in Santiago, Chile.                         conversation is dedicated to exploring                      can bakers Bimbo are two of the few
             “This is the crucial difference one has to                      and measuring the implications of each                      multilatinas which have managed to
             understand to do business there.”                               other’s Guanxi. For Michael David, “it                      develop operations in China, although
                 This style and tradition can be ex-                         is not so different from other business                     middling in size.
             pressed in the key word Guanxi. Formed                          communities in the sense that one has                          Many companies from the region
             by the symbols Guan (meaning to mea-                            to develop relationships and trust. In                      have found success in China when
             sure, to seal, to involve) and Xi (to be,                       China, this is more important than a                        they have sought inputs for products
             connection, relation, to tie, to bind), the                     written agreement.”                                         which will be sold in Latin America.


                                                                                                                                                          2012 - 2013 / AMÉRICAECONOMÍA 9


CHINA GI.indd 9                                                                                                                                                                                   17/8/12 16:40:25
CHINA


             But trying to enter with more elaborate     in China in the 1950s under Mao.                    Some Mexican firms fell into this
             products and services can prove a head-         Chilean businessman Andrónico               trap. Cemex spent years announcing its
             ache. “In China, it is often unclear how    Luksic, whose family controls Madeco,           expansion into China but instead wa-
             one can make things work,” says BCG’s       regrets the decision sell his business in       gered on the US housing boom. Today
             Michael David. “It is a huge and very       China. “It´s a shame; if we had stayed          it is licking its wounds. In February,
             diverse country and it’s no use relying     we´d have hit the jackpot”, he says.            Lorenzo Zambrano announced that
             on the support of one well-connected            Impatience is leading mining firm           the cement giant now has permits and
             individual.”                                Vale and steelmaker Gerdau, both from           a local partner. Leopoldo Cedillo, CEO
                 Embraer is an interesting example       Brazil, to drop some investments in China.      of auto-parts maker Metalsa recently
             in this respect. Its Chinese operations     Vale´s plans to become the world’s largest      announced that the company will enter
             were headed by Guan Dongyuan, an            mining company ran into a Chinese Wall,         in China within five years.
             engineer with degrees from the Univer-      when it tried, but failed, to open an iron          Latin American impatience is com-
             sity of Sao Paulo and the China Europe      ore distribution center in China. “They         pounded by Chinese ignorance. “Latin
             International Business School. He was       don’t say no,                                                                America lacks
             previously a representative of the min-     but they take                                                                visibility,”
             ing company Vale in China. Will his         a long time                                                                  says David
             Guanxi prove as strong as than that of      to respond,”                                                                 who opened
             Jianwei Zhang, chairman of Canada’s         says Jose Car-                                                               BCG’s Shang-
             Bombardier, Embraer’s eternal rival         los Martins,                                                                 hai office in
             in regional jets? An engineer from the      Vale’s direc-                                                                1992. “The
             University of Tianjin, Zhang was a          tor of mar-                                                                  region would
             municipal civil servant between 1975        keting, sales                                                                benefit greatly
             and 1982. He completed an MBA at the        and strategy.                                                                from student
             University of Montreal and obtained a       “Time passes                                                                 exchanges
             doctorate in administration from the        and the mo-                                                                  with China
             same institution, before joining Bom-       ment comes
             bardier. Bombardier recently signed a       when you just give
                                                                                    Pollo Campero                                    and by send-
                                                                                                                              ing more cultural and
             deal with Commercial Aircraft Corp of       up.”                       wanted to open                            culinary products.”
             China (COMAC) to enter the market for           Marcelo Claure,                                                     But this has not
             narrow-body aircraft with 100-149 seats,    Brightstar´s Bolivian      500 restaurants                           been easy either. Pol-
             similar to those its Brazilian rival was
             not authorized to produce. The agree-
                                                         founder, has failed to
                                                         replicate its cellphone
                                                                                    in China. Today it                        lo Campero, Latin
                                                                                                                              America’s most in-
             ment surprised many analysts. “It is a      distribution business in   has none.                                 ternational fast-food
             deal which does not make any sense          the enormous Chinese                                                 chain, failed to break
             [for Bombardier],” says Teal Group’s        market. “He lacks the                                                the Chinese market,
             Abulafia.                                   patience to deal with                                                following the same
                 However, some interpret the agree-      the red-tape,” says a colleague.                recipe which has brought it success from
             ment with Bombardier as pure Guanxi.            David agrees that it is an error to think   India to the United States. It opened its
             The Canadians´ real interest in China       of China as a market which “is waiting          first restaurant in Shanghai in 2007, but
             lies with its railroad division which has   for you and your products.” Dozens of           plans to open 500 restaurants within
             signed juicy contacts for metro systems     foreigners and local firms are compet-          five years did not proper. Today Pollo
             in Guanzhou and Shenzhen, a train line      ing in an economy which is anything             Campero has no restaurants in China
             for Beijing airport and for high velocity   but Third World.                                (see box on previous page).
             trains. “Relations are crucial in China,”       “China is not a backwater backward              That’s bad news for Latin America’s
             says Bombardier CEO Pierre Beadoin in       market,” he warns. “Many companies              industrial ambition: unless we change
             a corporate video. “To achieve long-term    made the mistake of delaying their              strategy and become more patient, Latin
             success, one must have patience.”           plans to enter China, believing that it         America’s relationship with China will
                 And the Canadians have been very        was too early. Today they realize that          continue to be based on exporting raw
             patient: Bombardier struck its first deal   it is too late.”                                materials. ■


             10 AMÉRICAECONOMÍA / 2012 - 2013


CHINA GI.indd 10                                                                                                                                    17/8/12 16:40:30
INTRODUCCIÓN


           PREPARING
           FOR THE
           DOUBLE DIP
            Latin America’s 500 biggest companies increased their sales, but at a slower rate
            than in the previous two years. The likelihood of hard times will be the big test after
            the bonanza.


            T
                  he crisis which is terrifying    struck Ireland the following year and     predator, the financial markets first
                  Europe sometimes reminds         have continued to grow in drama and       attacked the young defenseless bathers
                  one of the soundtrack to the     intensity since 2011 and still there is   and then terrorized the entire beach,
                  movie Jaws. The jabbing bass     no sign of resolution                     while the coastguards (played by the
            chords which hit Greece in late 2009      Like Steven Spielberg’s terrible       European Central Bank, the IMF and


                                                                                                        2012 - 2013 / AMÉRICAECONOMÍA 11


500 INTRODUCCION GI.indd 11                                                                                                            17/8/12 16:41:35
INTRODUCTION


            the governments involved) have been          THE BILLIONAIRES´ CLUB
            unable to do anything to neutralize          Nº OF COMPANIES WITH SALES ABOVE US$1 BILLION
                                                         SOURCE: AMÉRICAECONOMÍA INTELLIGENCE
            the threat.
                Although the euro is living through      600                                                                                      500    500
            its darkest epoch so far, many econo-                                                                            437           456
            mists (and not necessarily those known       500
                                                                                                                                    419
            for their pessimism) believe that the
            Old Continent still faces years of slow                                                                   334
                                                         400                                                  302
            growth. Add some disappointing key
                                                                                                       262
            indicators in the United States and
            you have a gloomy scenario to which                   204      206                  219
                                                         300
                                                                                     187
            Latin American companies will have
            to learn to adapt.
                                                         200

            IT’S BEGINNING
            TO HURT A BIT                                100
            The 500 companies on the Améri-
            caEconomía ranking enjoyed a very              0
            profitable 2010, while 2011, without                  2000     2001      2002       2003   2004   2005    2006   2007   2008   2009   2010   2011
            being bad, showed signs of slowing sales
            in a number of key countries and sectors.
            For example, large mining companies,         in 2011 of half that size (which is still                   some interesting facts. In Brazil, the
            which in 2010 saw their revenues jump        good, but…), while                                                             decline of steelmak-
            by an astonishing 53%, saw an increase       sectors linked to do-              Sales slowed                                ing (Usiminas, Ger-
                                                         mestic consumption,                                                            dau and Aperam) and
            The Top 500 Through Time
                                                         such as construction               sharply in Brazil                           the oil industry was
                                                         and retail saw growth                                                          key: sales at Petrobras
                                                         slow to a similar or
                                                                                            and Mexico,                                 and its distribution
              YEAR      SALES        VAR.      MINIMUM
                                                         greater extent.                    moderated in                                arm were stagnant
             1991       324,069.8     3.9%       196.0      There are signifi-                                                          and, given the oil
             1992       375,102.7    15.7%       166.5   cant variations from               Chile, but grew in                          giant’s relative size,
             1993       402,867.2     7.4%       162.6   country to country.                                                            this had an impact
             1994       512,087.0    27.1%       193.5   These are related not
                                                                                            Argentina, Peru                             on the overall figures
             1995
             1996
                        544,318.2
                        553,580.3
                                      6.3%
                                      1.7%
                                                 215.5
                                                 267.2
                                                         only to the economic               and Colombia                                for South America’s
                                                         cycle, but also to                                                             largest economy.
             1997       645,180.0    16.5%       350.4
                                                         movements on the                                                                  Figures on Mexico
             1998       629,847.0    -2.4%       316.0
                                                         ranking and the addi-                                                          must be treated with
             1999       624,527.4    -0.8%       278.5
             2000       881,208.1    41.1%       357.7
                                                         tion and removal of                                                            caution, as the car
             2001       855,427.7    -2.9%       331.7   some companies from the list.                               industry in general does not publish
             2002       831,571.6    -2.8%       324.9      In 2011, there were some impor-                          results (Volkswagen is the only excep-
             2003       938,208.0    12.8%       362.0   tant developments: for a start, sales                       tion), so it is underrepresented in the
             2004     1,122,496.6    19.6%       464.3   slowed significantly in both Brazil                         figures. However, they fell as did key
             2005     1,364,398.2    21.6%       526.2   and Mexico. In Chile, the slowdown                          sectors such as telecommunications
             2006     1,581,618.0    15.9%       570.3   was moderate. Argentina saw slight                          (46.6%), cement (10%) and electric-
             2007     1,955,734.7    23.7%       821.8   growth while Colombia and Peru re-                          ity. 2011 was a bad year for the local
             2008     1,882,521.8    -3.7%       719.0   mained robust.                                              subsidiary of Spain’s Iberdrola, less
             2009     2,004,608.2     6.5%       901.6                                                               bad for Cemex and mediocre for the
             2010     2,338,493.4    16.7%      1052.9
                                                         WHAT’S HAPPENING?                                           businesses of billionaire Carlos Slim.
             2011     2,457,750.9     5.1%     1,109.5
                                                         A look inside each country throws up                        And it was definitely an awful year


            12 AMÉRICAECONOMÍA / 2012 - 2013


500 INTRODUCCION GI.indd 12                                                                                                                                     17/8/12 16:41:40
INTRODUCCIÓN

            The Top 500 by sector
              RK                                 NUMBER OF COMPANIES                                          TOTAL SALES (US$ MILLIONS)                                  VAR % PARTIC.
             2011                 SECTOR                                                                                                                                  11/10 % 2011
                                              05 06 07 08 09 10 11                  2005         2006         2007       2008       2009            2010        2011
              1     OIL & GAS                  34   35   32   37   38   38   39   377,666.0    447,073.3    494,022.7   506,996.6     454,060.0   537,149.2   592,555.3    10.3     24.1
              2     RETAIL                     71   72   70   74   74   74   70   140,382.6    162,591.0    196,662.9   187,507.1     230,735.7   281,654.6   284,439.8      1.0    11.6
              3     TELECOMMUNICATIONS         45   43   41   37   35   36   34   124,363.2    141,873.6    170,013.1   148,210.3     184,088.1   205,493.1   190,129.7     -7.5     7.7
              4     ELECTRICITY                45   46   44   43   53   49   45    92,450.9    104,646.7    130,432.0   119,015.4     147,918.2   167,669.3   162,142.1     -3.3     6.6
              5     AUTOMOBILES/AUTOPARTS      29   31   33   33   31   40   39    76,646.6     91,997.7    123,943.5   118,340.7     122,098.9   153,380.6   152,207.8     -0.8     6.2
              6     MINING                     27   36   33   32   31   35   44    64,959.4    103,226.0    126,094.4   107,332.4      97,383.1   149,119.5   185,294.6    24.3      7.5
              7     STEEL & METALLURGY         42   36   40   36   24   27   27    90,537.8     94,909.0    147,002.5   138,910.3      94,523.9   127,444.3   136,376.3      7.0     5.5
              8     CONGLOMERATES              25   29   14   15   17   15   20    86,221.7    108,558.0     92,377.7    88,093.6     110,111.5   123,439.6   144,094.5    16.7      5.9
              9     AGRIBUSINESS               15   14   20   19   17   18   17    26,965.8     26,685.1     58,003.6    64,640.5      84,006.5   108,425.8   114,448.7      5.6     4.7
              10 BEVERAGES & BREWING           18   19   15   15   17   16   16    49,835.4     58,308.4     63,686.9    54,849.0      73,723.4    79,009.8    80,831.0      2.3     3.3
              11 FOODS                         26   24   24   25   23   20   19    38,333.2     37,604.0     52,408.6    53,102.5      71,827.8    65,836.0    65,968.9      0.2     2.7
              12 CONSTRUCTION                   9    9   13   13   20   23   22    10,384.2     12,761.3     21,110.4    23,125.7      41,292.2    54,156.9    56,145.8      3.7     2.3
              13 TRANSPORT & LOGISTICS         19   15   17   19   18   18   20    29,761.5     23,521.4     31,737.8    35,454.1      36,448.5    46,787.7    54,882.1    17.3      2.2
              14 ELECTRONICS                   14   11   20   20   21   19   17    22,359.2     18,937.8     42,521.0    44,675.7      50,614.8    45,000.0    40,054.4    -11.0     1.6
              15 PETROCHEMICALS                36   13   14   14   12    8    7    57,268.7     43,633.7     57,552.8    59,191.1      54,573.4    30,948.3    34,697.9    12.1      1.4
              16 CHEMICALS & PHARMACEUTCALS    36   17   20   18   21   15   17    57,268.7     16,502.6     29,687.9    27,610.5      33,289.3    29,706.1    33,775.7    13.7      1.4
              17 CEMENT                         7    8    7    6    6    6    6    23,214.1     27,952.5     33,963.3    28,096.7      28,738.3    26,271.8    25,644.0     -2.4     1.0
              18 PULP & PAPER                  11   12    9   10    7    9    8    14,500.8     16,750.8     18,576.4    17,035.6      16,618.9    22,760.6    21,765.4     -4.4     0.9
              19 BASIC SERVICES                 8    3    6    6    6    6    5    11,125.1      4,733.5     11,526.5     9,846.7      13,508.4    18,798.3    17,878.3     -4.9     0.7
              20 MASS MEDIA                     7    7    6    5    5    5    5     9,403.7     10,854.6     12,237.4    10,475.1      13,484.7    15,894.2    15,492.4     -2.5     0.6
              21 HEALTH SERVICES                3    4    6    6    8    5    5     2,409.1      3,244.3      7,153.9     7,764.4      10,791.7    10,137.6    10,644.0      5.0     0.4
              22 GENERAL SERVICES               -    5   2    2     2   2    2             -     9,125.2      7,779.2     7,025.3       8,906.9     9,441.4     9,539.0      1.0     0.4
              23 MANUFACTURING                  -    4   8    8     6   5    6             -     4,006.9     13,310.4    12,037.3       8,501.8     8,360.5     8,783.6      5.1     0.4
              24 TEXTILES & FOOTWEAR            5    4   2    2     4   6    2      2,969.6      3,664.8      3,130.5     2,169.0       4,853.9     8,291.8     2,996.5    -63.9     0.1
              25 AEROSPACE                      1    1   1    1     1   1    1      3,902.0      3,912.0      5,636.2     5,026.4       6,209.9     5,630.0     5,255.4     -6.7     0.2
              26 MACHINERY & EQUIPMENT          3    2   3    4     3   2    3      4,528.6      4,543.8      5,163.1     5,989.9       6,298.4     3,726.8     5,050.6    35.5      0.2
              27 SOFTWARE & DATA SERVICES       -    -    -    -    -   1    3             -            -           -           -             -     2,396.4     5,018.0   109.4      0.2
              28 PRINTING                       -    -    -    -    -   1    1             -            -           -           -             -     1,563.1     1,639.1      4.9     0.1
                    TOTAL                     500 500 500 500 500 500 500 1,364,398.2 1,581,618.0 1,955,734.7 1,882,521.8 2,004,608.2 2,338,493.4 2,457,750.9               5.1    100.0

            for Movistar. But both beverages and                   panies on the ranking rose from 65 to                            its sales by 34%, vaulting past by
            retail had an excellent 2011.                          73; the number of Colombian firms                                Mexico’s Pemex.
               The strength of the figures for Co-                 from 26 to 28; and the Peruvians from                               Among the biggest movers on the
            lombia and Peru are explained by a                     22 to 30. Meanwhile, the number of                               ranking was Colombia’s Ecopetrol,
            hyperactive extractive industries sector               Brazilian, Mexican and Argentinean                               which scaled four places, becoming one
            (oil in the case of Colombia and min-                  companies all fell. A sign of the times                          of the region’s ten biggest companies
            ing in Peru) and other sectors which                   we are living through.                                           for the first time. Another is Chile’s
            depend on internal demand in two                          As is now traditional, the oil giants                         Copec, a holding with fingers in many
            countries which have been enjoying                     dominated the top of the ranking. Petro-                         pies, which increased its sales by 74%
            spectacular growth.                                    bras held onto the number one spot,                              and climbed eighteen places, thanks to
               Looking at regions, the going has                   with revenues totaling US$130.171                                audacious investments in Colombia,
            been good on South America’s Pacific                   billion, but was closely followed by                             and overtook state-owned Codelco as
            seaboard. The number of Chilean com-                   Venezuela’s PDVSA, which lifted                                  the country’s biggest company.


                                                                                                                                                  2012 - 2013 / AMÉRICAECONOMÍA 13


500 INTRODUCCION GI.indd 13                                                                                                                                                                17/8/12 16:41:45
INTRODUCTION

            The Top 500 by country
              RK                      NUMBER OF COMPANIES                                                      TOTAL SALES (US$ MILLIONS)                                                       VAR % PARTIC.
             2011       COUNTRY                                                                                                                                                                 11/10 % 2011
                                   05 06 07 08 09 10 11                     2005                2006         2007        2008          2009                      2010                2011
              1     BRAZIL         204 207 211 212 226 223 215             534,077.5           610,088.2    825,018.2          746,786.7       956,790.2       1,162,356.3       1,165,978.6       0.3      47.4
              2     MEXICO         138 111 134 126 119 117 110             490,811.1           532,016.3    645,721.6          588,245.5       580,695.4        600,552.6           598,752.7     -0.3      24.4
              3     CHILE           54   63   55   60   55   65   73       103,043.9           137,953.1    158,345.4          164,322.2       152,323.9        211,358.9           253,394.4     19.9      10.3
              4     ARGENTINA       36   41   36   35   33   32   30        65,585.2            88,240.6    107,736.8          117,493.5       105,376.7        113,654.2           124,793.6      9.8       5.1
              5     VENEZUELA       11   12    7    7    6    3    3        98,294.2           118,360.8    109,557.5          147,586.6        85,001.7        101,218.6           132,027.2     30.4       5.4
              6     COLOMBIA        30   35   31   28   30   26   28        36,037.8            46,945.5     58,597.4           59,484.0        65,998.8         74,797.4            97,268.4     30.0       4.0
              7     PERU            12   18   15   21   19   22   30        16,368.3            26,085.2     29,091.7           32,300.0        29,782.7         40,320.3            57,315.6     42.2       2.3
              8     ECUADOR          5    3    3    3    3    3    2         8,210.6             8,684.0      9,444.4           13,182.6        10,525.2         12,057.7             3,091.3    -74.4       0.1
              9     COSTA RICA       4    3    3    3    3    3    3         6,072.0             4,640.4      5,594.2            6,180.8            6,624.3        7,051.9            7,450.2      5.6       0.3
              10 BOLIVIA             -    -    -    -    1    1    1                -                  -               -                 -          4,000.0        4,400.0            5,102.0     16.0       0.2
              11 URUGUAY             2    2    2    2    2    2    2         2,188.3             2,230.7      2,933.0            2,725.9            3,295.8        3,851.9            4,733.4     22.9       0.2
              12 BRAZIL/PARAGUAY     -    -    -    -    -    1    1                -                  -               -                 -                -        3,450.5            3,652.1      5.8       0.1
              13 PANAMA              2    2    2    2    2    2    2         1,817.7             2,294.0      2,756.5            3,273.9            3,253.4        3,423.2            4,191.6     22.4       0.2
              14 EL SALVADOR         1    1    1    1    1    -    -           791.7              928.3            938.0           940.0             940.0               -                  -           -      -
              15 GUATEMALA           1    2    -    -    -    -    -         1,100.0             3,151.0               -                 -                -              -                  -           -      -
                    TOTAL          500 500 500 500 500 500 500           1,364,398.2      1,581,618.0      1,955,734.7        1,882,521.8    2,004,608.2       2,338,493.4       2,457,750.9      5.1       100.0


                The biggest profits were seen in                       growth in the Asian giant will slow.                                    decisions taken in Berlin, Brussels and
            the extractive industries, at companies                    Will Latin America, a link in the chain                                 other European capitals. An earthquake
            such as Brazil’s Vale and Petrobras                        between China and the developed                                         or just a tremor. A Great White or just
            and Colombia’s Ecopetrol, followed                         world, feel the repercussions? How                                      a catfish. Whatever the future holds,
            América Móvil and Ambev. We may                            serious will they be? It will depend on                                 it is best to be prepared. ■
            be rich in oil and mineral resources.
            But we also drink a lot of beer and
            soft drinks and could not live without                     ADECADEOFGROWTH
            our cellphones.                                            The Top 500 over the last ten years, in millons of US$
                                                                       SOURCE: AMÉRICAECONOMÍA INTELLIGENCE
                Mexico’s Pemex and Cemex once                                                                                                                            TOTAL                  SALES OF COMPANY
            again were at the bottom of the results                                                                                                                      SALES                        Nº 500
                                                                        3,000,000                                                                                                                             1200
            table. The state oil giant saw its profits
            fall 70% and reported a negative net
            worth of US$13.903 billion. Is it time                      2,500,000                                                                                                                             1000
            to find a new financial and ownership
            structure? It is not good to lack capital
                                                                        2,000,000                                                                                                                             800
            in times like these, even when your
            only shareholder is the state.
                As this edition went to print, Eu-                      1,500,000                                                                                                                             600
            rope’s leaders have begun cut the chat,
            raising the possibilities that the con-                     1,000,000                                                                                                                             400
            tinent will escape financial collapse.
            However, the immediate future will
            be marked by minimal growth in the                            500,000                                                                                                                             200

            Eurozone and a prolonged recession
            in many important countries.                                       0                                                                                                                              00
                Chinese exports will be hit and                                         2001        2002    2003       2004       2005       2006       2007      2008       2009        2010      2011


            14 AMÉRICAECONOMÍA / 2012 - 2013


500 INTRODUCCION GI.indd 14                                                                                                                                                                                         17/8/12 16:41:50
Aviso Falso


BASE PAGINA COMPLETA.indd 1                 26/04/2012 12:21:15
LATIN AMERICA´S LARGEST COMPANIES

                                                                                            SALES       SALES VARIATION IN NET PROFITS NET PROFITS VARIATION IN                     E
              RK   RK                                         COUN
                                          COMPANY                         SECTOR           2011 US$    2010 US$    SALES      2011         2010       PROFITS                      20
              11   10                                         -TRY
                                                                                            Millions    Millions 11/10 (%) US$ Millions US$ Millions 11/010 (%)                     M

               1     1   PETROBRAS                            BRA    Oil & Gas             130,171.7   128,000.0     1.7      17,759.4    21,119.5      -15.9                       3
               2     3   PDVSA                                VEN    Oil & Gas             124,754.0    94,929.0    31.4       4,496.0     3,202.0       40.4
               3     2   PEMEX                                MEX    Oil & Gas             111,734.6   103,814.2     7.6      -6,559.1    -3,843.3      -70.7
               4     4   VALE                                 BRA    Mining                 55,014.1    49,949.0    10.1      20,158.7    18,047.1       11.7                       3
               5     5   AMÉRICA MÓVIL                        MEX    Telecommunications     47,700.1    49,220.7    -3.1       5,940.3     7,378.6      -19.5                       1
               6     6   PETROBRAS DISTRIBUIDORA              BRA    Oil & Gas              39,654.0    39,655.8    -0.0         675.0       750.0      -10.0
               7     8   ODEBRECHT                            BRA    Conglomerate           33,659.0    28,203.3    19.3          24.0     1,486.0      -98.4
               8    12   ECOPETROL                            COL    Oil & Gas              33,194.8    21,610.7    53.6       7,801.1     4,194.3       86.0                       1
               9     7   JBS FRIBOI                           BRA    Agribusiness           32,944.2    33,042.7    -0.3         -40.4      -181.7       77.8
              10     9   WAL MART DE MÉXICO Y CENTROAMÉRICA   MEX    Retail                 27,309.8    27,195.8     0.4       1,595.5     1,583.1        0.8
              11    10   ULTRAPAR                             BRA    Oil & Gas              25,941.6    25,496.2     1.7         452.5       459.3       -1.5
              12    14   CBD - GRUPO PÃO DE AÇÚCAR            BRA    Retail                 24,839.8    19,260.4    29.0         382.9       433.6      -11.7
              13    15   TECHINT                              ARG    Steel & Metallurgy     24,105.0    19,092.0    26.3          N.A.        N.A.          -
              14    11   IPIRANGA PRODUTOS DE PETRÓLEO        BRA    Oil & Gas              22,461.0    21,795.5     3.1         356.0       312.0       14.1
              15    33   EMPRESAS COPEC                       CHI    Conglomerate           21,132.0    12,149.8    73.9         932.7     1,013.8       -8.0
              16    13   COMISIÓN FEDERAL DE ELECTRICIDAD     MEX    Electricity            20,931.1    20,601.3     1.6      -1,230.9        65.5   -1,978.8
              17    16   GERDAU                               BRA    Steel & Metallurgy     18,875.6    18,841.2     0.2       1,069.3     1,285.9      -16.8
              18    21   BRASKEM                              BRA    Petrochemicals         17,686.4    15,301.2    15.6        -280.0     1,137.5     -124.6
              19    17   ELETROBRÁS                           BRA    Electricity            17,625.2    17,893.8    -1.5       1,989.9     1,349.1       47.5
              20    20   CODELCO                              CHI    Mining                 17,515.3    16,065.9     9.0       2,055.4     1,876.3        9.5
              21    49   TELESP                               BRA    Telecommunications     15,528.7     9,456.3    64.2       2,321.8     1,439.7       61.3
              22    23   CARREFOUR                            BRA    Retail                 15,333.0    14,745.6     4.0          N.A.        N.A.          -
              23    28   VOLKSWAGEN                           BRA    Carmaking              15,038.8    13,594.4    10.6          N.A.        N.A.          -
              24    19   TELEMAR                              BRA    Telecommunications     14,877.4    17,694.4   -15.9          68.5     1,140.5      -94.0
              25    26   FEMSA                                MEX    Beverages & Brewing    14,557.7    13,741.5     5.9       1,085.0     3,259.3      -66.7
              26    29   CENCOSUD                             CHI    Retail                 14,515.4    13,226.1     9.7         548.3       632.5      -13.3
              27    22   AMBEV                                BRA    Beverages & Brewing    14,461.4    15,144.2    -4.5       4,606.6     4,538.1        1.5
              28    27   BRF FOODS                            BRA    Foods                  13,704.1    13,612.6     0.7         729.0       482.6       51.1
              29    24   CEMEX                                MEX    Cement                 13,546.2    14,434.5    -6.2      -1,371.3    -1,337.4       -2.5
              30    36   YPF                                  ARG    Oil & Gas              13,124.3    11,013.0    19.2       1,225.9     1,443.9      -15.1
              31    35   GRUPO ALFA                           MEX    Conglomerate           13,103.6    11,044.5    18.6         373.2       398.9       -6.4
              32    18   GRUPO VOTORANTIM                     BRA    Conglomerate           12,618.0    17,705.1   -28.7         683.0     1,684.0      -59.4
              33    34   WAL MART                             BRA    Retail                 12,509.0    11,356.2    10.2          N.A.        N.A.          -
              34    37   BUNGE ALIMENTOS (1)                  BRA    Agribusiness           12,340.0    10,899.0    13.2          N.A.        N.A.          -
              35    39   COSAN                                BRA    Agribusiness           12,214.7    10,712.0    14.0       1,565.8       359.7      335.3
              36    30   ENERSIS                              CHI    Electricity            11,993.7    13,193.1    -9.1         720.0     1,038.1      -30.6
              37    46   MARFRIG                              BRA    Agribusiness           11,667.0     9,529.7    22.4        -397.7        84.1     -572.9
              38    45   NORBERTO ODEBRECHT                   BRA    Construction           11,478.0     9,728.1    18.0         490.0       652.0      -24.8
              39    32   FIAT AUTOMÓVEIS                      BRA    Carmaking              11,464.0    12,405.3    -7.6         744.0       862.0      -13.7
              40    31   GENERAL MOTORS DE MÉXICO (1)         MEX    Carmaking              11,425.3    12,850.0   -11.1          N.A.        N.A.          -
              41    98   VIAVAREJO                            BRA    Retail                 11,204.1     5,165.1   116.9          48.2       -37.9      227.2
              42    43   COCA-COLA                            BRA    Beverages & Brewing    11,000.0    10,000.0    10.0          N.A.        N.A.          -
              43    54   GRUPO BAL (1)                        MEX    Conglomerate           10,935.4     9,033.8    21.1       1,112.6       729.3       52.6
              44    64   ENAP                                 CHI    Oil & Gas              10,834.8     8,179.9    32.5         -67.0        70.1     -195.6
              45    38   VIVO                                 BRA    Telecommunications     10,327.0    10,866.6    -5.0       1,610.0        N.A.          -
              46    58   CARGILL                              BRA    Agribusiness           10,065.0     8,646.9    16.4         119.0        51.0      133.3
              47    68   TENARIS                              ARG    Steel & Metallurgy      9,972.5     7,711.6    29.3       1,331.2     1,127.4       18.1
              48    44   FORD MOTOR COMPANY (1)               MEX    Carmaking               9,714.9     9,797.9    -0.8          N.A.        N.A.          -
              49    47   GENERAL MOTORS                       BRA    Carmaking               9,635.0     9,513.0     1.3          N.A.        N.A.          -
              50    48   GRUPO BIMBO                          MEX    Foods                   9,586.7     9,487.2     1.0         382.1       436.8      -12.5


             16 AMÉRICAECONOMÍA / 2012 - 2013


RANKING 500 GI.indd 16                                                                                                                                          17/8/12 16:42:41
Nº 3
                                                            Juan José Suárez Coppel, CEO of Pemex:
                                   T he Mexican oil giant tried, but failed, to take a stake in Repsol.


     EBITDA      EBITDA VARIATION     TOTAL     NET EQUITY WORK- EXPORTS                    NET    NET   EXPORT. Listed on
                                                                          ROE          ROA                                 OWNER-                                                RK
    2011 US$    2010 US$ IN EBITDA ASSETS 2011 2011 US$ FORCE 2011 US$                     MARGIN EBITDA  AS %    STOCK                              WEBSITE (www.)
                                                                          (%)          (%)                                  SHIP                                                 11
     Millions    Millions 11/10 (%) US$ Millions Millions   2011 Millions                   (%)    (%) OF SALES EXCHANGE

     33,035.6   36,283.6    -9.0    319,410.4   175,839.0    81,918 22,912.2    10.1    5.6    13.6   25.4   17.6         Yes            S      petrobras.com                      1
         N.A.       N.A.       -    182,154.0    73,883.0    80,000 122,451      6.1    2.5     3.6      -   98.2         No             S      pdvsa.com                          2
         N.A.   51,985.7       -    109,936.2   -13,903.4   150,884 50,378         -   -6.0    -5.9      -   45.1         Yes            S      pemex.com                          3
     31,997.0   27,717.9    15.4    128,896.0    76,487.6    79,646 34,653.1    26.4   15.6    36.6   58.2   63.0         Yes            P      vale.com                           4
     17,836.2   19,708.6    -9.5     67,797.8    20,479.5   158,694        -    29.0    8.8    12.5   37.4      -         Yes            P      americamovil.com                   5
      1,051.0    1,076.0    -2.3      9,086.0     5,383.0     4,505 1,217.9     12.5    7.4     1.7    2.7    3.1         No             S      br.com.br                          6
      3,793.0    3,319.0    14.3     51,124.0     9,592.0   159,036 6,983.2      0.3    0.0     0.1   11.3   20.7         No             P      odebrecht.com.br                   7
     15,206.5       N.A.       -     46,585.9    27,609.5      N.A. 15,270      28.3   16.7    23.5   45.8   46.0         Yes            S      ecopetrol.com.co                   8
      1,637.7    2,108.3   -22.3     25,275.0    11,016.0   125,000 2,552.2     -0.4   -0.2    -0.1    5.0    7.7         Yes            P      friboi.com.br                      9
      2,677.4    2,706.1    -1.1     16,133.7     9,533.0   238,128        -    16.7    9.9     5.8    9.8      -         Yes            P*     walmartmexico.com.mx              10
      1,083.4    1,066.1     1.6      7,326.3     2,959.3     9,055        -    15.3    6.2     1.7    4.2      -         Yes            P      ultra.com.br                      11
      1,516.1    1,225.2    23.7     18,002.5     4,065.1   149,000        -     9.4    2.1     1.5    6.1      -         Yes            P      grupopaodeacucar.com.br           12
         N.A.       N.A.       -     31,364.0        N.A.    57,359        -       -      -       -      -      -         No             P      techint.com                       13
        709.0      572.0    24.0      4,084.0     1,218.0     2,434        -    29.2    8.7     1.6    3.2      -         No             P      ipiranga.com.br                   14
         N.A.       N.A.       -     20,094.9     9,813.1    20,195 1,732.8      9.5    4.6     4.4      -    8.2         Yes            P      empresascopec.cl                  15
         N.A.       N.A.       -     64,987.0    22,454.3    98,389        -    -5.5   -1.9    -5.9      -      -         No             S      cfe.gob.mx                        16
      2,479.4    3,323.5   -25.4     26,645.6    13,326.3    42,820 1,251.2      8.0    4.0     5.7   13.1    6.6         Yes            P      gerdau.com.br                     17
      1,946.5    2,893.6   -32.7     19,913.7     5,190.3    34,638    6,500    -5.4   -1.4    -1.6   11.0   36.7         Yes            P      braskem.com.br                    18
      3,385.0    3,603.3    -6.1     86,972.2    40,965.7    30,562        -     4.9    2.3    11.3   19.2      -         Yes            S      eletrobras.gov.br                 19
      8,813.0    7,435.0    18.5     20,834.9     6,065.0    18,211 16,213.7    33.9    9.9    11.7   50.3   92.6         No             S      codelco.cl                        20
      5,535.4    3,277.1    68.9     34,913.1    23,097.2     7,000        -    10.1    6.7    15.0   35.6      -         Yes            P*     telesp.com.br                     21
         N.A.       N.A.       -         N.A.        N.A.    59,490        -       -      -       -      -      -         No             P*     carrefour.com.br                  22
         N.A.       N.A.       -         N.A.        N.A.    24,000 1,945.9        -      -       -      -   12.9         No             P*     volkswagen.com.br                 23
      4,599.2    6,189.6   -25.7     42,542.4    10,901.2    13,224        -     0.6    0.2     0.5   30.9      -         Yes            P      telemar.com.br                    24
      2,188.8    2,246.9    -2.6     19,695.4     9,577.3   177,470    7,294    11.3    5.5     7.5   15.0   50.1         Yes            P      femsa.com                         25
         N.A.       N.A.       -     14,391.4     5,512.3   131,505        -     9.9    3.8     3.8      -      -         Yes            P      cencosud.cl                       26
      7,018.2    6,956.1     0.9     24,597.2    13,653.5    46,500        -    33.7   18.7    31.9   48.5      -         Yes            P*     ambev.com.br                      27
      1,539.3    1,395.4    10.3     15,984.4     7,501.0   118,859 2,319.7      9.7    4.6     5.3   11.2   16.9         Yes            P      brasilfoods.com                   28
      1,487.6    1,756.2   -15.3     39,311.3    13,695.3    44,104 10,816     -10.0   -3.5   -10.1   11.0   79.8         Yes            P      cemexmexico.com                   29
      3,247.5    3,677.8   -11.7     12,823.8     4,336.8    10,400        -    28.3    9.6     9.3   24.7      -         Yes            P*     ypf.com.ar                        30
      1,414.9    1,259.1    12.4      9,934.4     2,563.7    56,978    6,847    14.6    3.8     2.8   10.8   52.3         Yes            P      alfa.com.mx                       31
      2,826.0    3,520.0   -19.7     34,066.0    14,915.0    75,400 5,810.0      4.6    2.0     5.4   22.4   46.0         No             P      votorantim.com.br                 32
         N.A.       N.A.       -         N.A.        N.A.    81,504        -       -      -       -      -      -         No             P*     walmartbrasil.com.br              33
         N.A.       N.A.       -         N.A.        N.A.     6,500 6,539.1        -      -       -      -   53.0         No             P*     bunge.com.br                      34
      3,081.4    1,105.5   178.7     12,178.8     4,784.1    37,614    950.2    32.7   12.9    12.8   25.2    7.8         Yes            P      cosan.com.br                      35
      3,809.3    4,623.1   -17.6     26,337.3     7,470.8    10,884        -     9.6    2.7     6.0   31.8      -         Yes            P*     enersis.cl                        36
        945.6      905.3     4.5     12,700.4     3,056.7    84,535    929.2   -13.0   -3.1    -3.4    8.1    8.0         Yes            P      marfrig.com.br                    37
      1,227.0      962.0    27.5     10,841.0     2,592.0   124,356    335.7    18.9    4.5     4.3   10.7    2.9         No             P      odebrecht.com                     38
         N.A.       N.A.       -      6,991.0     1,031.0    15,805 1,653.3     72.2   10.6     6.5      -   14.4         No             P*     fiat.com.br                        39
         N.A.       N.A.       -      4,140.6       912.4    13,000        -       -      -       -      -      -         No             P*     gm.com.mx                         40
        538.1      221.7   142.7      6,224.0     1,405.6      N.A.        -     3.4    0.8     0.4    4.8      -         Yes            P      pontofrio.com.br                  41
         N.A.       N.A.       -         N.A.        N.A.    53,000        -       -      -       -      -      -         No             P*     coca-cola.com                     42
         N.A.       N.A.       -     14,777.5     5,522.0    42,161        -    20.1    7.5    10.2      -      -         No             P      bal.com.mx                        43
        138.0      402.0   -65.7      6,202.5       381.0     2,896    259.8   -17.6   -1.1    -0.6    1.3    2.4         No             S      enap.cl                           44
         N.A.       N.A.       -     10,352.0     4,632.0    11,286        -    34.8   15.6    15.6      -      -         Yes            P*     vivo.com.br                       45
         N.A.       N.A.       -      4,536.0       735.0     8,491 4,024.1     16.2    2.6     1.2      -   40.0         No             P*     cargill.com.br                    46
      2,449.1    2,080.4    17.7     14,863.6    10,506.2    22,000        -    12.7    9.0    13.3   24.6      -         Yes            P      tenaris.com                       47
         N.A.       N.A.       -         N.A.        N.A.     7,999        -       -      -       -      -      -         No             P*     ford.com.mx                       48
         N.A.       N.A.       -         N.A.        N.A.    21,400 1,857.2        -      -       -      -   19.3         No             P*     chevrolet.com.br                  49
      1,018.2    1,175.6   -13.4     10,144.2     3,467.6   127,000    5,229    11.0    3.8     4.0   10.6   54.5         Yes            P      grupobimbo.com.mx                 50
                                                                                                                    P: Privately-owned         S: State-owned        P*: Foreign-owned

                                                                                                                                              2012 - 2013 / AMÉRICAECONOMÍA 17


RANKING 500 GI.indd 17                                                                                                                                                                17/8/12 16:42:48
LATIN AMERICA´S LARGEST COMPANIES

                                                                                              SALES       SALES VARIATION IN NET PROFITS NET PROFITS VARIATION IN                     E
              RK   RK                                         COUN
                                          COMPANY                          SECTOR            2011 US$    2010 US$    SALES      2011         2010       PROFITS                      20
              11   10                                         -TRY
                                                                                              Millions    Millions 11/10 (%) US$ Millions US$ Millions 11/010 (%)                     M

              51    53   EXTRA                                BRA    Retail                    9,342.0     8,323.0    12.2          N.A.        N.A.          -
              52    59   VOLKSWAGEN DE MÉXICO (1)             MEX    Carmaking                 9,339.8     8,605.4     8.5         142.7        63.9      123.3
              53    62   GRUPO MÉXICO                         MEX    Mining                    9,296.4     8,320.1    11.7       2,098.8     1,775.6       18.2
              54    55   FALABELLA                            CHI    Retail                    9,267.9     8,923.3     3.9         811.3       882.5       -8.1
              55    41   GRUPO ARCELOR MITTAL                 BRA    Steel & Metallurgy        9,218.0    10,181.7    -9.5         -92.0       772.0     -111.9
              56    70   TERNIUM                              ARG    Steel & Metallurgy        9,157.2     7,382.0    24.0          N.A.       779.5          -
              57    56   TIM BRASIL                           BRA    Telecommunications        9,108.6     8,676.9     5.0         683.0     1,327.4      -48.5
              58    42   GRUPO CAMARGO CORRÊA                 BRA    Conglomerate              8,968.0    10,169.2   -11.8         460.0       664.0      -30.7
              59    61   COCA - COLA FEMSA                    MEX    Beverages & Brewing       8,941.7     8,377.3     6.7         761.0       793.6       -4.1
              60    57   CSN                                  BRA    Steel & Metallurgy        8,806.7     8,672.7     1.5       1,975.7     1,510.2       30.8
              61    67   CEMIG                                BRA    Electricity               8,430.7     7,720.2     9.2       1,287.7     1,355.2       -5.0
              62    63   NISSAN MEXICANA (1)                  MEX    Carmaking                 8,079.0     8,302.3    -2.7          N.A.        N.A.          -
              63    52   TELÉFONOS DE MÉXICO                  MEX    Telecommunications        8,034.8     9,195.7   -12.6       1,045.5     1,245.8      -16.1
              64    66   COPEC COMBUSTIBLES                   CHI    Oil & Gas                 7,969.7     7,775.4     2.5          N.A.        N.A.          -
              65   137   CASAS BAHIA                          BRA    Retail                    7,671.0     3,885.8    97.4          95.0      -152.0      162.5
              66    83   CHRYSLER (1)                         MEX    Carmaking                 7,528.2     6,316.0    19.2          N.A.        N.A.          -
              67    51   ESCONDIDA                            CHI    Mining                    7,419.5     9,211.5   -19.5       2,775.2     4,338.2      -36.0
              68    76   ORGANIZACIÓN TECHINT MÉXICO          MEX    Steel & Metallurgy        7,213.2     7,076.1     1.9          N.A.        N.A.          -
              69    75   TELMEX INTERNACIONAL                 MEX    Telecommunications        7,057.0     7,139.8    -1.2         267.9       399.1      -32.9
              70    72   CORREIOS E TELÉGRAFOS                BRA    Servicios Generales       7,047.0     7,281.1    -3.2         470.0       436.0        7.8
              71    69   ORGANIZACIÓN SORIANA                 MEX    Retail                    7,045.1     7,587.3    -7.1         219.4       265.5      -17.4
              72    60   GRUPO ANDRADE GUTIERREZ              BRA    Conglomerate              7,025.0     8,483.8   -17.2         796.0       624.0       27.6
              73    95   INDUSTRIAS PEÑOLES                   MEX    Mining                    6,944.9     5,202.7    33.5         914.5       520.3       75.8
              74    79   TAM                                  BRA    Transport & Logistics     6,927.4     6,829.1     1.4        -178.6       382.6     -146.7
              75    73   CPFL ENERGÍA                         BRA    Electricity               6,804.6     7,216.3    -5.7         815.9       923.2      -11.6
              76    77   CLARO TELECOM                        BRA    Telecommunications        6,597.0     7,025.8    -6.1        -131.0       780.0     -116.8
              77    78   GRUPO MODELO                         MEX    Beverages & Brewing       6,539.0     6,884.3    -5.0         856.4       805.2        6.4
              78    80   EMBRATEL                             BRA    Telecommunications        6,521.6     6,740.5    -3.2         208.6       433.9      -51.9
              79   104   ALPEK                                MEX    Petrochemicals            6,500.5     4,954.7    31.2         307.7       203.0       51.6
              80    81   UNILEVER                             BRA    Conglomerate              6,470.0     6,723.2    -3.8          N.A.        N.A.          -
              81    65   USIMINAS                             BRA    Steel & Metallurgy        6,345.0     7,779.6   -18.4         124.3       943.4      -86.8
              82   112   ANTOFAGASTA PLC                      CHI    Mining                    6,076.0     4,577.1    32.7       2,130.0     1,820.7       17.0
              83    86   SAM´S CLUB                           MEX    Retail                    6,004.0     6,142.8    -2.3          N.A.        N.A.          -
              84   103   COPERSUCAR                           BRA    Agribusiness              5,987.0     4,967.1    20.5          54.0       189.0      -71.4
              85    84   GLOBO COMUNICAÇÕES E PARTICIPAÇÕES   BRA    Mass Media                5,854.0     5,233.0    11.9       1,156.0     1,463.0      -21.0
              86   119   GRUPO EPM                            COL    Basic Services            5,853.9     4,320.1    35.5         766.7       726.3        5.6
              87   118   LAN                                  CHI    Transport & Logistics     5,585.4     4,390.5    27.2         320.2       419.7      -23.7
              88    88   LOJAS AMERICANAS                     BRA    Retail                    5,438.5     5,634.7    -3.5         181.5       185.8       -2.3
              89    90   GRUPO SALINAS                        MEX    Conglomerate              5,393.0     5,597.2    -3.6          N.A.        N.A.          -
              90   101   OXXO (FEMSA COMERCIO)                MEX    Retail                    5,313.6     5,034.9     5.5         337.4       420.5      -19.8
              91    96   GRUPO CARSO                          MEX    Conglomerate              5,303.8     5,198.2     2.0         328.4       546.0      -39.9
              92    92   SABESP                               BRA    Basic Services            5,299.9     5,540.2    -4.3         652.2       978.5      -33.3
              93    89   EMBRAER                              BRA    Ind. Aeroespacial         5,255.4     5,630.0    -6.7          83.3       344.3      -75.8
              94    87    AES ELETROPAULO                     BRA    Electricity               5,243.4     5,819.9    -9.9         838.1       808.8        3.6
              95    94   NEOENERGIA                           BRA    Electricity               5,208.9     5,371.5    -3.0         827.2     1,067.1      -22.5
              96    93   SUDAMERICANA DE VAPORES              CHI    Transport & Logistics     5,151.9     5,452.3    -5.5      -1,249.8       170.8     -831.7
              97   105   TERNIUM MÉXICO                       MEX    Steel & Metallurgy        5,150.4     4,893.0     5.3         270.2        N.A.          -
              98   116   YPFB (1)                             BOL    Oil & Gas                 5,102.0     4,785.5     6.6          N.A.        N.A.          -
              99    74   NESTLÉ                               BRA    Foods                     5,082.0     5,992.0   -15.2          N.A.        N.A.          -
             100   106   WALMART CHILE                        CHI    Retail                    4,994.6     4,860.9     2.8         218.4        89.1      145.1


             18 AMÉRICAECONOMÍA / 2012 - 2013


RANKING 500 GI.indd 18                                                                                                                                            17/8/12 16:42:55
Nº 93
                                                           Federico Fleury Curado, CEO of Embraer:
                                    sealed an alliance with Boeing and relaunched its military arm.


     EBITDA      EBITDA VARIATION     TOTAL     NET EQUITY WORK- EXPORTS                   NET    NET   EXPORT. Listed on
                                                                          ROE         ROA                                 OWNER-                                                  RK
    2011 US$    2010 US$ IN EBITDA ASSETS 2011 2011 US$ FORCE 2011 US$                    MARGIN EBITDA  AS %    STOCK                                 WEBSITE (www.)
                                                                          (%)         (%)                                  SHIP                                                   11
     Millions    Millions 11/10 (%) US$ Millions Millions   2011 Millions                  (%)    (%) OF SALES EXCHANGE

         N.A.       N.A.        -       N.A.       N.A.    30,000         -      -       -       -       -       -         No             P      extra.com.br                      51
         N.A.       N.A.        -    4,245.1    1,827.2    17,297     6,825    7.8     3.4     1.5       -    73.1         Yes            P*     vw.com.mx                         52
      4,648.5    3,881.6     19.8   16,683.3    8,358.0    26,990     5,756   25.1    12.6    22.6    50.0    61.9         Yes            P      gmexico.com.mx                    53
         N.A.       N.A.        -   14,889.1    5,214.2    84,565       2.4   15.6     5.4     8.8       -       -         Yes            P      falabella.cl                      54
      1,280.0    1,920.0    -33.3   16,859.0    7,675.0    22,000   1,975.6   -1.2    -0.5    -1.0    13.9    21.4         Yes            P*     arcelormittal.com.br              55
      1,671.1    1,437.2     16.3       N.A.       N.A.    24,000         -      -       -       -    18.2       -         No             P      ternium.com                       56
      2,472.1    2,516.9     -1.8   12,495.1    6,907.3    10,266         -    9.9     5.5     7.5    27.1       -         No             P*     timbrasil.com.br                  57
      1,120.0    1,902.7    -41.1   18,750.0    5,500.0    58,400         -    8.4     2.5     5.1    12.5       -         No             P      camargocorrea.com.br              58
      1,625.5    1,597.6      1.7   10,869.8    7,004.0    78,979         -   10.9     7.0     8.5    18.2       -         Yes            P      cocacolafemsa.com                 59
      3,574.6    3,483.7      2.6   24,986.5    4,257.3    20,000   1,002.2   46.4     7.9    22.4    40.6    11.4         Yes            P      csn.com.br                        60
      2,898.5    2,769.2      4.7   19,915.6    6,261.3     8,706         -   20.6     6.5    15.3    34.4       -         Yes            P*     cemig.com.br                      61
         N.A.       N.A.        -       N.A.       N.A.    11,500         -      -       -       -       -       -         No             P*     nissan.com.mx                     62
      3,120.1    3,713.7    -16.0   11,526.1    3,497.3    53,000         -   29.9     9.1    13.0    38.8       -         Yes            P      telmex.com.mx                     63
         N.A.       N.A.        -       N.A.       N.A.      N.A.         -      -       -       -       -       -         Yes            P      copec.cl                          64
         N.A.       N.A.        -    3,656.0      713.0    56,000         -   13.3     2.6     1.2       -       -         No             P      casasbahia.com.br                 65
         N.A.       N.A.        -       N.A.       N.A.     6,200     4,757      -       -       -       -    63.2         No             P*     chryslerdemexico.com.mx           66
         N.A.       N.A.        -    8,640.4    5,766.9     3,704   6,198.2   48.1    32.1    37.4       -    83.5         No             P*     mineraescondida.cl                67
         N.A.       N.A.        -       N.A.       N.A.    17,663         -      -       -       -       -       -         No             P*     techint.com                       68
      1,795.3    2,179.9    -17.6   14,802.3    7,341.2    25,000         -    3.6     1.8     3.8    25.4       -         Yes            P      telmexinternacional.com           69
        676.0      733.0     -7.8    5,601.0    2,063.0   114,976         -   22.8     8.4     6.7     9.6       -         No             S      correios.com.br                   70
        492.7      577.8    -14.7    5,311.6    2,718.9    84,911         -    8.1     4.1     3.1     7.0       -         Yes            P      soriana.com                       71
         N.A.       N.A.        -   15,891.0    4,215.0    16,600         -   18.9     5.0    11.3       -       -         No             P      andradegutierrez.com.br           72
      2,261.2    1,332.5     69.7    5,788.1    2,966.6     9,596     5,154   30.8    15.8    13.2    32.6    74.2         Yes            P      penoles.com.mx                    73
        932.0    1,028.3     -9.4    8,521.8    1,094.4    29,768         - -16.3     -2.1    -2.6    13.5       -         Yes            P      tam.com.br                        74
      2,053.4    2,059.2     -0.3   14,614.1    3,767.5      N.A.         -   21.7     5.6    12.0    30.2       -         Yes            P      cpfl.com.br                        75
         N.A.       N.A.        -   12,251.0    5,327.0     9,485         -   -2.5    -1.1    -2.0       -       -         No             P*     claro.com.br                      76
      1,913.3    1,983.3     -3.5    9,256.5    5,867.0    37,303     2,673   14.6     9.3    13.1    29.3    40.9         Yes            P      gmodelo.com                       77
      1,818.7    2,066.2    -12.0   11,768.2    5,576.6      N.A.         -    3.7     1.8     3.2    27.9       -         Yes            P*     embratel.com.br                   78
         N.A.       N.A.        -    4,083.9    1,105.4     4,514     3,575   27.8     7.5     4.7       -    55.0         No             P      alfa.com.mx                       79
         N.A.       N.A.        -       N.A.       N.A.    13,639         -      -       -       -       -       -         No             P*     unilever.com.br                   80
        826.2    1,777.2    -53.5   17,784.6    9,214.1    51,182     816.8    1.3     0.7     2.0    13.0    12.9         Yes            P      usiminas.com.br                   81
      3,660.0    2,771.9     32.0   11,705.2       N.A.     4,956         -      -    18.2    35.1    60.2       -         Yes            P      antofagasta.co.uk                 82
         N.A.       N.A.        -       N.A.       N.A.    26,688         -      -       -       -       -       -         No             P*     sams.com.mx                       83
        133.0      217.0    -38.7    1,511.0      109.0       510   2,180.6   49.5     3.6     0.9     2.2    36.4         No             P      copersucar.com.br                 84
         N.A.    1,500.6        -    2,779.0    3,406.0    12,000         -   33.9    41.6    19.7       -       -         No             P      globopar.com.br                   85
      1,823.9    1,484.7     22.8   17,182.9   10,043.1      N.A.         -    7.6     4.5    13.1    31.2       -         No             S      eeppm.com.co                      86
         N.A.       N.A.        -    7,648.7    1,445.3    21,838     394.9   22.2     4.2     5.7       -     7.1         Yes            P      lan.com                           87
        702.5      737.9     -4.8    5,091.2      368.1    15,596         -   49.3     3.6     3.3    12.9       -         Yes            P      americanas.com.br                 88
         N.A.       N.A.        -       N.A.       N.A.    67,035         -      -       -       -       -       -         No             P      gruposalinas.com                  89
         N.A.       N.A.        -    1,935.7       N.A.    83,820         -      -    17.4     6.3       -       -         No             P      oxxo.com                          90
        617.9      655.7     -5.8    5,185.9    2,507.2    68,623       962   13.1     6.3     6.2    11.7    18.1         Yes            P      gcarso.com.mx                     91
      1,665.0    1,935.2    -14.0   13,442.3    5,622.1    14,896         -   11.6     4.9    12.3    31.4       -         Yes            S      sabesp.com.br                     92
        492.0      641.6    -23.3    8,858.3    3,007.4    15,989   4,209.2    2.8     0.9     1.6     9.4    80.1         Yes            P      embraer.com                       93
      1,518.2    1,384.3      9.7    5,739.4    2,137.6     5,668         -   39.2    14.6    16.0    29.0       -         Yes            P*     aeseletropaulo.com.br             94
      1,519.4    1,781.0    -14.7   11,533.6    5,886.7     5,137         -   14.1     7.2    15.9    29.2       -         No             P*     neoenergia.com                    95
       -967.0      297.4   -425.2    3,179.5      585.5    11,769      56.0 -213.5   -39.3   -24.3   -18.8     1.1         Yes            P      csav.cl                           96
         N.A.       N.A.        -    4,660.4    1,685.0     9,832         -   16.0     5.8     5.2       -       -         No             P*     ternium.com.mx                    97
         N.A.       N.A.        -       N.A.       N.A.      N.A.         -      -       -       -       -       -         No             S      ypfb.gov.bo                       98
         N.A.       N.A.        -       N.A.       N.A.    19,500     364.2      -       -       -       -     7.2         No             P*     nestle.com.br                     99
        490.8      302.3     62.4    3,787.0    1,227.9    40,218         -   17.8     5.8     4.4     9.8       -         Yes            P*     dys.cl                           100
                                                                                                                     P: Privately-owned          S: State-owned       P*: Foreign-owned

                                                                                                                                               2012 - 2013 / AMÉRICAECONOMÍA 19


RANKING 500 GI.indd 19                                                                                                                                                                 17/8/12 16:43:04
LATIN AMERICA´S LARGEST COMPANIES

                                                                                            SALES       SALES VARIATION IN NET PROFITS NET PROFITS VARIATION IN                     E
              RK   RK                                       COUN
                                          COMPANY                        SECTOR            2011 US$    2010 US$    SALES      2011         2010       PROFITS                      20
              11   10                                       -TRY
                                                                                            Millions    Millions 11/10 (%) US$ Millions US$ Millions 11/010 (%)                     M

             101   153   PETROPERÚ                          PER    Oil & Gas                 4,947.0     3,711.1    33.3         152.8       106.5       43.4
             102   100   OI MÓVEL                           BRA    Telecommunications        4,928.7     5,112.2    -3.6         536.2     1,182.9      -54.7
             103   111   AMIL                               BRA    Health Services           4,802.7     4,582.5     4.8          93.4        76.2       22.6
             104    97   GRUPO INDUSTRIAL LALA (1)          MEX    Foods                     4,802.7     5,196.8    -7.6          N.A.        N.A.          -
             105   123   CMPC PAPELES Y CARTONES            CHI    Pulp & Paper              4,796.5     4,219.2    13.7         492.1       637.5      -22.8
             106   132   CARGILL (1)                        ARG    Agribusiness              4,743.0     4,444.4     6.7          N.A.        N.A.          -
             107   107   VOTORANTIM CIMENTOS                BRA    Cement                    4,639.0     4,830.1    -4.0         483.0     1,466.0      -67.1
             108     -   CODELCO DIV. CHUQUICAMATA          CHI    Mining                    4,628.6     5,285.2   -12.4         645.2       491.9       31.2
             109   113   MAN LATIN AMERICA                  BRA    Carmaking                 4,616.0     4,528.8     1.9          N.A.        N.A.          -
             110    99   ENDESA                             CHI    Electricity               4,578.4     5,119.8   -10.6         857.0     1,139.2      -24.8
             111   109   GRUPO TELEVISA                     MEX    Mass Media                4,486.9     4,684.9    -4.2         564.0       659.5      -14.5
             112   156   CONSTRUTORA NORBERTO ODEBRECHT     BRA    Construction              4,476.0     3,450.2    29.7         482.0       635.0      -24.1
             113   120   CGE                                CHI    Electricity               4,475.4     4,295.2     4.2         -27.2       128.3     -121.2
             114   159   REFINERÍA LA PAMPILLA              PER    Oil & Gas                 4,468.6     3,349.0    33.4         107.7        44.0      144.8
             115   142   ALMACENES ÉXITO                    COL    Retail                    4,465.2     3,772.7    18.4         196.6       128.1       53.5
             116     -   KALUZ                              MEX    Conglomerate              4,411.4        N.A.       -         381.4        N.A.          -
             117   151   ORGANIZACIÓN TERPEL                COL    Oil & Gas                 4,384.5     3,606.2    21.6          86.6       110.6      -21.7
             118   140   ARAUCO                             CHI    Pulp & Paper              4,374.5     3,788.4    15.5         620.8       700.7      -11.4
             119   378   JOHNSON CONTROLS DE MÉXICO         MEX    Carmaking                 4,357.5     1,461.5   198.1          N.A.        N.A.          -
             120   147   TELECOM                            ARG    Telecommunications        4,288.2     3,660.6    17.1         560.6       454.1       23.5
             121   108   GERDAU AÇOS LONGOS                 BRA    Steel & Metallurgy        4,245.0     4,721.5   -10.1         190.0       826.0      -77.0
             122   139   RENAULT                            BRA    Carmaking                 4,238.0     3,791.9    11.8         115.0       124.0       -7.3
             123   134   GRUPO COPPEL                       MEX    Retail                    4,206.3     4,033.6     4.3         532.5       463.4       14.9
             124   122   EL PUERTO DE LIVERPOOL             MEX    Retail                    4,204.9     4,231.9    -0.6         469.1       417.4       12.4
             125   133   LOUIS DREYFUS COMMODITIES          BRA    Agribusiness              4,187.0     4,097.8     2.2          75.0       -18.0      516.7
             126   131   REDE ENERGIA                       BRA    Electricity               4,148.9     4,117.6     0.8        -366.8      -221.4      -65.7
             127   126   ALESAT COMBUSTÍVEIS                BRA    Oil & Gas                 4,146.0     4,175.2    -0.7           5.0         9.0      -44.4
             128   129   COPEL                              BRA    Electricity               4,145.5     4,141.8     0.1         617.2       592.9        4.1
             129   141   GRUMA                              MEX    Foods                     4,133.0     3,773.4     9.5         377.9        43.9      760.8
             130   121   GRUPO CHEDRAUI                     MEX    Retail                    4,121.6     4,121.3     0.0         108.8       115.6       -5.9
             131   130   FURNAS                             BRA    Electricity               4,121.0     4,118.4     0.1         138.0       338.0      -59.2
             132   149   MALL PLAZA (1)                     CHI    Retail                    4,022.0     3,653.0    10.1          N.A.        N.A.          -
             133   124   VRG - LINHAS AÉREAS                BRA    Transport & Logistics     4,020.0     4,189.3    -4.0        -276.0       155.0     -278.1
             134   125   GOL                                BRA    Transport & Logistics     4,019.2     4,188.8    -4.0        -400.6       128.6     -411.5
             135   127   CERVECERÍA CUAUHTÉMOC – HEINEKEN   MEX    Beverages & Brewing       3,986.4     4,170.2    -4.4          N.A.        N.A.          -
             136   115   WHIRLPOOL                          BRA    Electronics               3,979.8     4,432.2   -10.2         196.5       372.3      -47.2
             137   135   COLLAHUASI                         CHI    Mining                    3,837.1     3,928.9    -2.3       1,682.4     2,047.9      -17.8
             138   110   PEPSICO DE MÉXICO                  MEX    Beverages & Brewing       3,835.2     4,633.9   -17.2          N.A.        N.A.          -
             139     -   AG TELECOM PARTICIPAÇÕES           BRA    Telecommunications        3,833.0     3,580.0       -        -137.0       128.0          -
             140   596   HP BRASIL                          BRA    Electronics               3,810.0     2,881.0    32.2          N.A.        N.A.          -
             141   167   CANTV                              VEN    Telecommunications        3,792.2     3,217.5    17.9         569.4       560.0        1.7
             142   158   GENERAL ELECTRIC (1)               MEX    Electronics               3,778.7     3,386.1    11.6          74.8       393.7      -81.0
             143   144   SAMARCO MINERAÇÃO                  BRA    Mining                    3,764.0     3,745.3     0.5       1,554.0     1,198.0       29.7
             144   150   CARREFOUR                          ARG    Retail                    3,745.0     3,635.0     3.0          N.A.        N.A.          -
             145   145   GRUPO ELEKTRA                      MEX    Retail                    3,729.6     3,537.7     5.4       2,153.4        37.5    5,642.4
             146   136   LIGHT                              BRA    Electricity               3,702.3     3,906.2    -5.2         165.6       345.2      -52.0
             147   210   GENERAL ELECTRIC                   BRA    Electronics               3,700.0     2,400.0    54.2          N.A.        N.A.          -
             148   164   LOS PELAMBRES                      CHI    Mining                    3,676.6     3,348.3     9.8       1,809.5     1,686.0        7.3
             149   172   PDG REALTY                         BRA    Construction              3,666.4     3,138.8    16.8         375.5       473.9      -20.8
             150   178   ARCOS DORADOS                      ARG    Retail                    3,657.6     3,018.1    21.2         115.8       106.3        8.9


             20 AMÉRICAECONOMÍA / 2012 - 2013


RANKING 500 GI.indd 20                                                                                                                                          17/8/12 16:43:10
Nº 134
                                                            Constantino de Oliveira Junior, CEO of Gol:
                                                     how do you make a profit from a Brazilian airline?


     EBITDA      EBITDA VARIATION     TOTAL     NET EQUITY WORK- EXPORTS                NET    NET   EXPORT. Listed on
                                                                          ROE      ROA                                 OWNER-                                                 RK
    2011 US$    2010 US$ IN EBITDA ASSETS 2011 2011 US$ FORCE 2011 US$                 MARGIN EBITDA  AS %    STOCK                                WEBSITE (www.)
                                                                          (%)      (%)                                  SHIP                                                  11
     Millions    Millions 11/10 (%) US$ Millions Millions   2011 Millions               (%)    (%) OF SALES EXCHANGE

        258.5      203.6    27.0     1,845.2      601.0     2,000     472.1   25.4 8.3      3.1    5.2     9.5         Yes            S      petroperu.com.pe                 101
      1,392.2    2,110.4   -34.0    16,880.3    5,645.0      N.A.         -    9.5 3.2     10.9   28.2       -         No             P*     telemar.com.br                   102
        250.0      221.2    13.0     2,874.7      804.5      N.A.         -   11.6 3.2      1.9    5.2       -         Yes            P      amil.com.br                      103
         N.A.       N.A.       -     2,140.5    1,047.8    35,006         -      -    -       -      -       -         No             P      lala.com.mx                      104
      1,077.6    1,188.2    -9.3    13,293.6    7,839.9    15,463   1,177.3    6.3 3.7     10.3   22.5    24.5         Yes            P      cmpc.cl                          105
         N.A.       N.A.       -        N.A.       N.A.     4,600     4,269      -    -       -      -    90.0         No             P*     cargill.com.ar                   106
      1,397.0    1,508.0    -7.4     9,829.0    2,840.0    11,000         -   17.0 4.9     10.4   30.1       -         No             P      votorantim-cimentos.com          107
         N.A.       N.A.       -     4,055.5       N.A.     6,527         -      - 15.9    13.9      -       -         No             S      codelco.cl                       108
         N.A.       N.A.       -     2,977.0       N.A.     1,141     375.5      -    -       -      -     8.1         No             P      man-latinamerica.com             109
      1,853.3    2,288.0   -19.0    12,583.9    4,906.5     2,241         -   17.5 6.8     18.7   40.5       -         Yes            P*     endesa.cl                        110
      1,692.9    1,748.6    -3.2    11,117.4    3,703.9    26,045       667   15.2 5.1     12.6   37.7    14.9         Yes            P      televisa.com.mx                  111
        441.0      309.0    42.7     4,991.0    2,592.0   124,356     335.7   18.6 9.7     10.8    9.9     7.5         No             P      odebrecht.com                    112
         N.A.       N.A.       -     7,212.3    2,067.1     7,880         -   -1.3 -0.4    -0.6      -       -         Yes            P      cge.cl                           113
        170.0       74.8   127.1     1,440.2      516.8      N.A.     789.6   20.8 7.5      2.4    3.8    17.7         Yes            P*     -                                114
        375.1       N.A.       -     4,951.7    3,653.9      N.A.         -    5.4 4.0      4.4    8.4       -         Yes            P      exito.com                        115
         N.A.       N.A.       -     5,590.4    2,077.2    17,046         -   18.4 6.8      8.6      -       -         No             S      kaluz.com                        116
        161.7      160.2     1.0     1,545.7      833.4     1,396         -   10.4 5.6      2.0    3.7       -         No             P      terpel.com                       117
      1,307.7    1,405.9    -7.0    12,457.7    7,030.2     5,716   1,732.8    8.8 5.0     14.2   29.9    39.6         No             P      arauco.cl                        118
         N.A.       N.A.       -     8,209.8    1,863.3    25,200         -      -    -       -      -       -         No             P      johnsoncontrols.com              119
      1,300.7    1,135.9    14.5     3,431.7    1,802.3    18,300         -   31.1 16.3    13.1   30.3       -         Yes            P*     telecom.com.ar                   120
         N.A.       N.A.       -     6,584.0    4,203.0      N.A.     298.1    4.5 2.9      4.5      -     7.0         No             P      gerdau.com.br                    121
         N.A.       N.A.       -     2,745.0      727.0    10,243   1,105.6   15.8 4.2      2.7      -    26.1         No             P*     renault.com.br                   122
         N.A.       N.A.       -     3,883.6    2,055.4    73,021         -   25.9 13.7    12.7      -       -         Yes            P      coppel.com.mx                    123
        753.6      716.4     5.2     5,235.5    3,102.0    38,612         -   15.1 9.0     11.2   17.9       -         Yes            P      liverpool.com.mx                 124
         N.A.       N.A.       -     3,580.0      464.0     3,600     483.7   16.2 2.1      1.8      -    11.6         Yes            P      ldcom.com.br                     125
        747.6      731.1     2.3     6,896.2      332.5     7,716         - -110.3 -5.3    -8.8   18.0       -         Yes            P      redenergia.com                   126
         N.A.       98.9       -       553.0       71.0      N.A.         -    7.0 0.9      0.1      -       -         No             P      ale.com.br                       127
      1,019.5      945.4     7.8    10,193.9    6,304.9     9,545         -    9.8 6.1     14.9   24.6       -         Yes            S      copel.com                        128
        353.8      292.0    21.2     3,193.6      963.0    21,318         -   39.2 11.8     9.1    8.6       -         Yes            P      gruma.com                        129
        264.0      270.8    -2.5     2,661.5    1,227.8    36,052         -    8.9 4.1      2.6    6.4       -         Yes            P      chedraui.com.mx                  130
        997.0      635.0    57.0    15,863.0    7,092.0     4,860         -    1.9 0.9      3.3   24.2       -         No             S      furnas.com.br                    131
         N.A.       N.A.       -        N.A.       N.A.      N.A.         -      -    -       -      -       -         No             P      mallplaza.cl                     132
         N.A.       N.A.       -     5,181.0    1,105.0    18,800         - -25.0 -5.3     -6.9      -       -         No             P      vooegol.com.br                   133
         80.7      587.8   -86.3     5,680.3    1,176.0    20,525         - -34.1 -7.1    -10.0    2.0       -         Yes            P      voegol.com.br                    134
         N.A.       N.A.       -        N.A.       N.A.    18,384       365      -    -       -      -     9.2         No             P      cuamoc.com                       135
        275.0      534.0   -48.5     2,803.2      914.8      N.A.     620.5   21.5 7.0      4.9    6.9    15.6         Yes            P*     whirlpool.com.br                 136
      2,859.0       N.A.       -     5,070.6    3,992.6     2,015   1,574.0   42.1 33.2    43.8   74.5    41.0         No             P*     collahuasi.cl                    137
         N.A.       N.A.       -        N.A.       N.A.    55,000         -      -    -       -      -       -         No             P*     pepsico.com                      138
         N.A.       N.A.       -    11,072.0    2,821.0      N.A.         -   -4.9 -1.2    -3.6      -       -         No             P      agsa.com.br                      139
         N.A.       N.A.       -        N.A.       N.A.    10,000         -      -    -       -      -       -         No             P*     hp.com.br                        140
         N.A.      797.8       -     4,899.4    1,853.6      N.A.         -   30.7 11.6    15.0      -       -         Yes            P      cantv.com.ve                     141
         N.A.       N.A.       -     8,637.5    1,829.9    11,000         -    4.1 0.9      2.0      -       -         No             P*     ge.com.mx                        142
      2,262.0    1,994.0    13.4     3,839.0      963.0     2,359         - 161.4 40.5     41.3   60.1       -         No             P*     samarco.com.br                   143
         N.A.       N.A.       -        N.A.       N.A.    13,900         -      -    -       -      -       -         No             P*     carrefour.com.ar                 144
        565.7      580.7    -2.6    12,726.8    4,789.0    52,064       559   45.0 16.9    57.7   15.2    15.0         Yes            P      grupoelektra.com.mx              145
        657.4      957.2   -31.3     5,854.4    1,717.3     4,134         -    9.6 2.8      4.5   17.8       -         Yes            P*     light.com.br                     146
         N.A.       N.A.       -        N.A.       N.A.     6,500         -      -    -       -      -       -         No             P*     ge.com.br                        147
      2,334.2       N.A.       -     3,731.8    2,353.1     4,000   3,676.6   76.9 48.5    49.2   63.5   100.0         No             P      lospelambres.cl                  148
        563.3      525.5     7.2     9,197.7    3,422.4      N.A.         -   11.0 4.1     10.2   15.4       -         Yes            P      pdgrealty.com.br                 149
         N.A.      265.1       -     1,875.4      679.6      N.A.         -   17.0 6.2      3.2      -       -         Yes            P      arcosdorados.net                 150
                                                                                                                 P: Privately-owned         S: State-owned        P*: Foreign-owned

                                                                                                                                           2012 - 2013 / AMÉRICAECONOMÍA 21


RANKING 500 GI.indd 21                                                                                                                                                             17/8/12 16:43:18
LATIN AMERICA´S LARGEST COMPANIES

                                                                                                        SALES       SALES VARIATION IN NET PROFITS NET PROFITS VARIATION IN                     E
              RK   RK                                                  COUN
                                           COMPANY                                   SECTOR            2011 US$    2010 US$    SALES      2011         2010       PROFITS                      20
              11   10                                                  -TRY
                                                                                                        Millions    Millions 11/10 (%) US$ Millions US$ Millions 11/010 (%)                     M

             151   155   ITAIPÚ BINACIONAL                             BR/PY   Electricity               3,652.1     3,450.5     5.8         784.2       466.5       68.1
             152     -   REFAP                                         BRA     Oil & Gas                 3,584.0     4,923.0       -        -256.0       139.0          -
             153   166   NET BRASIL                                    BRA     Telecommunications        3,569.6     3,244.3    10.0         198.9       184.3        7.9
             154   191   AVIANCA – TACA                                COL     Transport & Logistics     3,566.6     2,728.4    30.7         102.1        56.4       81.0
             155   169   COMCEL                                        COL     Telecommunications        3,562.1     3,214.6    10.8         927.0       589.5       57.2
             156     -   CODELCO DIV. EL TENIENTE                      CHI     Mining                    3,534.7     3,215.6     9.9         742.2       541.5       37.1
             157     -   PEUGEOT CITROEN                               BRA     Carmaking                 3,520.0     3,295.0       -          79.0       114.0          -
             158   593   ENDESA BRASIL                                 BRA     Electricity               3,508.0        N.A.       -         641.0       578.0       10.9
             159   176   TELEFÓNICA MÓVIL VENEZUELA                    VEN     Telecommunications        3,481.0     3,072.1    13.3          N.A.        N.A.          -
             160   173   PAN AMERICAN ENERGY (1)                       ARG     Oil & Gas                 3,470.0     3,100.0    11.9          N.A.        N.A.          -
             161   154   JABIL CIRCUIT                                 MEX     Electronics               3,457.3     3,516.5    -1.7          N.A.        N.A.          -
             162   212   NEXTEL                                        BRA     Telecommunications        3,441.2     2,591.3    32.8          N.A.        N.A.          -
             163   184   MAGAZINE LUIZA                                BRA     Retail                    3,422.2     2,885.6    18.6           6.2        41.3      -85.0
             164   179   MEXICHEM                                      MEX     Petrochemicals            3,392.0     2,953.3    14.9         194.4       316.8      -38.6
             165   198   MINERA ANTAMINA                               PER     Mining                    3,384.3     2,663.9    27.0          N.A.     1,411.0          -
             166     -   CODELCO DIV. R. TOMIC                         CHI     Mining                    3,375.2     2,204.1    53.1         956.5       496.0       92.8
             167   189   GRUPO CASA SABA                               MEX     Retail                    3,338.8     2,772.9    20.4           6.3        21.9      -71.2
             168   152   PETROBRAS ENERGÍA                             ARG     Oil & Gas                 3,305.1     3,601.5    -8.2         163.0       152.1        7.2
             169   183   CYRELA REALTY                                 BRA     Construction              3,266.2     2,934.9    11.3         265.6       360.3      -26.3
             170   148   MABE                                          MEX     Electronics               3,264.7     3,655.5   -10.7        -125.1       -47.6     -162.6
             171   160   NESTLÉ DE MÉXICO (1)                          MEX     Foods                     3,226.4     3,319.9    -2.8          N.A.        N.A.          -
             172   161   HIPERMERCADOS LIDER                           CHI     Retail                    3,212.6     3,319.5    -3.2          N.A.        N.A.          -
             173   251   EMBOTELLADORAS ARCA                           MEX     Beverages & Brewing       3,211.8     2,191.2    46.6         323.4       213.1       51.8
             174   182   NEMAK                                         MEX     Carmaking                 3,204.8     2,946.7     8.8          76.4        75.1        1.7
             175   170   SOUTHERN PERÚ COPPER CORP.                    PER     Mining                    3,179.6     3,153.5     0.8       1,078.1     1,200.4      -10.2
             176   162   BASF                                          BRA     Chemicals & Pharma.       3,172.0     3,317.2    -4.4         177.0       -47.0      476.6
             177   343   PACIFIC RUBIALES ENERGY                       COL     Oil & Gas                 3,152.4     1,617.4    94.9         516.9       211.8      144.0
             178   233   ANCAP (1)                                     URU     Oil & Gas                 3,151.7     2,327.8    35.4         -96.0        74.6     -228.7
             179   114   COMERCIAL MEXICANA                            MEX     Retail                    3,138.6     3,378.9    -7.1          88.6        78.1       13.4
             180   143   FIBRIA                                        BRA     Pulp & Paper              3,121.0     3,771.1   -17.2        -465.2       359.3     -229.5
             181   117   FLEXTRONICS MANUFACTURING (1)                 MEX     Carmaking                 3,107.9     4,399.7   -29.4         199.5        N.A.          -
             182   205   MOLINOS RÍO DE LA PLATA                       ARG     Agribusiness              3,106.7     2,629.5    18.1          64.2        93.8      -31.6
             183   209   ARCOR                                         ARG     Foods                     3,100.0     2,600.0    19.2          N.A.        N.A.          -
             184   186   EMPRESAS ICA                                  MEX     Construction              3,066.4     2,831.3     8.3         106.1        73.6       44.2
             185   180   VOLKSWAGEN (1)                                ARG     Carmaking                 3,030.0     2,950.0     2.7          N.A.        N.A.          -
             186   168   CPFL - COMPANHIIA PAULISTA DE FORÇA E LUZ     BRA     Electricity               2,982.7     3,216.9    -7.3         327.0       417.6      -21.7
             187   175   NATURA                                        BRA     Chemicals & Pharma.       2,980.8     3,082.9    -3.3         443.0       446.6       -0.8
             188   165   CHESF – CIA. HIDROELÊTRICA DO SÃO FRANCISCO   BRA     Electricity               2,977.0     3,261.1    -8.7         828.0     1,161.0      -28.7
             189   200   COAMO                                         BRA     Foods                     2,960.0     2,658.0    11.4         197.0       153.0       28.8
             190   163   SOUZA CRUZ                                    BRA     Agribusiness              2,958.8     3,312.3   -10.7         854.4       654.9       30.5
             191   197   SIGMA                                         MEX     Foods                     2,945.1     2,679.5     9.9          59.6       120.3      -50.5
             192   211   ELETRONORTE                                   BRA     Electricity               2,934.0     2,594.7    13.1          31.0        82.0      -62.2
             193   171   MAKRO                                         BRA     Retail                    2,933.0     3,153.4    -7.0          -2.0        20.0     -110.0
             194   194   ALTOS HORNOS DE MÉXICO                        MEX     Steel & Metallurgy        2,928.0     2,700.2     8.4         140.0        71.6       95.5
             195   188   INVERSIONES ARGOS                             COL     Cement                    2,921.2     2,773.3     5.3          77.6       199.1      -61.0
             196   272   ACEITERA GENERAL DEHEZA (1)                   ARG     Agribusiness              2,900.0     2,000.0    45.0          N.A.        N.A.          -
             197   204   TELEFÓNICA DEL PERÚ                           PER     Telecommunications        2,885.3     2,641.5     9.2         197.3       267.6      -26.3
             198   177   ENERGIAS DO BRASIL                            BRA     Electricity               2,879.7     3,021.4    -4.7         261.6       349.6      -25.2
             199   213   EXXONMOBIL                                    COL     Oil & Gas                 2,864.4     2,572.3    11.4          48.9        21.5      127.6
             200   229   SIDERAR                                       ARG     Steel & Metallurgy        2,811.3     2,382.5    18.0         310.5       445.8      -30.3


             22 AMÉRICAECONOMÍA / 2012 - 2013


RANKING 500 GI.indd 22                                                                                                                                                      17/8/12 16:43:25
Nº 187
                                                                   Alessandro Carlucci. CEO of Natura:
                                               one of LatinAmerica´s best-known and respected brands.


     EBITDA      EBITDA VARIATION     TOTAL     NET EQUITY WORK- EXPORTS                     NET    NET   EXPORT. Listed on
                                                                          ROE           ROA                                 OWNER-                                                  RK
    2011 US$    2010 US$ IN EBITDA ASSETS 2011 2011 US$ FORCE 2011 US$                      MARGIN EBITDA  AS %    STOCK                                WEBSITE (www.)
                                                                          (%)           (%)                                  SHIP                                                   11
     Millions    Millions 11/10 (%) US$ Millions Millions   2011 Millions                    (%)    (%) OF SALES EXCHANGE

         N.A.       N.A.       -    18,854.9         100.0    3,186         -   784.2    4.2    21.5      -       -         No             S      itaipu.gov.py                     151
         40.0      386.0       -     3,651.0         611.0      923         -   -41.9   -7.0    -7.1    1.1       -         No             P      refap.com.br                      152
      1,035.2      935.8    10.6     4,741.9       2,232.6     N.A.         -     8.9    4.2     5.6   29.0       -         Yes            P      netcombo.com.br                   153
        453.8      344.0    32.0     3,795.3         909.5     N.A.         -    11.2    2.7     2.9   12.7       -         No             P      avianca.com.co                    154
         N.A.       N.A.       -     5,230.5       2,819.3    3,903         -    32.9   17.7    26.0      -       -         No             P*     comcel.com.co                     155
         N.A.       N.A.       -     3,784.2          N.A.    4,975         -       -   19.6    21.0      -       -         No             S      codelco.cl                        156
         N.A.       N.A.       -     2,265.0         745.0    4,980         -    10.6    3.5     2.2      -       -         No             P*     peugeot.com.br                    157
      1,193.0    1,187.0     0.5     6,290.0       3,166.0   16,209         -    20.2   10.2    18.3   34.0       -         No             P*     endesabrasil.com.br               158
         N.A.       N.A.       -        N.A.          N.A.    7,000         -       -      -       -      -       -         No             P*     movistar.com.ve                   159
         N.A.       N.A.       -        N.A.          N.A.   10,900         -       -      -       -      -       -         No             P*     pan-energy.com                    160
         N.A.       N.A.       -        N.A.          N.A.   12,000         -       -      -       -      -       -         No             P*     jabil.com                         161
         N.A.      777.0       -        N.A.          N.A.    5,061         -       -      -       -      -       -         No             P*     nextel.com.br                     162
        160.3      192.0   -16.5     2,600.1         331.0   26,000         -     1.9    0.2     0.2    4.7       -         No             P      magazineluiza.com.br              163
        736.4      657.8    11.9     4,334.6       1,720.2   11,173         -    11.3    4.5     5.7   21.7       -         Yes            P      mexichem.com.mx/                  164
         N.A.       N.A.       -        N.A.          N.A.     N.A.   3,384.0       -      -       -      -   100.0         No             P*     antamina.com                      165
         N.A.       N.A.       -     2,014.6          N.A.    1,010         -       -   47.5    28.3      -       -         No             S      codelco.cl                        166
        135.3       63.0   114.8     2,250.5         510.6   13,251         -     1.2    0.3     0.2    4.1       -         Yes            P      casasaba.com                      167
        466.4      675.8   -31.0     5,131.9       2,400.7    1,250         -     6.8    3.2     4.9   14.1       -         Yes            P*     petrobras.com.ar                  168
        407.2      485.1   -16.1     7,152.6       2,422.8     N.A.         -    11.0    3.7     8.1   12.5       -         Yes            P      brazilrealty.com.br               169
         N.A.       N.A.       -     2,388.8         322.5   19,751     2,418   -38.8   -5.2    -3.8      -    74.1         No             P      mabe.com.mx                       170
         N.A.       N.A.       -        N.A.          N.A.    6,500         -       -      -       -      -       -         No             P*     nestle.com.mx                     171
         N.A.       N.A.       -        N.A.          N.A.     N.A.         -       -      -       -      -       -         No             P      lider.cl                          172
        543.2      408.0    33.1     4,331.6       2,609.0   38,172         -    12.4    7.5    10.1   16.9       -         Yes            P      arcacontal.com                    173
         N.A.       N.A.       -     3,198.3         805.7   18,004     2,925     9.5    2.4     2.4      -    91.3         No             P      alfa.com.mx                       174
      1,670.0    2,034.0   -17.9     2,863.4       2,394.7   12,000   2,870.0    45.0   37.6    33.9   52.5    90.3         Yes            P*     southernperu.com                  175
         N.A.       N.A.       -     2,337.0         912.0    4,000     413.6    19.4    7.6     5.6      -    13.0         No             P*     basf.com.br                       176
      1,815.1      898.3   102.0     5,344.0       2,851.9     N.A.         -    18.1    9.7    16.4   57.6       -         No             P      pacificrubiales.com                177
         N.A.       N.A.       -        N.A.          N.A.     N.A.         -       -      -    -3.0      -       -         No             S      ancap.com.uy                      178
        246.9      219.0    12.7     3,159.8       1,140.2   40,565         -     7.8    2.8     2.8    7.9       -         Yes            P      comerci.com.mx                    179
      1,205.8    1,646.7   -26.8    14,848.9       7,735.8     N.A.   2,183.0    -6.0   -3.1   -14.9   38.6    69.9         Yes            P      fibria.com.br                      180
         N.A.       N.A.       -     1,565.9       1,340.9   12,475         -    14.9   12.7     6.4      -       -         No             P*     flextronics.com                    181
        206.8      218.4    -5.3     1,397.6         317.2    4,500         -    20.2    4.6     2.1    6.7       -         Yes            P      molinos.com.ar                    182
         N.A.       N.A.       -        N.A.          N.A.   25,500     380.0       -      -       -      -    12.3         No             P      arcor.com.ar                      183
        355.9      323.7     9.9     7,090.0       1,205.1   40,003         -     8.8    1.5     3.5   11.6       -         Yes            P      ica.com.mx                        184
         N.A.       N.A.       -        N.A.          N.A.    4,600         -       -      -       -      -       -         No             P*     volkswagen.com.ar                 185
        622.4      713.8   -12.8     3,071.6         478.7     N.A.         -    68.3   10.6    11.0   20.9       -         Yes            P      cpfl.com.br                        186
        759.7      754.3     0.7     2,022.1         666.5    6,700         -    66.5   21.9    14.9   25.5       -         Yes            P      natura.com.br                     187
      1,432.0    1,732.0   -17.3    12,863.0       8,969.0     N.A.         -     9.2    6.4    27.8   48.1       -         No             S      chesf.gov.br                      188
         N.A.       N.A.       -     2,402.0       1,167.0    5,540   1,129.2    16.9    8.2     6.7      -    38.1         No             P      coamo.com.br                      189
      1,256.7    1,257.4    -0.1     2,267.8       1,108.5     N.A.     647.3    77.1   37.7    28.9   42.5    21.9         Yes            P*     souzacruz.com.br                  190
         N.A.       N.A.       -     2,023.3         555.2   29,226       397    10.7    2.9     2.0      -    13.5         Yes            P      gruposigma.com.mx                 191
        702.0      656.0     7.0    11,769.0       5,471.0    3,815         -     0.6    0.3     1.1   23.9       -         No             S      eletronorte.gov.br                192
         N.A.       N.A.       -     1,023.0         266.0    7,144         -    -0.8   -0.2    -0.1      -       -         No             P*     makro.com.br                      193
        499.5      348.2    43.5     4,390.8       1,580.5   21,752         -     8.9    3.2     4.8   17.1       -         Yes            P      ahmsa.com                         194
        822.4      833.5    -1.3    12,820.1       4,829.2     N.A.         -     1.6    0.6     2.7   28.2       -         No             P      argos.com.co                      195
         N.A.       N.A.       -        N.A.          N.A.    2,000     1,885       -      -       -      -    65.0         No             P      agd.com.ar                        196
      1,012.7      905.5    11.8     4,122.5       1,319.6    7,000         -    15.0    4.8     6.8   35.1       -         Yes            P*     telefonica.com.pe                 197
        817.8      912.7   -10.4     7,283.4       2,455.0   10,085         -    10.7    3.6     9.1   28.4       -         Yes            P      energiasdobrasil.com.br           198
         N.A.       N.A.       -       613.6         269.1     N.A.         -    18.2    8.0     1.7      -       -         No             P*     exxon.com                         199
        448.2      425.0     5.5     3,328.0       2,290.8    7,500         -    13.6    9.3    11.0   15.9       -         Yes            P      siderar.com.ar                    200
                                                                                                                      P: Privately-owned          S: State-owned        P*: Foreign-owned

                                                                                                                                                2012 - 2013 / AMÉRICAECONOMÍA 23


RANKING 500 GI.indd 23                                                                                                                                                                   17/8/12 16:43:33
LATIN AMERICA´S LARGEST COMPANIES

                                                                                                 SALES       SALES VARIATION IN NET PROFITS NET PROFITS VARIATION IN                     E
              RK   RK                                            COUN
                                          COMPANY                             SECTOR            2011 US$    2010 US$    SALES      2011         2010       PROFITS                      20
              11   10                                            -TRY
                                                                                                 Millions    Millions 11/10 (%) US$ Millions US$ Millions 11/010 (%)                     M

             201   274   CAP                                     CHI    Steel & Metallurgy        2,787.0     1,993.6    39.8         441.7       590.4      -25.2
             202   201   SHELL CAPSA (1)                         ARG    Oil & Gas                 2,780.0     2,650.0     4.9          N.A.        N.A.          -
             203   195   TRANSPETRO                              BRA    Transport & Logistics     2,775.0     2,698.9     2.8         335.0       292.0       14.7
             204   226   PÃO DE AÇÚCAR                           BRA    Retail                    2,774.0     2,485.0    11.6          N.A.        N.A.          -
             205   203   WEG                                     BRA    Machinery                 2,766.5     2,635.9     5.0         312.9       312.0        0.3
             206   230   CLARO                                   ARG    Telecommunications        2,756.0     2,380.0    15.8          N.A.        N.A.          -
             207   187   CCR RODOVIAS                            BRA    Basic Services            2,737.1     2,795.1    -2.1         479.5       403.1       19.0
             208   199   RECOPE (1)                              C.RI   Oil & Gas                 2,732.0     2,660.8     2.7          N.A.       125.3          -
             209   208   GERDAU AÇOMINAS                         BRA    Steel & Metallurgy        2,690.0     2,610.0     3.1         -43.0       -66.0       34.8
             210   207   SODIMAC                                 CHI    Retail                    2,684.3     2,618.5     2.5         165.3       167.7       -1.4
             211   190   CNH                                     BRA    Carmaking                 2,684.0     2,736.3    -1.9          85.0       196.0      -56.6
             212   196   GRUPO SANBORNS                          MEX    Retail                    2,656.0     2,693.3    -1.4         209.8       259.1      -19.0
             213   202   COELBA                                  BRA    Electricity               2,648.1     2,637.3     0.4         400.1       567.6      -29.5
             214   206   TELEFÓNICA MOVIL ARGENTINA              ARG    Telecommunications        2,640.5     2,622.0     0.7          N.A.        N.A.          -
             215   215   GASPETRO                                BRA    Oil & Gas                 2,620.0     2,561.3     2.3         480.0       728.0      -34.1
             216   234   PEUGEOT - CITROËN (1)                   ARG    Carmaking                 2,589.0     2,320.0    11.6          N.A.        N.A.          -
             217   227   MAGNA INTERNACIONAL                     MEX    Carmaking                 2,588.3     2,404.4     7.7          N.A.        N.A.          -
             218   193   SUZANO PAPEL E CELULOSE                 BRA    Pulp & Paper              2,584.5     2,709.1    -4.6          15.9       461.5      -96.6
             219   239   GRUPO AEROMÉXICO (1)                    MEX    Transport & Logistics     2,567.3     2,273.8    12.9         149.2       189.0      -21.1
             220   219   BAVARIA                                 COL    Beverages & Brewing       2,565.6     2,486.9     3.2         513.4       411.8       24.7
             221   214   GRUPO XIGNUX                            MEX    Conglomerate              2,562.3     2,566.5    -0.2          25.0        46.0      -45.7
             222   232   GENERAL MOTORS (1)                      ARG    Carmaking                 2,560.0     2,360.0     8.5          N.A.        N.A.          -
             223   128   LA FONTE TELECOM                        BRA    Telecommunications        2,555.4     4,144.6   -38.3         472.2       -47.8    1,087.9
             224   238   GRUPO NUTRESA                           COL    Foods                     2,553.2     2,286.0    11.7         128.0       135.4       -5.4
             225   231   MINERA CERRO VERDE                      PER    Mining                    2,520.1     2,369.0     6.4       1,078.4     1,074.4        0.4
             226   269   ANGLO AMERICAN NORTE                    CHI    Mining                    2,515.1     2,009.8    25.1         463.1       546.9      -15.3
             227   261   HERINGER FERTILIZANTES                  BRA    Chemicals & Pharma.       2,507.7     2,113.5    18.7          34.1        37.1       -8.1
             228   223   NACIONAL DE DROGAS (1)                  MEX    Chemicals & Pharma.       2,502.2     2,453.5     2.0          N.A.        N.A.          -
             229   216   DEACERO (1)                             MEX    Steel & Metallurgy        2,492.2     2,558.8    -2.6          N.A.        N.A.          -
             230   257   AEROPUERTOS Y SERVICIOS AUXILIARES      MEX    Servicios Generales       2,492.0     2,160.2    15.4          67.4       -59.7      212.9
             231   236   FORD (1)                                ARG    Carmaking                 2,476.0     2,300.0     7.7          N.A.        N.A.          -
             232   192   GRUPO OAS                               BRA    Construction              2,473.0     2,409.0     2.7          28.0       -60.0      146.7
             233   248   INTEL                                   C.RI   Electronics               2,450.0     2,200.0    11.4          N.A.        N.A.          -
             234   240   ARCELOR MITTAL                          MEX    Steel & Metallurgy        2,426.9     2,251.7     7.8          N.A.        N.A.          -
             235     -   RAIA DROGASIL                           BRA    Retail                    2,425.0     2,027.2    19.6          56.3        48.4       16.3
             236   331   CONSORCIO MINERO CORMIN                 PER    Mining                    2,418.7     1,691.0    43.0          N.A.        N.A.          -
             237   259   ANGLO AMERICAN SUR                      CHI    Mining                    2,361.6     2,122.5    11.3         797.9     1,820.5      -56.2
             238   181   CONSTRUÇÕES E COMÉRCIO CAMARGO CORRÊA   BRA    Construction              2,361.0     2,947.9   -19.9          13.0         9.0       44.4
             239   270   AUTORIDAD DEL CANAL DE PANAMÁ           PAN    Transport & Logistics     2,360.7     2,008.4    17.5       1,251.6       981.7       27.5
             240   235   ENTEL                                   CHI    Telecommunications        2,360.3     2,313.5     2.0         346.7       369.3       -6.1
             241   282   BUNGE FERTILIZANTES                     BRA    Chemicals & Pharma.       2,332.0     1,940.9    20.1         -71.0       -61.0      -16.4
             242   250   INDUSTRIAS CH                           MEX    Steel & Metallurgy        2,323.7     2,195.4     5.8         218.0        42.5      412.9
             243   296   CONTINENTAL TIRE DE MÉXICO              MEX    Carmaking                 2,323.0     1,854.3    25.3          N.A.        N.A.          -
             244   217   PROCTER & GAMBLE DE MÉXICO (1)          MEX    Chemicals & Pharma.       2,319.0     2,542.6    -8.8          N.A.        N.A.          -
             245   253   AVON                                    BRA    Chemicals & Pharma.       2,316.3     2,182.8     6.1          N.A.        N.A.          -
             246   592   CONSTRUTORA ANDRADE GURIERREZ           BRA    Construction              2,313.0     2,269.0     1.9         211.0       194.0        8.8
             247   221   TRACTEBEL                               BRA    Electricity               2,306.7     2,460.9    -6.3         771.7       727.2        6.1
             248   247   BAYER                                   BRA    Chemicals & Pharma.       2,289.0     2,204.0     3.9          52.0       -35.0      248.6
             249   336   ASSAI                                   BRA    Retail                    2,286.0     2,079.0    10.0          N.A.        N.A.          -
             250   252   GRUPO ICE (1)                           C.RI   Basic Services            2,268.2     2,191.1     3.5         -45.0       339.3     -113.3


             24 AMÉRICAECONOMÍA / 2012 - 2013


RANKING 500 GI.indd 24                                                                                                                                               17/8/12 16:43:40
Nº 224
                                                  Carlos Enrique Piedrahita, CEO of Grupo Nutresa:
                                          from Colombian chocolatemaker to regional food supplier.


     EBITDA      EBITDA VARIATION     TOTAL     NET EQUITY WORK- EXPORTS                  NET    NET   EXPORT. Listed on
                                                                          ROE        ROA                                 OWNER-                                                 RK
    2011 US$    2010 US$ IN EBITDA ASSETS 2011 2011 US$ FORCE 2011 US$                   MARGIN EBITDA  AS %    STOCK                               WEBSITE (www.)
                                                                          (%)        (%)                                  SHIP                                                  11
     Millions    Millions 11/10 (%) US$ Millions Millions   2011 Millions                 (%)    (%) OF SALES EXCHANGE

         N.A.       N.A.       -     4,771.0    1,724.1    5,211         -    25.6    9.3   15.8      -       -         Yes            P      cap.cl                            201
         N.A.       N.A.       -        N.A.       N.A.    4,100         -       -      -      -      -       -         No             P*     shell.com.ar                      202
         N.A.       N.A.       -     2,731.0    1,728.0    5,230         -    19.4   12.3   12.1      -       -         No             S      transpetro.com.br                 203
         N.A.       N.A.       -        N.A.       N.A.   15,000         -       -      -      -      -       -         No             P      paodeacucar.com.br                204
        453.8      472.1    -3.9     4,854.4    2,025.9     N.A.     783.2    15.4    6.4   11.3   16.4    28.3         Yes            P      weg.net                           205
         N.A.       N.A.       -        N.A.       N.A.    2,100         -       -      -      -      -       -         No             P      claro.com.ar                      206
      1,445.7    1,212.8    19.2     6,851.1    1,708.8     N.A.         -    28.1    7.0   17.5   52.8       -         Yes            P      grupoccr.com.br                   207
         N.A.       N.A.       -        N.A.       N.A.     N.A.         -       -      -      -      -       -         No             S      recope.go.cr                      208
         N.A.       N.A.       -     4,282.0    2,308.0     N.A.   1,449.0    -1.9   -1.0   -1.6      -    53.9         Yes            P      gerdau.com.br/gerdauacominas      209
         N.A.       N.A.       -     1,156.5      479.6   18,376       2.8    34.5   14.3    6.2      -     0.1         No             P      sodimac.cl                        210
         N.A.       N.A.       -     2,005.0      729.0    5,000     435.8    11.7    4.2    3.2      -    16.2         No             P      cnhbrasil.com.br                  211
         N.A.       N.A.       -     2,125.7    1,253.8     N.A.         -    16.7    9.9    7.9      -       -         No             P      sanborns.com.mx                   212
        682.5      808.8   -15.6     3,272.1    1,225.0    2,533         -    32.7   12.2   15.1   25.8       -         Yes            P*     coelba.com.br                     213
         N.A.       N.A.       -        N.A.       N.A.    4,200         -       -      -      -      -       -         No             P*     movistar.com.ar                   214
         N.A.    1,064.0       -    17,572.0    5,459.0     N.A.         -     8.8    2.7   18.3      -       -         No             P      gaspetro.com.br                   215
         N.A.       N.A.       -        N.A.       N.A.    5,000         -       -      -      -      -       -         No             P*     peugeot.com.ar                    216
         N.A.       N.A.       -        N.A.       N.A.   18,000         -       -      -      -      -       -         No             P*     magna.com                         217
        696.3    1,006.7   -30.8    11,545.5    5,157.0   17,000   1,392.1     0.3    0.1    0.6   26.9    53.9         Yes            P      suzano.com.br                     218
        320.0      322.7    -0.8     1,557.7      366.4   12,865         -    40.7    9.6    5.8   12.5       -         No             P      aeromexico.com                    219
      1,021.5    1,000.2     2.1     4,644.8    2,682.5     N.A.         -    19.1   11.1   20.0   39.8       -         No             P*     bavaria.com.co                    220
         N.A.       N.A.       -     1,791.2      663.0   19,328     1,350     3.8    1.4    1.0      -    52.7         Yes            P      xignux.com                        221
         N.A.       N.A.       -        N.A.       N.A.     N.A.         -       -      -      -      -       -         No             P*     gm.com.ar                         222
      1,301.1    1,383.7    -6.0     7,422.6      467.5     N.A.         -   101.0    6.4   18.5   50.9       -         Yes            P*     lafonte.com.br                    223
        286.8      275.9     4.0     4,004.0    3,268.7   26,284        43     3.9    3.2    5.0   11.2     1.7         No             P      gruponutresa.com                  224
      1,643.3    1,643.5    -0.0     3,196.6    2,677.6     N.A.   2,182.0    40.3   33.7   42.8   65.2    86.6         Yes            P      fcx.com                           225
        596.3      630.0    -5.3       879.3      349.5      634   1,897.5   132.5   52.7   18.4   23.7    75.4         No             P*     angloamerican.com                 226
        189.0      127.5    48.2     1,383.0      252.5    3,425         -    13.5    2.5    1.4    7.5       -         Yes            P      heringer.com.br                   227
         N.A.       N.A.       -        N.A.       N.A.    5,500         -       -      -      -      -       -         No             P      nadro.com                         228
         N.A.       N.A.       -        N.A.       N.A.    7,000         -       -      -      -      -       -         No             P      deacero.com                       229
         N.A.       N.A.       -     1,002.3      514.4    2,500         -    13.1    6.7    2.7      -       -         No             S      asa.gob.mx                        230
         N.A.       N.A.       -        N.A.       N.A.    3,700         -       -      -      -      -       -         No             P*     ford.com.ar                       231
        204.0       87.0   134.5     3,790.0      368.0   52,869         -     7.6    0.7    1.1    8.2       -         Yes            P      oas.com                           232
         N.A.       N.A.       -        N.A.       N.A.     N.A.         -       -      -      -      -       -         No             P*     intel.com                         233
         N.A.       N.A.       -        N.A.       N.A.    5,000         -       -      -      -      -       -         No             P*     arcelormittal.com                 234
        113.9      117.9    -3.4     1,689.8    1,174.0   16,278         -     4.8    3.3    2.3    4.7       -         No             P      drogaraia.com.br                  235
         N.A.       N.A.       -        N.A.       N.A.     N.A.   2,419.0       -      -      -      -   100.0         No             P      trafigura.com                      236
      1,055.1    1,117.3    -5.6     6,396.9    3,926.9    1,992   1,624.1    20.3   12.5   33.8   44.7    68.8         No             P*     angloamerican.co.uk               237
         N.A.       N.A.       -     1,076.0    1,366.0   23,642         -     1.0    1.2    0.6      -       -         No             P      camargocorrea.com.br              238
         N.A.    1,407.1       -     7,805.0    6,275.0   10,000         -    19.9   16.0   53.0      -       -         No             S      pancanal.com                      239
        974.2      943.1     3.3     2,987.8    1,482.5    7,009      61.2    23.4   11.6   14.7   41.3     2.6         Yes            P      entel.cl                          240
         N.A.       N.A.       -     2,054.0      744.0    7,500         -    -9.5   -3.5   -3.0      -       -         No             P*     bunge.com.br                      241
        294.7      198.1    48.8     2,674.3    1,740.9    5,348         -    12.5    8.2    9.4   12.7       -         Yes            P      industriasch.com.mx               242
         N.A.       N.A.       -        N.A.       N.A.   11,000         -       -      -      -      -       -         No             P      continentaltire.com.mx            243
         N.A.       N.A.       -        N.A.       N.A.    6,523         -       -      -      -      -       -         No             P*     pg.com.mx                         244
         N.A.       N.A.       -        N.A.       N.A.    4,500         -       -      -      -      -       -         No             P*     avon.com.br                       245
         N.A.       N.A.       -     2,902.0    1,336.0   10,022         -    15.8    7.3    9.1      -       -         No             P      andradegutierrez.com.br           246
      1,551.2    1,567.3    -1.0     6,595.2    2,904.4     N.A.         -    26.6   11.7   33.5   67.2       -         Yes            P      portal.tractebelenergia.com.br    247
         N.A.       N.A.       -       575.0      869.0    4,000         -     6.0    9.0    2.3      -       -         No             P*     bayer.com.br                      248
         N.A.       N.A.       -        N.A.       N.A.   10,000         -       -      -      -      -       -         No             P      assaiatacadista.com.br            249
         N.A.       N.A.       -     9,853.1       N.A.   18,500         -       -   -0.5   -2.0      -       -         No             S      grupoice.com                      250
                                                                                                                  P: Privately-owned          S: State-owned        P*: Foreign-owned

                                                                                                                                            2012 - 2013 / AMÉRICAECONOMÍA 25


RANKING 500 GI.indd 25                                                                                                                                                               17/8/12 16:43:47
LATIN AMERICA´S LARGEST COMPANIES

                                                                                                  SALES       SALES VARIATION IN NET PROFITS NET PROFITS VARIATION IN                     E
              RK   RK                                             COUN
                                          COMPANY                              SECTOR            2011 US$    2010 US$    SALES      2011         2010       PROFITS                      20
              11   10                                             -TRY
                                                                                                  Millions    Millions 11/10 (%) US$ Millions US$ Millions 11/010 (%)                     M

             251   286   GRUPO CLARÍN                             ARG    Mass Media                2,257.5     1,903.2    18.6         120.9       133.1       -9.2
             252   224   B2W - CIA. GLOBAL DO VAREJO              BRA    Retail                    2,256.2     2,444.8    -7.7         -47.5        20.2     -335.1
             253   330   XSTRATA COPPER CHILE                     CHI    Mining                    2,248.5     1,700.8    32.2          N.A.        N.A.          -
             254   470   COSTCO MÉXICO (1)                        MEX    Retail                    2,248.0     1,131.3    98.7          N.A.        N.A.          -
             255   228   CIELO                                    BRA    Software & Data           2,243.7     2,396.2    -6.4         965.1     1,097.9      -12.1
             256   218   GRUPO BOSCH                              BRA    Carmaking                 2,241.0     2,542.4   -11.9          N.A.        N.A.          -
             257   225   CELESC                                   BRA    Electricity               2,234.5     2,422.7    -7.8         172.7       164.2        5.2
             258   185   BRASKEM QPAR- EX QUATTOR PARTICIPAÇOES   BRA    Petrochemicals            2,224.0     2,832.2   -21.5          26.0      -337.0      107.7
             259   245   SPAL                                     BRA    Beverages & Brewing       2,222.0     2,223.2    -0.1         213.0       187.0       13.9
             260   243   RANDON PARTICIPAÇÕES                     BRA    Carmaking                 2,215.8     2,232.0    -0.7         143.5       149.7       -4.1
             261   307   ISA                                      COL    Electricity               2,205.5     1,801.4    22.4         170.0       176.3       -3.6
             262   394   FALABELLA PERÚ                           PER    Retail                    2,201.3     1,665.6    32.2         136.9       121.2       12.9
             263   512   TAG                                      BRA    Transport & Logistics     2,189.0     1,012.0   116.3         209.0       426.0      -50.9
             264   222   COMGAS                                   BRA    Oil & Gas                 2,187.2     2,457.9   -11.0         125.9       348.1      -63.8
             265   284   PARANAPANEMA                             BRA    Mining                    2,184.9     1,915.7    14.1         -25.4        28.5     -189.1
             266   241   ELECTROLUX DO BRASIL                     BRA    Electronics               2,156.0     2,237.8    -3.7          74.0       125.0      -40.8
             267   313   SYNGENTA                                 BRA    Agribusiness              2,152.0     1,778.0    21.0          N.A.        N.A.          -
             268   314   AGROSUPER (1)                            CHI    Agribusiness              2,149.5     2,007.3     7.1          N.A.        N.A.          -
             269   299   SQM                                      CHI    Mining                    2,145.3     1,830.4    17.2         545.8       382.1       42.8
             270   304   MRV                                      BRA    Construction              2,140.5     1,813.1    18.1         405.2       380.8        6.4
             271   308   AES GENER                                CHI    Electricity               2,130.3     1,802.0    18.2         326.1       169.8       92.0
             272   298   SIGDO KOPPERS                            CHI    Construction              2,127.8     1,832.4    16.1         285.6       112.9      153.0
             273   280   SIEMENS BRASIL                           BRA    Electronics               2,124.0     1,822.0    16.6         110.0        51.0      115.7
             274   267   MINERVA                                  BRA    Agribusiness              2,120.1     2,045.5     3.6          24.2        12.5       93.6
             275   295   MINERA YANACOCHA                         PER    Mining                    2,100.0     1,778.3    18.1         642.4       591.2        8.7
             276   275   GRUPO SIMEC                              MEX    Steel & Metallurgy        2,098.6     1,990.1     5.5         205.2        73.2      180.3
             277   249   KLABIN                                   BRA    Pulp & Paper              2,073.3     2,198.6    -5.7          97.4       336.0      -71.0
             278   255   PERNAMBUCANAS                            BRA    Retail                    2,057.0     2,164.9    -5.0          82.0        86.0       -4.7
             279   237   CARBONES DEL CERREJÓN                    COL    Mining                    2,045.4     2,292.6   -10.8         508.4       524.2       -3.0
             280   263   RIPLEY CORP.                             CHI    Retail                    2,037.1     2,082.8    -2.2         106.0       106.8       -0.7
             281   273   TELEFÓNICA COLOMBIA                      COL    Telecommunications        2,034.3     1,996.9     1.9        -354.5      -408.3       13.2
             282   620   QUIÑENCO                                 CHI    Conglomerate              2,023.9       650.4   211.2         168.7       622.6      -72.9
             283   316   NAMISA                                   BRA    Mining                    2,008.0     1,763.0    13.9       1,105.0     1,042.0        6.0
             284   256   NEXTEL DE MÉXICO                         MEX    Telecommunications        2,006.3     2,161.8    -7.2          N.A.        N.A.          -
             285   264   CARREFOUR                                COL    Retail                    1,999.1     2,076.6    -3.7          22.9        43.8      -47.8
             286   271   INDUSTRIAS BACHOCO                       MEX    Agribusiness              1,988.5     2,001.3    -0.6          11.3       160.6      -93.0
             287   285   DRUMMOND                                 COL    Mining                    1,987.9     1,905.6     4.3         184.2       101.1       82.3
             288   277   BROOKFIELD                               BRA    Construction              1,987.0     1,971.0     0.8         174.2       218.3      -20.2
             289   258   CHILECTRA                                CHI    Electricity               1,985.5     2,141.5    -7.3         212.5       322.3      -34.1
             290   266   CONSTRUTORA OAS                          BRA    Construction              1,981.0     2,068.8    -4.2          81.0        26.0      211.5
             291   338   SAMSUNG ELECTRONICS                      MEX    Electronics               1,980.4     1,657.1    19.5           7.2        N.A.          -
             292   323   ENAMI                                    CHI    Mining                    1,966.9     1,721.1    14.3         -70.7        15.1     -568.2
             293   381   FRESNILLO PLC                            MEX    Mining                    1,955.7     1,442.6    35.6         926.4       767.0       20.8
             294   433   MINERA SPENCE                            CHI    Mining                    1,954.2     1,515.8    28.9         694.4       547.5       26.8
             295   254   PANPHARMA                                BRA    Retail                    1,927.0     2,175.7   -11.4          46.0        60.0      -23.3
             296   220   MOVISTAR                                 MEX    Telecommunications        1,926.4     2,486.2   -22.5          N.A.        N.A.          -
             297   260   KIMBERLY CLARK DE MÉXICO                 MEX    Pulp & Paper              1,916.6     2,121.2    -9.6         261.0       341.9      -23.7
             298   300   GRUPO KUO                                MEX    Conglomerate              1,916.3     1,824.1     5.1           9.3        41.0      -77.3
             299   320   SUPERMERCADOS JUMBO                      CHI    Retail                    1,916.0     1,743.3     9.9          N.A.        N.A.          -
             300   294   TOYOTA (1)                               ARG    Carmaking                 1,910.0     1,870.0     2.1          N.A.        N.A.          -


             26 AMÉRICAECONOMÍA / 2012 - 2013


RANKING 500 GI.indd 26                                                                                                                                                17/8/12 16:43:53
Nº 251
                                                           Héctor Magnetto, CEO de Grupo Clarín:
                                     the media group in the sights of the Argentinean government.


     EBITDA      EBITDA VARIATION     TOTAL     NET EQUITY WORK- EXPORTS                  NET    NET   EXPORT. Listed on
                                                                          ROE        ROA                                 OWNER-                                                  RK
    2011 US$    2010 US$ IN EBITDA ASSETS 2011 2011 US$ FORCE 2011 US$                   MARGIN EBITDA  AS %    STOCK                                WEBSITE (www.)
                                                                          (%)        (%)                                  SHIP                                                   11
     Millions    Millions 11/10 (%) US$ Millions Millions   2011 Millions                 (%)    (%) OF SALES EXCHANGE

        601.5      586.5     2.6     2,473.5      864.6   10,000         -    14.0    4.9     5.4   26.6       -         No             P      grupoclarin.com.ar                251
        164.9      280.0   -41.1     2,180.4      607.1     N.A.         -    -7.8   -2.2    -2.1    7.3       -         Yes            P      b2winc.com                        252
         N.A.       N.A.       -        N.A.       N.A.     N.A.   2,248.5       -      -       -      -   100.0         No             P*     -                                 253
         N.A.       N.A.       -        N.A.       N.A.    9,550         -       -      -       -      -       -         No             P      costco.com.mx                     254
      1,273.3    1,538.8   -17.3     2,708.8      751.5     N.A.         -   128.4   35.6    43.0   56.8       -         Yes            P      cielo.com.br                      255
         N.A.       N.A.       -        N.A.       N.A.    9,962     563.7       -      -       -      -    25.2         No             P*     bosch.com.br                      256
        316.9      257.9    22.9     2,860.2    1,159.3     N.A.         -    14.9    6.0     7.7   14.2       -         Yes            S      celesc.com.br                     257
         N.A.       N.A.       -     2,511.0    1,451.0     N.A.         -     1.8    1.0     1.2      -       -         No             P      quattor.com.br                    258
         N.A.       N.A.       -     1,423.0    1,020.0     N.A.         -    20.9   15.0     9.6      -       -         No             P      spalbrasil.com                    259
        291.7      319.5    -8.7     2,141.2      722.0     N.A.         -    19.9    6.7     6.5   13.2       -         Yes            P      randon.com.br                     260
      1,528.4    1,295.3    18.0    13,458.8    3,243.5    3,242         -     5.2    1.3     7.7   69.3       -         No             S      -                                 261
        279.8      253.4    10.4     2,014.2      692.3   14,500         -    19.8    6.8     6.2   12.7       -         Yes            P*     falabella.com.pe                  262
      1,690.0      574.0   194.4    14,788.0    3,590.0     N.A.         -     5.8    1.4     9.5   77.2       -         Yes            P      tag.com.br                        263
        382.6      709.4   -46.1     2,296.4      664.5    4,721         -    18.9    5.5     5.8   17.5       -         Yes            P*     comgas.com.br                     264
         21.6       63.4   -65.9     2,013.2      885.9    3,745         -    -2.9   -1.3    -1.2    1.0       -         Yes            P      paranapanema.com.br               265
         N.A.       N.A.       -     1,204.0      416.0    7,690         -    17.8    6.1     3.4      -       -         No             P*     electrolux.com.br                 266
         N.A.       N.A.       -        N.A.       N.A.    1,354     189.1       -      -       -      -     8.8         No             P      syngenta.com                      267
         N.A.       N.A.       -        N.A.       N.A.   15,915         -       -      -       -      -       -         No             P      agrosuper.cl                      268
        949.4      654.5    45.1     3,871.6    1,812.8    4,902     568.3    30.1   14.1    25.4   44.3    26.5         Yes            P      sqm.cl                            269
        486.1      410.2    18.5     4,883.6    1,824.8     N.A.         -    22.2    8.3    18.9   22.7       -         Yes            P      mrv.com.br                        270
        711.7      383.3    85.7     5,829.3    2,528.7    1,176         -    12.9    5.6    15.3   33.4       -         Yes            P*     gener.cl                          271
        515.6      307.9    67.5     3,121.4      984.6   16,725       2.8    29.0    9.1    13.4   24.2     0.1         Yes            P      sigdokoppers.cl                   272
         N.A.       N.A.       -     1,799.0      536.0   10,170         -    20.5    6.1     5.2      -       -         No             P*     siemens.com.br                    273
         N.A.       N.A.       -     1,865.4      383.7     N.A.   1,043.1     6.3    1.3     1.1      -    49.2         Yes            P      minerva.ind.br                    274
         N.A.    1,113.4       -     3,787.2    2,943.0     N.A.   2,100.0    21.8   17.0    30.6      -   100.0         Yes            P*     yanacocha.com.pe                  275
        249.4      161.7    54.2     2,241.9    1,584.0    4,686         -    13.0    9.2     9.8   11.9       -         Yes            P      gsimec.com.mx                     276
        716.7      829.5   -13.6     6,792.6    2,643.3   14,430     450.4     3.7    1.4     4.7   34.6    21.7         Yes            P*     klabin.com.br                     277
         N.A.       N.A.       -     1,865.0      334.0   16,170         -    24.6    4.4     4.0      -       -         No             P      pernambucanas.com.br              278
        958.9      950.0     0.9     1,629.5    1,037.9    7,034     1,880    49.0   31.2    24.9   46.9    91.9         No             P      cerrejoncoal.com                  279
         N.A.       N.A.       -     3,163.1    1,407.3   13,929         -     7.5    3.4     5.2      -       -         Yes            P      ripley.cl                         280
        617.2      521.8    18.3     3,916.5    1,035.7     N.A.         -   -34.2   -9.1   -17.4   30.3       -         No             P*     telefonica.co                     281
         73.2       26.8   173.1    46,505.5    2,991.5   16,985         -     5.6    0.4     8.3    3.6       -         Yes            P      quinenco.cl                       282
         N.A.       N.A.       -     7,297.0    6,461.0      500         -    17.1   15.1    55.0      -       -         Yes            P      -                                 283
         N.A.       N.A.       -        N.A.       N.A.    7,065         -       -      -       -      -       -         No             P*     nextel.com.mx                     284
        130.0      141.6    -8.2     2,020.5    1,184.4     N.A.         -     1.9    1.1     1.1    6.5       -         No             P*     carrefour.com.co                  285
         47.8      247.8   -80.7     1,661.2    1,162.1   25,326         -     1.0    0.7     0.6    2.4       -         Yes            P      bachoco.com.mx                    286
        535.8      372.3    43.9     2,588.7    2,215.4     N.A.     1,756     8.3    7.1     9.3   27.0    88.4         No             P*     drummondco.com                    287
        347.9      357.7    -2.7     4,823.9    1,608.8    6,001         -    10.8    3.6     8.8   17.5       -         Yes            P      brascanresidential.com.br         288
        278.5      291.2    -4.4     2,512.5    2,034.6      712         -    10.4    8.5    10.7   14.0       -         Yes            P*     chilectra.cl                      289
         58.0       48.0    20.8     2,216.0      654.0   42,589         -    12.4    3.7     4.1    2.9       -         Yes            P      oas.com                           290
         N.A.       N.A.       -       941.2      147.0      568         -     4.9    0.8     0.4      -       -         No             P*     samsung.com.mx                    291
         N.A.       N.A.       -     1,198.3      642.1    1,349   1,510.7   -11.0   -5.9    -3.6      -    76.8         No             S      enami.cl                          292
         N.A.       N.A.       -     2,857.8    2,148.2    3,051         -    43.1   32.4    47.4      -       -         No             P      penoles.com.mx                    293
         N.A.       N.A.       -     3,494.4    3,063.4     N.A.         -    22.7   19.9    35.5      -       -         No             P*     spence.cl                         294
         N.A.       N.A.       -       863.0      487.0     N.A.         -     9.4    5.3     2.4      -       -         No             P*     panpharma.com                     295
         N.A.       N.A.       -     6,258.9      705.9    3,102         -       -      -       -      -       -         No             P*     movistar.com.mx                   296
        511.0      609.5   -16.2     1,885.6      541.1    7,406         -    48.2   13.8    13.6   26.7       -         Yes            P*     kimberly-clark.com.mx             297
        151.8      147.2     3.1     1,629.5      416.5   16,931       924     2.2    0.6     0.5    7.9    48.2         Yes            P      kuo.com.mx                        298
         N.A.       N.A.       -        N.A.       N.A.     N.A.         -       -      -       -      -       -         No             P      jumbo.cl                          299
         N.A.       N.A.       -        N.A.       N.A.    3,000         -       -      -       -      -       -         No             P*     toyota.com.ar                     300
                                                                                                                   P: Privately-owned          S: State-owned        P*: Foreign-owned

                                                                                                                                             2012 - 2013 / AMÉRICAECONOMÍA 27


RANKING 500 GI.indd 27                                                                                                                                                                17/8/12 16:44:02
LATIN AMERICA´S LARGEST COMPANIES

                                                                                           SALES       SALES VARIATION IN NET PROFITS NET PROFITS VARIATION IN                     E
              RK   RK                                      COUN
                                           COMPANY                      SECTOR            2011 US$    2010 US$    SALES      2011         2010       PROFITS                      20
              11   10                                      -TRY
                                                                                           Millions    Millions 11/10 (%) US$ Millions US$ Millions 11/010 (%)                     M

             301   268   ELEKTRO                           BRA    Electricity               1,900.0     2,021.9    -6.0        262.5        270.3       -2.9
             302   603   MC DONALD`S                       BRA    Retail                    1,900.0     1,600.0    18.8         N.A.         N.A.          -
             303   287   EMBOTELLADORA ANDINA              CHI    Beverages & Brewing       1,884.8     1,897.5    -0.7        186.1        221.2      -15.9
             304   318   INFRAERO                          BRA    Transport & Logistics     1,883.0     1,745.7     7.9         78.0         16.0      387.5
             305   297   SHELL CHILE (1)                   CHI    Oil & Gas                 1,882.8     1,836.8     2.5         N.A.         N.A.          -
             306   333   AURORA ALIMENTOS                  BRA    Foods                     1,875.0     1,686.9    11.2         74.0         92.0      -19.6
             307   306   TELEFÓNICA MOVIL CHILE            CHI    Telecommunications        1,873.8     1,862.6     0.6        312.2        421.0      -25.8
             308   309   ENTEL PCS                         CHI    Telecommunications        1,871.6     1,806.7     3.6        268.8        262.0        2.6
             309   352   CHEVRON PETROLEUM                 COL    Oil & Gas                 1,862.5     1,568.4    18.8        121.5         88.3       37.6
             310   310   CCU                               CHI    Beverages & Brewing       1,859.3     1,789.7     3.9        235.4        236.4       -0.4
             311   358   CEMENTOS ARGOS                    COL    Cement                    1,852.1       692.6   167.4        186.8        145.2       28.6
             312   322   SUPERMERCADOS UNIMARC             CHI    Retail                    1,834.5     1,729.0     6.1         N.A.         N.A.          -
             313   388   COPA AIRLINES                     PAN    Transport & Logistics     1,830.9     1,414.8    29.4        310.4        241.0       28.8
             314     -   CODELCO DIV. ANDINA               CHI    Mining                    1,826.5     1,362.0    34.1        373.6        225.3       65.8
             315   361   GENERAL MOTORS COLMOTORES         COL    Carmaking                 1,822.4     1,529.2    19.2         25.4         77.7      -67.3
             316   340   SUPERMERCADOS SANTA ISABEL        CHI    Retail                    1,814.4     1,651.9     9.8         N.A.         N.A.          -
             317   302   TIENDAS ELEKTRA                   MEX    Retail                    1,812.1     1,817.1    -0.3         N.A.         N.A.          -
             318   601   MOSAIC                            BRA    Chemicals & Pharma.       1,810.0     1,092.3    65.7         N.A.         N.A.          -
             319   312   MARCOPOLO                         BRA    Carmaking                 1,796.0     1,779.2     0.9        182.9        178.0        2.8
             320   354   HOLDING ALIMENTARIO DEL PERÚ      PER    Foods                     1,790.8     1,563.6    14.5         76.3         69.9        9.2
             321   356   SOTREQ                            BRA    Carmaking                 1,790.0     1,559.4    14.8        107.0         73.0       46.6
             322   380   GVT HOLDING                       BRA    Telecommunications        1,788.0     1,448.5    23.4        144.0        194.0      -25.8
             323   383   GASCO                             CHI    Oil & Gas                 1,785.3     1,434.7    24.4         63.9        108.2      -40.9
             324   335   DUPONT                            BRA    Chemicals & Pharma.       1,783.0     1,667.1     7.0        196.0        260.0      -24.6
             325   265   HONDA DE MÉXICO                   MEX    Carmaking                 1,778.1     2,072.9   -14.2         N.A.         N.A.          -
             326   288   HYPERMARCAS                       BRA    Chemicals & Pharma.       1,772.4     1,896.4    -6.5        -29.1        157.2     -118.5
             327   422   MINERA DEL PACÍFICO               CHI    Mining                    1,770.3     1,270.8    39.3        700.1        902.3      -22.4
             328   293   PROFARMA                          BRA    Retail                    1,768.3     1,880.2    -6.0         15.4         20.6      -25.2
             329   431   COTIA                             BRA    Retail                    1,766.0     1,245.6    41.8         46.0         20.0      130.0
             330   289   AMPLA                             BRA    Electricity               1,765.8     1,893.4    -6.7        112.1        129.7      -13.6
             331     -   CBMM                              BRA    Mining                    1,765.0     1,548.0    14.0        657.0        610.0        7.7
             332   615   WHITE MARTINS GASES INDUSTRIAIS   BRA    Petrochemicals            1,757.0        N.A.       -        269.0        241.0       11.6
             333   279   TOYOTA MOTOR SALES DE MÉXICO      MEX    Carmaking                 1,742.2     1,959.6   -11.1         N.A.         N.A.          -
             334   490   HOME DEPOT (1)                    MEX    Retail                    1,739.2     1,084.2    60.4         N.A.         N.A.          -
             335   364   SALFACORP                         CHI    Construction              1,728.7     1,512.4    14.3         30.6         47.2      -35.2
             336   345   TELEFÓNICA DE ARGENTINA           ARG    Telecommunications        1,727.6     1,606.7     7.5        153.1        101.7       50.5
             337   341   LOJAS RENNER                      BRA    Retail                    1,726.5     1,651.3     4.6        179.6        184.9       -2.9
             338   370   AJE GROUP (1)                     PER    Beverages & Brewing       1,719.3     1,495.0    15.0         N.A.         N.A.          -
             339   281   COPASA                            BRA    Basic Services            1,719.2     1,943.4   -11.5        247.6        402.0      -38.4
             340     -   CAPUFE                            MEX    Transport & Logistics     1,708.0        N.A.       -         N.A.         N.A.          -
             341   413   DOW BRASIL                        BRA    Petrochemicals            1,698.0     1,323.4    28.3       -361.0       -104.0     -247.1
             342   339   ALL AMÉRICA LATINA                BRA    Transport & Logistics     1,691.7     1,652.6     2.4        130.6        147.6      -11.5
             343   372   SUPERMERCADOS LA FAVORITA         ECU    Retail                    1,688.3     1,486.1    13.6        125.5        111.4       12.6
             344   326   GRUPO SCHINCARIOL                 BRA    Beverages & Brewing       1,684.0     1,713.6    -1.7        -41.0         26.0     -257.7
             345   301   GRUPO ABRIL                       BRA    Mass Media                1,680.0     1,817.4    -7.6         99.0         87.0       13.8
             346   244   IBERDROLA DE MÉXICO (1)           MEX    Electricity               1,679.9     2,227.0   -24.6          0.0         N.A.          -
             347   278   GERDAU COMERCIAL DE AÇOS          BRA    Retail                    1,676.0     1,960.1   -14.5         31.0          0.5    6,100.0
             348   327   CORPORATIVO FRAGUA                MEX    Retail                    1,666.0     1,712.8    -2.7         60.8         59.2        2.7
             349   435   GRUPO VILLACERO (1)               MEX    Steel & Metallurgy        1,665.0     1,230.4    35.3         N.A.         N.A.          -
             350   246   CONSTRUTORA QUEIROZ GALVÃO        BRA    Construction              1,654.0     2,211.7   -25.2         27.0        143.0      -81.1


             28 AMÉRICAECONOMÍA / 2012 - 2013


RANKING 500 GI.indd 28                                                                                                                                         17/8/12 16:44:09
Nº 313
                                                                    Pedro Heilborn, CEO OF Copa:
                                  the airline which dominates Panama´s logistics and transport hub.


     EBITDA      EBITDA VARIATION     TOTAL     NET EQUITY WORK- EXPORTS                 NET    NET   EXPORT. Listed on
                                                                          ROE       ROA                                 OWNER-                                                 RK
    2011 US$    2010 US$ IN EBITDA ASSETS 2011 2011 US$ FORCE 2011 US$                  MARGIN EBITDA  AS %    STOCK                               WEBSITE (www.)
                                                                          (%)       (%)                                  SHIP                                                  11
     Millions    Millions 11/10 (%) US$ Millions Millions   2011 Millions                (%)    (%) OF SALES EXCHANGE

        498.5     517.6    -3.7        1,822.6     729.6    3,879         -   36.0 14.4     13.8   26.2      -         Yes            P*     elektro.com.br                    301
         N.A.      N.A.       -           N.A.      N.A.   48,000         -      -     -       -      -      -         No             P*     mcdonalds.com.br                  302
         N.A.      N.A.       -        1,438.3     809.2    6,471         -   23.0 12.9      9.9      -      -         Yes            P      koandina.com                      303
        382.0     248.0    54.0        7,928.0     604.0   13,802         -   12.9 1.0       4.1   20.3      -         No             S      infraero.gov.br                   304
         N.A.      N.A.       -           N.A.      N.A.     N.A.         -      -     -       -      -      -         No             P*     shell.cl                          305
         N.A.      N.A.       -        1,065.0     215.0   15,645     599.4   34.4 6.9       3.9      -   32.0         No             P      aurora.com.br                     306
        766.2     844.3    -9.3        2,900.6   1,401.5       59         -   22.3 10.8     16.7   40.9      -         No             P*     movistar.cl                       307
        761.0     704.8     8.0        1,760.8     686.3    1,943       9.9   39.2 15.3     14.4   40.7    0.5         No             P      entelpcs.cl                       308
         N.A.      N.A.       -          745.6     173.3     N.A.        34   70.1 16.3      6.5      -    1.8         No             P*     texaco.com                        309
         N.A.      N.A.       -        2,490.1   1,091.1    6,154       0.7   21.6 9.5      12.7      -      -         Yes            P      ccu.cl                            310
        344.1     276.4    24.5        8,471.9   5,865.0     N.A.       183    3.2 2.2      10.1   18.6    9.9         No             P      argos.com.co                      311
         N.A.      N.A.       -           N.A.      N.A.     N.A.         -      -     -       -      -      -         No             P      unimarc.cl                        312
         N.A.     324.0       -        3,065.8   1,389.5    5,000         -   22.3 10.1     17.0      -      -         Yes            P      copaair.com                       313
         N.A.      N.A.       -        3,550.3      N.A.    1,586         -      - 10.5     20.5      -      -         No             S      codelco.cl                        314
         48.6      46.4     4.6          647.6     213.1     N.A.       211   11.9 3.9       1.4    2.7   11.6         No             P*     chevrolet.com.co                  315
         N.A.      N.A.       -           N.A.      N.A.     N.A.         -      -     -       -      -      -         No             P      santaisabel.cl                    316
         N.A.      N.A.       -           N.A.      N.A.     N.A.         -      -     -       -      -      -         No             P      elektra.com.mx                    317
         N.A.      N.A.       -           N.A.      N.A.      618         -      -     -       -      -      -         No             P*     mosaicco.com                      318
        247.4     239.0     3.5        1,802.5     619.5     N.A.     251.1   29.5 10.1     10.2   13.8   14.0         Yes            P      marcopolo.com.br                  319
        195.3     176.9    10.4        1,206.7     564.7     N.A.         -   13.5 6.3       4.3   10.9      -         Yes            P      grupogloria.com                   320
         N.A.      N.A.       -          882.0     272.0    3,500         -   39.3 12.1      6.0      -      -         No             P      sotreq.com.br                     321
         N.A.      N.A.       -        3,342.0   1,433.0    5,238         -   10.0 4.3       8.1      -      -         Yes            P      gvt.com.br                        322
         N.A.      N.A.       -        2,346.7     725.9    2,551         -    8.8 2.7       3.6      -      -         Yes            P      gasco.cl                          323
         N.A.      N.A.       -        1,879.0     977.0    3,500         -   20.1 10.4     11.0      -      -         No             P*     dupont.com.br                     324
         N.A.      N.A.       -           N.A.      N.A.    2,250         -      -     -       -      -      -         No             P*     honda.mx                          325
        284.9     396.9   -28.2        7,103.8   3,543.0   11,542         -   -0.8 -0.4     -1.6   16.1      -         Yes            P      hypermarkas.com.br                326
      1,115.9     782.1    42.7        2,669.6   2,018.0    1,989   1,452.3   34.7 26.2     39.5   63.0   82.0         No             P      cmp.cl                            327
         38.8      44.5   -12.8          654.3     290.6    2,521         -    5.3 2.4       0.9    2.2      -         Yes            P      profarma.com.br                   328
         N.A.      N.A.       -          650.0     102.0      200         -   45.1 7.1       2.6      -      -         Yes            P      cotia.com.br                      329
        406.5     380.4     6.9        2,483.5     872.0    8,038         -   12.9 4.5       6.3   23.0      -         Yes            P*     ampla.com                         330
         N.A.      N.A.       -        2,236.0     694.0    1,460   1,884.7   94.7 29.4     37.2    0.0      -         No             P      cbmm.com.br                       331
        584.0     506.0    15.4        2,669.0   1,367.0    4,211      67.9   19.7 10.1     15.3   33.2    3.9         No             P      whitemartins.com.br               332
         N.A.      N.A.       -           N.A.      N.A.    1,000         -      -     -       -      -      -         No             P*     toyota.com.mx                     333
         N.A.      N.A.       -           N.A.      N.A.   11,000         -      -     -       -      -      -         No             P*     homedepot.com.mx                  334
         81.8      88.8    -7.9        1,499.5     509.6   30,676         -    6.0 2.0       1.8    4.7      -         Yes            P      salfacorp.cl                      335
        495.8     462.8     7.1        1,708.3     810.2    2,200         -   18.9 9.0       8.9   28.7      -         Yes            P*     telefonica.com.ar                 336
        304.0     288.2     5.5        1,590.5     615.7   13,340         -   29.2 11.3     10.4   17.6      -         No             P*     sony.com.mx                       337
         N.A.      N.A.       -           N.A.      N.A.     N.A.         -      -     -       -      -      -         No             P      ajegroup.com                      338
        560.6     763.4   -26.6        4,407.4   2,416.9     N.A.         -   10.2 5.6      14.4   32.6      -         Yes            S      copasa.com.br                     339
         N.A.      N.A.       -           N.A.      N.A.    4,900         -      -     -       -      -      -         No             P      capufe.gob.mx                     340
         N.A.      N.A.       -        1,021.0     166.0    2,309         - -217.5 -35.4   -21.3      -      -         No             P*     dow.com                           341
        854.1     842.3     1.4        7,539.2   2,143.2   10,368         -    6.1 1.7       7.7   50.5      -         Yes            P      all-logistica.com                 342
         N.A.      N.A.       -        1,163.3     814.9    6,600         -   15.4 10.8      7.4      -      -         Yes            P      supermaxi.com                     343
        142.0     231.0   -38.5        2,341.0   1,015.0   10,224         -   -4.0 -1.8     -2.4    8.4      -         No             P      schincariol.com.br                344
         N.A.      N.A.       -        1,360.0     101.0    9,000         -   98.0 7.3       5.9      -      -         No             P      abril.com.br                      345
         N.A.      N.A.       -        2,509.9   2,105.0      450         -    0.0 0.0       0.0      -      -         No             P*     iberdrola.es                      346
         N.A.      N.A.       -          721.0     554.0     N.A.         -    5.6 4.3       1.8      -      -         No             P      gerdau.com.br                     347
        101.7      98.8     2.9          714.9     387.4   19,653         -   15.7 8.5       3.6    6.1      -         Yes            P      fragua.com.mx                     348
         N.A.      N.A.       -           N.A.      N.A.    3,125         -      -     -       -      -      -         No             P      villacero.com                     349
         N.A.      N.A.       -        1,370.0   1,018.0   16,862         -    2.7 2.0       1.6      -      -         No             P      queirozgalvao.com                 350
                                                                                                                 P: Privately-owned          S: State-owned        P*: Foreign-owned

                                                                                                                                           2012 - 2013 / AMÉRICAECONOMÍA 29


RANKING 500 GI.indd 29                                                                                                                                                              17/8/12 16:44:17
LATIN AMERICA´S LARGEST COMPANIES

                                                                                                     SALES       SALES VARIATION IN NET PROFITS NET PROFITS VARIATION IN                     E
              RK   RK                                                COUN
                                           COMPANY                                SECTOR            2011 US$    2010 US$    SALES      2011         2010       PROFITS                      20
              11   10                                                -TRY
                                                                                                     Millions    Millions 11/10 (%) US$ Millions US$ Millions 11/010 (%)                     M

             351   403   PATAGONIA                                   ARG    Retail                    1,648.2     1,355.4    21.6         39.3        29.2        34.6
             352   355   CARVAJAL                                    COL    Printing                  1,639.1     1,563.1     4.9         17.1         7.5       129.3
             353   368   ROSSI RESIDENCIAL                           BRA    Construction              1,637.8     1,497.9     9.3        181.1       209.9       -13.7
             354     -   IBM DE MÉXICO                               MEX    Software & Data           1,637.5        N.A.       -         N.A.        N.A.           -
             355   537   GOLDCORP MÉXICO                             MEX    Mining                    1,628.6       946.8    72.0         N.A.        N.A.           -
             356   350   GRUPO ALGAR                                 BRA    Conglomerate              1,627.0     1,581.5     2.9        106.0        98.0         8.2
             357   353   GUARARAPES - RIACHUELO                      BRA    Textiles & Footwear       1,623.9     1,565.2     3.8        194.0       202.7        -4.3
             358   489   COOXUPÉ                                     BRA    Foods                     1,622.0     1,085.3    49.4         74.0        40.0        85.0
             359     -   GRUPO AGUIA BRANCA                          BRA    Transport & Logistics     1,609.0     1,415.0       -         19.0        54.0           -
             360   305   CELESTICA INC.                              MEX    Electronics               1,608.3     1,803.5   -10.8         N.A.        N.A.           -
             361   311   GRUPO MARTINS                               BRA    Retail                    1,604.0     1,785.4   -10.2         14.0        -6.0       333.3
             362   374   OLÍMPICA                                    COL    Retail                    1,588.2     1,483.8     7.0         45.0        38.1        18.2
             363   384   CANDELARIA                                  CHI    Mining                    1,588.0     1,434.1    10.7        623.0       562.3        10.8
             364   406   MOVISTAR PERÚ                               PER    Telecommunications        1,587.4     1,408.1    12.7        240.2       250.3        -4.0
             365   342   DURATEX                                     BRA    Manufacturing             1,583.5     1,645.5    -3.8        199.5       280.2       -28.8
             366   407   CMPC TISSUE                                 CHI    Pulp & Paper              1,582.9     1,344.6    17.7         -6.9        43.5      -115.9
             367   362   UTE                                         URU    Electricity               1,581.7     1,524.1     3.8        145.7       430.3       -66.1
             368   465   ALICORP                                     PER    Foods                     1,578.5     1,340.1    17.8        120.8       100.0        20.8
             369   319   CESP                                        BRA    Electricity               1,576.7     1,743.7    -9.6         57.9        55.8         3.8
             370   382   CONTAX                                      BRA    Telecommunications        1,576.0     1,439.2     9.5         11.2        65.1       -82.8
             371   547   GRANA Y MONTERO                             PER    Conglomerate              1,574.4       923.2    70.5        124.4        94.0        32.4
             372     -   BELCORP                                     PER    Chemicals & Pharma.       1,572.2     1,281.0       -         N.A.        N.A.           -
             373   443   PAMPA ENERGÍA                               ARG    Foods                     1,568.2     1,213.7    29.2       -215.5       -11.6    -1,757.8
             374   242   GAFISA                                      BRA    Construction              1,567.6     2,233.1   -29.8       -503.7       249.7      -301.7
             375   347   HOMEX                                       MEX    Construction              1,566.8     1,591.3    -1.5        112.6       130.3       -13.6
             376   337   CBA                                         BRA    Steel & Metallurgy        1,566.0     1,659.0    -5.6       -128.0       140.0      -191.4
             377   291   GRUPO VITRO                                 MEX    Manufacturing             1,565.5     1,626.6    -3.8         27.6       -96.9       128.5
             378   363   GRUPO CONDUMEX                              MEX    Manufacturing             1,560.5     1,512.6     3.2        120.2       226.2       -46.8
             379   482   BUENAVENTURA                                PER    Mining                    1,556.6     1,103.8    41.0        858.9       660.8        30.0
             380   367   LOCALIZA                                    BRA    Transport & Logistics     1,555.7     1,498.7     3.8        155.5       153.6         1.2
             381   325   CELPE                                       BRA    Electricity               1,553.5     1,716.5    -9.5        151.1       269.0       -43.8
             382   376   M. DIAS BRANCO                              BRA    Foods                     1,551.9     1,466.8     5.8        195.4       211.0        -7.4
             383   424   ZAFFARI E BOURBON                           BRA    Retail                    1,551.0     1,265.4    22.6         N.A.        N.A.           -
             384   346   VALE FERTILIZANTES                          BRA    Chemicals & Pharma.       1,549.0     1,606.5    -3.6        186.0        52.0       257.7
             385   410   IOCHPE-MAXION                               BRA    Carmaking                 1,548.7     1,336.8    15.9        119.1        98.5        20.9
             386   616   TIGRE - TUBOS E CONEXÕES                    BRA    Manufacturing             1,546.7     1,470.0     5.2         N.A.        N.A.           -
             387   404   CTEEP - COMPANHIA DE TRANSMISSÃO PAULISTA   BRA    Electricity               1,546.4     1,354.2    14.2        487.9       183.3       166.2
             388   373   INTERCEMENT BRASIL – EX C. CORRÊA CIMENTO   BRA    Cement                    1,538.0     1,485.2     3.6        163.0       120.0        35.8
             389   332   ULTRAGAZ                                    BRA    Oil & Gas                 1,534.0     1,690.3    -9.2         29.0        39.0       -25.6
             390   349   ALUMBRERA                                   ARG    Mining                    1,522.0     1,590.0    -4.3         N.A.        N.A.           -
             391   357   CASAS GEO                                   MEX    Construction              1,517.3     1,551.0    -2.2        103.0       114.5       -10.0
             392   411   GRUPO EMPRESARIAL ANGELES (1)               MEX    Health Services           1,511.9     1,336.1    13.2         N.A.        N.A.           -
             393   397   SUKARNE                                     MEX    Foods                     1,511.3     1,373.1    10.1        108.9        44.9       142.7
             394   365   EMPRESAS BANMÉDICA                          CHI    Health Services           1,509.9     1,508.7     0.1         83.1        94.5       -12.1
             395   421   EMPRESAS NAVIERAS                           CHI    Transport & Logistics     1,508.1     1,273.9    18.4        -23.1        43.8      -152.7
             396   348   ALUNORTE                                    BRA    Steel & Metallurgy        1,508.0     1,591.2    -5.2         17.0       100.1       -83.0
             397   386   CODENSA                                     COL    Electricity               1,507.5     1,429.0     5.5        231.1       246.3        -6.2
             398   360   RIPLEY CHILE                                CHI    Retail                    1,507.3     1,544.1    -2.4         79.4        78.4         1.3
             399   447   BARRICK MISQUICHILCA                        PER    Mining                    1,497.0     1,200.0    24.8        650.6       626.3         3.9
             400     -   SYNGENTA AGRO                               MEX    Agribusiness              1,496.2        N.A.       -         N.A.        N.A.           -


             30 AMÉRICAECONOMÍA / 2012 - 2013


RANKING 500 GI.indd 30                                                                                                                                                   17/8/12 16:44:25
Nº 374
                                                                Alicei Duilio Calciolari, CEO of Gafisa:
                                               record losses in the middle of Brazil´s property boom.


     EBITDA      EBITDA VARIATION     TOTAL     NET EQUITY WORK- EXPORTS                NET    NET   EXPORT. Listed on
                                                                          ROE      ROA                                 OWNER-                                                  RK
    2011 US$    2010 US$ IN EBITDA ASSETS 2011 2011 US$ FORCE 2011 US$                 MARGIN EBITDA  AS %    STOCK                                 WEBSITE (www.)
                                                                          (%)      (%)                                  SHIP                                                   11
     Millions    Millions 11/10 (%) US$ Millions Millions   2011 Millions               (%)    (%) OF SALES EXCHANGE

         73.4      55.8     31.5       469.8      198.1    11,000         -   19.8 8.4      2.4     4.5       -         Yes            P      laanonima.com.ar                 351
        206.7     197.7      4.5     2,094.6      726.5      N.A.         -    2.4 0.8      1.0    12.6       -         No             P      carvajal.com                     352
        216.3     225.0     -3.9     3,971.8    1,484.4      N.A.         -   12.2 4.6     11.1    13.2       -         Yes            P      rossiresidencial.com.br          353
         N.A.      N.A.        -        N.A.       N.A.      N.A.         -      -    -       -       -       -         No             P      ibm.com.mx                       354
         N.A.      N.A.        -    12,804.0       N.A.     5,310         -      -    -       -       -       -         No             P*     goldcorp.com                     355
         N.A.      N.A.        -     2,136.0      618.0      N.A.         -   17.2 5.0      6.5       -       -         Yes            P      algar.com.br                     356
        321.5     338.5     -5.0     1,978.3    1,193.3      N.A.         -   16.3 9.8     11.9    19.8       -         Yes            P      lojasriachuelo.com.br            357
         N.A.      N.A.        -     1,216.0      263.0     1,995     736.4   28.1 6.1      4.6       -    45.4         Yes            P      cooxupe.com.br                   358
         N.A.      N.A.        -     1,327.0      374.0     2,819         -    5.1 1.4      1.2       -       -         No             P      gab.com.br                       359
         N.A.      N.A.        -        N.A.       N.A.      N.A.         -      -    -       -       -       -         No             P      celestica.com                    360
         N.A.      N.A.        -       607.0       97.0      N.A.         -   14.4 2.3      0.9       -       -         No             P      martins.com.br                   361
        111.9      67.1     66.9       915.1      435.0      N.A.         -   10.3 4.9      2.8     7.0       -         No             P      olimpica.com.co                  362
        832.1     722.3     15.2     1,681.6    1,309.5     1,500   1,357.4   47.6 37.0    39.2    52.4    85.5         No             P*     phelpsdodge.com                  363
        553.3     512.3      8.0     1,432.8      413.4     1,200         -   58.1 16.8    15.1    34.9       -         Yes            P*     movistar.com.pe                  364
        536.7     652.8    -17.8     3,632.7    1,966.7    10,667         -   10.1 5.5     12.6    33.9       -         Yes            P      duratex.com.br                   365
        172.5     161.8      6.6     2,328.3      804.7     6,965      25.0   -0.9 -0.3    -0.4    10.9     1.6         No             P      cmpctissue.cl                    366
         N.A.     808.8        -     6,083.0    4,984.9      N.A.         -    2.9 2.4      9.2       -       -         No             S      ute.com.uy                       367
        204.7     187.2      9.4     1,143.2      683.7     4,500     192.4   17.7 10.6     7.7    13.0    12.2         Yes            P*     alicorp.com.pe                   368
        906.8     879.1      3.2     9,727.1    5,394.0     1,330         -    1.1 0.6      3.7    57.5       -         Yes            S      cesp.com.br                      369
        140.0     178.3    -21.5     1,411.4      263.2   107,200         -    4.3 0.8      0.7     8.9       -         Yes            P      contax.com.br                    370
        180.2     142.1     26.8     1,380.8      533.5      N.A.         -   23.3 9.0      7.9    11.4       -         Yes            P      gym.com.pe                       371
         N.A.      N.A.        -        N.A.       N.A.      N.A.         -      -    -       -       -       -         No             P      belcorp.biz                      372
        146.2     157.8     -7.4     2,650.3      546.0      N.A.         - -39.5 -8.1    -13.7     9.3       -         No             P      pampaenergia.com                 373
       -276.9     357.0   -177.6     5,068.0    1,411.9      N.A.         - -35.7 -9.9    -32.1   -17.7       -         Yes            P      gafisa.com.br                     374
        215.6     264.6    -18.5     2,966.3      967.0    11,737         -   11.6 3.8      7.2    13.8       -         Yes            P      homex.com.mx                     375
        138.0     295.0    -53.2     5,346.0    3,135.0     5,650     228.3   -4.1 -2.4    -8.2     8.8    14.6         No             P      cba.ind.br                       376
        252.9     195.8     29.2     2,393.8       -6.0    16,797         - -460.0 1.2      1.8    16.2       -         Yes            P      vitro.com.mx                     377
         N.A.      N.A.        -     1,473.9      923.7    15,000         -   13.0 8.2      7.7       -       -         No             P      condumex.com.mx                  378
        769.2     486.9     58.0     3,427.4    3,164.2      N.A.     851.7   27.1 25.1    55.2    49.4    54.7         Yes            P*     buenaventura.com.pe              379
        437.8     404.1      8.3     2,137.5      597.4     4,533         -   26.0 7.3     10.0    28.1       -         Yes            P      localiza.com                     380
        303.2     434.2    -30.2     2,163.1      856.9     1,657         -   17.6 7.0      9.7    19.5       -         Yes            P*     celpe.com.br                     381
        256.6     279.9     -8.3     1,630.3    1,069.3      N.A.         -   18.3 12.0    12.6    16.5       -         Yes            P      mdiasbranco.com.br               382
         N.A.      N.A.        -        N.A.       N.A.     9,203         -      -    -       -       -       -         No             P      zaffari.com.br                   383
        326.0     193.0     68.9     4,311.0    3,341.0     4,487         -    5.6 4.3     12.0    21.0       -         Yes            P      valefertilizantes.com            384
        219.2     187.4     17.0     1,328.8      489.7      N.A.         -   24.3 9.0      7.7    14.2       -         Yes            P      iochpe-maxion.com.br             385
         N.A.      N.A.        -        N.A.       N.A.     7,000         -      -    -       -       -       -         No             P      tigre.com.br                     386
        775.5     687.9     12.7     4,483.2    2,420.0     1,458         -   20.2 10.9    31.6    50.1       -         No             P      cteep.com.br                     387
        370.0     328.0     12.8     2,652.0    1,215.0     5,061         -   13.4 6.1     10.6    24.1       -         No             P      cimentocaue.com.br               388
        150.0     163.0     -8.0       642.0      237.0     4,129         -   12.2 4.5      1.9     9.8       -         No             P      ultragaz.com.br                  389
         N.A.      N.A.        -        N.A.       N.A.      N.A.         -      -    -       -       -       -         No             P*     alumbrera.com.ar                 390
        277.1     273.4      1.4     2,746.4      640.8    25,361         -   16.1 3.8      6.8    18.3       -         Yes            P      casasgeo.com                     391
         N.A.      N.A.        -     5,605.1    1,564.1    26,147         -      -    -       -       -       -         No             P      grupoempresarialangeles.com      392
         N.A.      N.A.        -       686.0      366.6     6,400         -   29.7 15.9     7.2       -       -         No             P      sukarne.com.mx                   393
        166.1     172.6     -3.8     1,114.1      312.8    14,241         -   26.6 7.5      5.5    11.0       -         Yes            P      empresasbanmedica.cl             394
         N.A.      N.A.        -       785.2      199.1     2,192         - -11.6 -2.9     -1.5       -       -         Yes            P      empresasnavieras.com             395
        186.0     240.0    -22.5     3,575.0    2,439.0     1,615   1,432.4    0.7 0.5      1.1    12.3    95.0         No             P      alunorte.net                     396
        493.1     504.3     -2.2     2,631.3    1,330.8      N.A.         -   17.4 8.8     15.3    32.7       -         No             P*     codensa.com.co                   397
         N.A.      N.A.        -     1,841.8    1,070.8    13,929         -    7.4 4.3      5.3       -       -         No             P      ripley.cl                        398
      1,074.6     896.3     19.9     2,255.4    1,543.5      N.A.   1,497.0   42.1 28.8    43.5    71.8   100.0         Yes            P*     barrick.com                      399
         N.A.      N.A.        -        N.A.       N.A.     2,500         -      -    -       -       -       -         No             P      syngenta.com.mx                  400
                                                                                                                  P: Privately-owned         S: State-owned        P*: Foreign-owned

                                                                                                                                            2012 - 2013 / AMÉRICAECONOMÍA 31


RANKING 500 GI.indd 31                                                                                                                                                              17/8/12 16:44:32
LATIN AMERICA´S LARGEST COMPANIES

                                                                                                SALES       SALES VARIATION IN NET PROFITS NET PROFITS VARIATION IN                     E
              RK   RK                                           COUN
                                          COMPANY                            SECTOR            2011 US$    2010 US$    SALES      2011         2010       PROFITS                      20
              11   10                                           -TRY
                                                                                                Millions    Millions 11/10 (%) US$ Millions US$ Millions 11/010 (%)                     M

             401   359   V&M                                    BRA    Steel & Metallurgy        1,492.0     1,544.2    -3.4        318.0        309.0        2.9
             402     -   PAGUE MENOS                            BRA    Retail                    1,484.0     1,156.0       -         58.0         38.0          -
             403     -   VOTORANTIM ANDINA                      CHI    Mining                    1,482.8       811.1    82.8        102.1        499.8      -79.6
             404   344   LIQUIGÁS                               BRA    Retail                    1,480.0     1,611.4    -8.2         56.0         71.0      -21.1
             405   375   LEAR CORPORACIÓN MÉXICO                MEX    Carmaking                 1,479.7     1,468.7     0.7         N.A.         N.A.          -
             406   419   NUEVA EPS                              COL    Health Services           1,474.6     1,277.4    15.4          7.9         10.9      -27.8
             407   276   NOKIA                                  BRA    Electronics               1,465.0     1,986.0   -26.2         N.A.         N.A.          -
             408   493   KENWORTH MEXICANA                      MEX    Carmaking                 1,458.9     1,069.9    36.4         N.A.         60.9          -
             409   315   APERAM INOX – EX ARCELOR MITTAL INOX   BRA    Steel & Metallurgy        1,457.0     1,766.2   -17.5        -87.0         N.A.          -
             410   446   DROGASIL                               BRA    Retail                    1,455.1     1,203.5    20.9         36.6         53.4      -31.5
             411   414   OHL BRASIL                             BRA    Transport & Logistics     1,445.8     1,311.1    10.3        215.6        182.6       18.1
             412   402   3M DO BRASIL                           BRA    Petrochemicals            1,440.0     1,355.9     6.2         N.A.         N.A.          -
             413   395   C. VALE                                BRA    Agribusiness              1,429.0     1,384.1     3.2         27.0         18.0       50.0
             414   328   FASA                                   CHI    Retail                    1,426.1     1,711.7   -16.7         16.8         -4.8      450.0
             415   499   FERREYROS                              PER    Conglomerate              1,419.8     1,053.7    34.7         72.3         43.2       67.6
             416   432   PREZUNIC SUPERMERCADOS                 BRA    Retail                    1,414.0     1,244.7    13.6         N.A.         N.A.          -
             417   425   VIAKABLE                               MEX    Electronics               1,412.2     1,251.6    12.8         N.A.         N.A.          -
             418   398   PETROBRAS (1)                          CHI    Oil & Gas                 1,407.1     1,372.8     2.5         N.A.         N.A.          -
             419   436   AMÉRICA MOVIL ECUADOR                  ECU    Telecommunications        1,403.0     1,228.0    14.3         N.A.         N.A.          -
             420   329   COELCE                                 BRA    Electricity               1,400.6     1,710.3   -18.1        251.2        283.2      -11.3
             421   494   MINERA VALPARAÍSO                      CHI    Conglomerate              1,395.0     1,069.8    30.4        202.0        233.9      -13.6
             422   262   IFH PERÚ HOLDING                       PER    Conglomerate              1,392.3     1,058.3    31.6        237.5        183.0       29.8
             423   438   RENAULT ARGENTINA (1)                  ARG    Carmaking                 1,385.0     1,225.0    13.1         N.A.         N.A.          -
             424     -   NAVISTAR INTERNACIONAL                 MEX    Carmaking                 1,382.5        N.A.       -         N.A.         N.A.          -
             425   408   ALPARGATAS                             BRA    Textiles & Footwear       1,372.6     1,343.9     2.1        163.9        183.9      -10.9
             426   409   TERPEL (1)                             CHI    Oil & Gas                 1,371.6     1,338.1     2.5         N.A.         N.A.          -
             427   572   INFRAESTRUCTURA Y TRANSPORTES MÉXICO   MEX    Mining                    1,368.3        N.A.       -        192.1         N.A.          -
             428   471   GRUPO WONG                             PER    Retail                    1,364.7     1,099.3    24.1         61.3         39.0       57.2
             429   391   GRUPO ACS                              MEX    Construction              1,357.6     1,404.6    -3.3         N.A.         N.A.          -
             430   617   PROCTER & GAMBLE                       BRA    Chemicals & Pharma.       1,353.0        N.A.       -       -150.0       -141.0       -6.4
             431   369   TELEFÓNICA CHILE                       CHI    Telecommunications        1,348.1     1,495.3    -9.8        130.4        223.7      -41.7
             432   377   CPFL PIRATININGA                       BRA    Electricity               1,345.6     1,462.3    -8.0        164.4        181.1       -9.2
             433   385   GRUPO OMNILIFE (1)                     MEX    Health Services           1,344.9     1,432.9    -6.1         N.A.         N.A.          -
             434   303   DELTA CONSTRUÇÕES                      BRA    Construction              1,344.0     1,814.7   -25.9         17.0        117.0      -85.5
             435   418   DROGARIA SÃO PAULO                     BRA    Retail                    1,337.0     1,286.3     3.9         19.0         11.0       72.7
             436   508   COLBÚN                                 CHI    Electricity               1,332.8     1,024.2    30.1          5.2        112.3      -95.4
             437   415   MOLYMET                                CHI    Steel & Metallurgy        1,330.3     1,298.2     2.5        103.2         91.7       12.5
             438   509   PETROMINERALES                         COL    Oil & Gas                 1,325.5     1,020.4    29.9        460.2        233.2       97.3
             439   452   MINSUR                                 PER    Mining                    1,322.3     1,196.0    10.6        294.8        377.1      -21.8
             440   389   CMPC CELULOSA                          CHI    Pulp & Paper              1,316.1     1,412.9    -6.9        260.5        322.3      -19.2
             441   506   PERUANA DE COMBUSTIBLES (1)            PER    Oil & Gas                 1,312.3     1,025.9    27.9          5.4          4.2       29.2
             442   502   ERICSSON                               BRA    Electronics               1,309.0     1,034.1    26.6         33.0         -6.0      650.0
             443   437   PARIS                                  CHI    Retail                    1,306.4     1,227.0     6.5         N.A.         N.A.          -
             444   430   LOJAS MARISA                           BRA    Retail                    1,306.3     1,245.8     4.9         94.6        125.2      -24.4
             445   464   ALCOA                                  BRA    Steel & Metallurgy        1,302.0     1,151.2    13.1        -66.0       -169.0       60.9
             446   423   CELPA                                  BRA    Electricity               1,297.5     1,266.9     2.4       -208.5        -60.5     -244.6
             447   416   ENERGISA                               BRA    Electricity               1,293.6     1,293.0     0.0        113.0        116.8       -3.3
             448     -   PERÚ LNG                               PER    Oil & Gas                 1,287.8       288.2   346.8         26.7        -85.6      131.1
             449   401   BANDEIRANTE ENERGIA                    BRA    Electricity               1,285.1     1,355.9    -5.2        118.8        167.0      -28.9
             450   427   OXITENO                                BRA    Oil & Gas                 1,284.0     1,250.3     2.7         N.A.         N.A.          -


             32 AMÉRICAECONOMÍA / 2012 - 2013


RANKING 500 GI.indd 32                                                                                                                                              17/8/12 16:44:39
Nº 428
                                                                   Efraín Wong, CEO of Grupo Wong:
                                               The more Peru consumes, the more Wong´s profits rise.


     EBITDA      EBITDA VARIATION     TOTAL     NET EQUITY WORK- EXPORTS                   NET    NET   EXPORT. Listed on
                                                                          ROE         ROA                                 OWNER-                                                  RK
    2011 US$    2010 US$ IN EBITDA ASSETS 2011 2011 US$ FORCE 2011 US$                    MARGIN EBITDA  AS %    STOCK                               WEBSITE (www.)
                                                                          (%)         (%)                                  SHIP                                                   11
     Millions    Millions 11/10 (%) US$ Millions Millions   2011 Millions                  (%)    (%) OF SALES EXCHANGE

         N.A.      N.A.         -    2,833.0     1,955.0    6,352         -    16.3   11.2    21.3      -      -         Yes            P      vmtubes.com.br                     401
        123.0      77.0         -      536.0       131.0   13,000         -    44.3   10.8     3.9    8.3      -         No             P      paguemenos.com.br                  402
        136.5     518.8     -73.7    4,847.8     3,263.9     N.A.         -     3.1    2.1     6.9    9.2      -         No             P*     -                                  403
         82.0     130.0     -36.9      569.0       371.0    3,223         -    15.1    9.8     3.8    5.5      -         No             P      liquigas.com.br                    404
         N.A.      N.A.         -       N.A.        N.A.   34,100         -       -      -       -      -      -         No             P      lear.com                           405
         N.A.      N.A.         -      534.6        51.4     N.A.         -    15.3    1.5     0.5      -      -         No             P      nuevaeps.com.co                    406
         N.A.      N.A.         -       N.A.        N.A.    2,000         -       -      -       -      -      -         No             P*     nokia.com.br                       407
         N.A.      N.A.         -       N.A.        N.A.    2,737         -       -      -       -      -      -         No             P*     kenmex.com                         408
        137.0     206.0     -33.5    2,630.0     1,060.0    9,800     275.3    -8.2   -3.3    -6.0    9.4   18.9         No             P      arcelormittalinoxbrasil.com.br     409
         72.1      86.1     -16.3    1,689.0     1,173.5     N.A.         -     3.1    2.2     2.5    5.0      -         Yes            P      drogasil.com.br                    410
        539.6     500.7       7.8    2,958.9       745.5     N.A.         -    28.9    7.3    14.9   37.3      -         Yes            P*     ohlbrasil.com.br                   411
         N.A.      N.A.         -       N.A.        N.A.    4,000         -       -      -       -      -      -         No             P*     3m.com.br                          412
         N.A.      N.A.         -    1,107.0       399.0    5,631     212.0     6.8    2.4     1.9      -   14.8         No             P      cvale.com.br                       413
         64.1      42.1      52.3      700.0       111.8    9,393         -    15.0    2.4     1.2    4.5      -         Yes            P      fasa.cl                            414
        158.3     125.8      25.8    1,245.9       395.2     N.A.      12.0    18.3    5.8     5.1   11.1    0.8         Yes            P      ferreyros.com.pe                   415
         N.A.      N.A.         -       N.A.        N.A.    7,957         -       -      -       -      -      -         No             P      v2.prezunic.com.br                 416
         N.A.      N.A.         -      764.8       269.7    3,552         -       -      -       -      -      -         No             P      viakable.com                       417
         N.A.      N.A.         -       N.A.        N.A.     N.A.         -       -      -       -      -      -         No             P*     petrobrastuchile.cl                418
         N.A.      N.A.         -       N.A.        N.A.     N.A.         -       -      -       -      -      -         No             P      -                                  419
        402.4     484.4     -16.9    1,787.5       784.2     N.A.         -    32.0   14.1    17.9   28.7      -         Yes            P*     coelce.com.br                      420
         N.A.      N.A.         -    9,371.3     6,908.6      271         -     2.9    2.2    14.5      -      -         No             P      minera.cl                          421
         N.A.      N.A.         -   11,022.4     1,451.7     N.A.         -    16.4    2.2    17.1      -      -         Yes            P      ifhperu.com                        422
         N.A.      N.A.         -       N.A.        N.A.     N.A.         -       -      -       -      -      -         No             P*     renault.com.ar                     423
         N.A.      N.A.         -       N.A.        N.A.    2,000         -       -      -       -      -      -         No             P      internacionalcamiones.com          424
        195.0     225.1     -13.4    1,302.1       787.8     N.A.         -    20.8   12.6    11.9   14.2      -         Yes            P      alpargatas.com.br                  425
         N.A.      N.A.         -       N.A.        N.A.     N.A.         -       -      -       -      -      -         No             P*     terpelchile.cl                     426
         N.A.      N.A.         -    2,284.7     1,507.9    9,915         -    12.7    8.4    14.0      -      -         No             P      gmexico.com.mx                     427
        123.2      76.4      61.2    1,369.9       644.7     N.A.         -     9.5    4.5     4.5    9.0      -         No             P*     cencosud.cl                        428
         N.A.      N.A.         -       N.A.        N.A.    1,100         -       -      -       -      -      -         No             P      grupoacs.com                       429
         N.A.      N.A.         -    3,073.0     1,600.0    2,862         -    -9.4   -4.9   -11.1      -      -         No             P      pg.com                             430
        517.4     668.5     -22.6    2,539.6     1,226.6    5,454         -    10.6    5.1     9.7   38.4      -         Yes            P*     telefonicachile.cl                 431
        314.4     327.1      -3.9    1,275.0       207.4     N.A.         -    79.3   12.9    12.2   23.4      -         Yes            P      cpfl.com.br                         432
         N.A.      N.A.         -       N.A.        N.A.     N.A.         -       -      -       -      -      -         No             P      omnilife.com.mx                    433
         N.A.     214.0         -      920.0       573.0   14,835         -     3.0    1.8     1.3      -      -         No             P      deltaconstrucao.com.br             434
         N.A.      N.A.         -      421.0       119.0    7,460         -    16.0    4.5     1.4      -      -         Yes            P      drogariasaopaulo.com.br            435
        175.8     260.3     -32.5    5,619.5     3,462.2      922         -     0.2    0.1     0.4   13.2      -         Yes            P      colbun.cl                          436
         N.A.      N.A.         -    1,609.9       881.9    1,563   1,007.9    11.7    6.4     7.8      -   75.8         Yes            P      molymet.cl                         437
        832.2     619.7      34.3    2,077.4       974.9     N.A.         -    47.2   22.2    34.7   62.8      -         No             P      petrominerales.com                 438
        562.6     567.9      -0.9    1,886.6     1,764.4     N.A.     322.8    16.7   15.6    22.3   42.5   24.4         Yes            P*     minsur.com.pe                      439
         30.9      N.A.         -    4,510.3     1,672.3    1,775   1,177.3    15.6    5.8    19.8    2.3   89.5         No             P      cmpc.cl                            440
         16.1      13.0      23.5      156.7        46.2     N.A.         -    11.7    3.5     0.4    1.2      -         No             P      pecsa.com                          441
         N.A.      N.A.         -    1,467.0       397.0     N.A.         -     8.3    2.2     2.5      -      -         Yes            P*     ericsson.com/br/                   442
         N.A.      80.0         -       N.A.        N.A.     N.A.         -       -      -       -      -      -         No             P      paris.cl                           443
        213.1     233.7      -8.8    1,296.8       457.3     N.A.         -    20.7    7.3     7.2   16.3      -         Yes            P      marisa.com.br                      444
         N.A.      N.A.         -    4,854.0     2,443.0    3,547     238.1    -2.7   -1.4    -5.1      -   18.3         No             P*     alcoa.com                          445
        116.8     196.4     -40.5    2,323.3       266.8    2,221         -   -78.1   -9.0   -16.1    9.0      -         Yes            P      gruporede.com.br                   446
        295.8     304.9      -3.0    2,270.2       695.3    5,561         -    16.3    5.0     8.7   22.9      -         Yes            P      energisa.com.br                    447
        277.2       3.8   7,242.3    3,660.1        83.7     N.A.   1,284.0    31.9    0.7     2.1   21.5   99.7         No             P      huntoil.com                        448
        256.6     291.5     -12.0    1,374.1       421.9    1,098         -    28.2    8.6     9.2   20.0      -         Yes            P      bandeirante.com.br                 449
        139.0     128.0       8.6    1,842.0        N.A.    1,595         -       -      -       -   10.8      -         No             P      ultrapar.com                       450
                                                                                                                   P: Privately-owned          S: State-owned         P*: Foreign-owned

                                                                                                                                             2012 - 2013 / AMÉRICAECONOMÍA 33


RANKING 500 GI.indd 33                                                                                                                                                                 17/8/12 16:44:46
LATIN AMERICA´S LARGEST COMPANIES

                                                                                               SALES       SALES VARIATION IN NET PROFITS NET PROFITS VARIATION IN                     E
              RK   RK                                          COUN
                                           COMPANY                          SECTOR            2011 US$    2010 US$    SALES      2011         2010       PROFITS                      20
              11   10                                          -TRY
                                                                                               Millions    Millions 11/10 (%) US$ Millions US$ Millions 11/010 (%)                     M

             451   440   JSL                                   BRA    Transport & Logistics     1,283.8     1,217.4     5.5         30.3         55.8      -45.7
             452   474   PLUSPETROL PERÚ CORPORATION           PER    Oil & Gas                 1,281.0     1,125.0    13.9         N.A.         N.A.          -
             453   387   GRUPO IUSA (1)                        MEX    Manufacturing             1,276.2     1,428.6   -10.7         N.A.         N.A.          -
             454   451   METALSA                               MEX    Carmaking                 1,271.3     1,196.5     6.3         N.A.         N.A.          -
             455   434   GRUPO PALACIO DE HIERRO               MEX    Retail                    1,268.9     1,234.5     2.8         74.3         71.4        4.1
             456   390   GRUPO GALVÃO                          BRA    Construction              1,265.0     1,323.0    -4.4        -45.0         36.0     -225.0
             457   428   DAIMLER                               MEX    Carmaking                 1,264.2     1,250.2     1.1        108.0         14.8      629.7
             458   371   SANMINA - SCI SYSTEMS DE MÉXICO (1)   MEX    Electronics               1,257.3     1,493.2   -15.8         57.7         73.8      -21.8
             459   477   EMPRESA ELECTRICA DEL NORTE GRANDE    CHI    Electricity               1,256.6     1,120.2    12.2        178.6        200.1      -10.7
             460   511   MASISA                                CHI    Manufacturing             1,251.2     1,017.3    23.0         68.9         72.4       -4.8
             461   529   PRIMO SCHINCARIOL                     BRA    Beverages & Brewing       1,248.0       964.6    29.4        -83.0        -26.0     -219.2
             462   544   C.I. PRODECO                          COL    Retail                    1,247.2       927.6    34.5        117.3         84.6       38.6
             463   466   CHRYSLER (1)                          ARG    Carmaking                 1,245.0     1,145.0     8.7         N.A.         N.A.          -
             464   498   ALKOSTO                               COL    Retail                    1,242.0     1,056.2    17.6         42.1         39.4        7.0
             465   527   VOLCAN                                PER    Mining                    1,240.4       973.3    27.4        370.3        278.1       33.1
             466   399   MAGNESITA                             BRA    Mining                    1,236.2     1,366.2    -9.5         52.2         55.1       -5.3
             467   400   CEG                                   BRA    Oil & Gas                 1,228.3     1,358.6    -9.6        134.2        138.1       -2.8
             468   417   CGE DISTRIBUCIÓN                      CHI    Electricity               1,217.3     1,292.4    -5.8        -33.9         25.8     -231.4
             469   476   ELECTRICARIBE                         COL    Electricity               1,217.0     1,122.9     8.4         39.2         58.3      -32.8
             470     -   GRUPO SAGA                            BRA    Retail                    1,217.0       274.0       -         25.0          9.0          -
             471   420   RIO GRANDE ENERGIA                    BRA    Electricity               1,215.2     1,275.5    -4.7        128.4        144.6      -11.2
             472   429   EDITORA ABRIL                         BRA    Mass Media                1,214.0     1,247.5    -2.7        143.0        116.0       23.3
             473   496   ALUAR                                 ARG    Steel & Metallurgy        1,212.6     1,065.4    13.8        126.5        163.7      -22.7
             474   504   ULTRAFÉRTIL                           BRA    Chemicals & Pharma.       1,208.0     1,029.5    17.3         65.0        -25.0      360.0
             475   396   OHL MÉXICO                            MEX    Transport & Logistics     1,203.7     1,377.2   -12.6        270.4        232.4       16.4
             476   461   DANONE (1)                            MEX    Foods                     1,198.1     1,154.2     3.8         N.A.         N.A.          -
             477   559   PROCESADORA SUDAMERICANA              PER    Steel & Metallurgy        1,197.0       987.8    21.2         N.A.         N.A.          -
             478   439   UNILEVER DE MÉXICO (1)                MEX    Chemicals & Pharma.       1,195.1     1,217.8    -1.9         N.A.         N.A.          -
             479   485   MAHLE METAL LEVE                      BRA    Carmaking                 1,192.4     1,094.3     9.0        100.6         49.7      102.4
             480   484   SONY DE MÉXICO (1)                    MEX    Electronics               1,192.1     1,103.6     8.0         N.A.         N.A.          -
             481     -   LBR LACTEOS BRASIL                    BRA    Foods                     1,180.0        N.A.       -       -162.0         N.A.          -
             482   412   CELGPAR                               BRA    Electricity               1,178.9     1,326.6   -11.1       -353.1       -378.4        6.7
             483   444   URBI DESARROLLOS URBANOS              MEX    Construction              1,170.7     1,212.7    -3.5        171.3        136.3       25.7
             484   487   FINNING CHILE (1)                     CHI    Machinery                 1,167.8     1,090.9     7.0         N.A.         N.A.          -
             485   475   TUPY                                  BRA    Carmaking                 1,165.1     1,123.2     3.7        108.4         92.7       16.9
             486     -   KOMATSU CUMMINS CHILE                 CHI    Conglomerate              1,164.2     1,026.7    13.4         98.6         90.8        8.6
             487     -   CISA TRADING                          BRA    Retail                    1,149.0       746.0       -         33.0         22.0          -
             488     -   CODELCO DIV. SALVADOR                 CHI    Mining                    1,148.3     1,163.7    -1.3        113.8         44.8      154.0
             489   450   HOLCIM APASCO                         MEX    Cement                    1,147.5     1,198.7    -4.3         N.A.         N.A.          -
             490   479   MINERA ZALDÍVAR                       CHI    Mining                    1,146.6     1,123.1     2.1        488.7        536.4       -8.9
             491   551   AMÉRICA MÓVIL PERÚ – CLARO            PER    Telecommunications        1,141.6     1,001.4    14.0         N.A.         N.A.          -
             492   453   GAS NATURAL FENOSA MÉXICO             MEX    Electricity               1,137.1     1,186.5    -4.2         85.8         99.0      -13.3
             493     -   SHOUGANG HIERRO PERÚ                  PER    Mining                    1,137.1       674.6    68.6        455.4        283.2       60.8
             494   536   SONDA                                 CHI    Software & Data           1,136.8       951.1    19.5         77.9         71.6        8.8
             495     -   BIOMAX                                COL    Oil & Gas                 1,134.1        N.A.       -          6.0         N.A.          -
             496   379   REPSOL COMERCIAL – RECOSAC            PER    Oil & Gas                 1,123.6       921.0    22.0         21.4         20.1        6.5
             497     -   GRUPO THYSSENKRUPP                    MEX    Machinery                 1,116.3        N.A.       -         N.A.         N.A.          -
             498   546   UCP BACKUS & JOHNSTON                 PER    Beverages & Brewing       1,114.8     1,144.9    -2.6        271.0        186.4       45.4
             499   469   NOVARTIS                              BRA    Chemicals & Pharma.       1,114.0     1,132.7    -1.6         78.0         97.0      -19.6
             500   392   POSITIVO INFORMATICA                  BRA    Electronics               1,109.5     1,397.0   -20.6        -36.2         53.5     -167.7


             34 AMÉRICAECONOMÍA / 2012 - 2013


RANKING 500 GI.indd 34                                                                                                                                             17/8/12 16:44:57
Nº 494
                                                                     Andrés Navarro, CEO of Sonda:
                                   the Chilean software and data firm made a timely wager on Brazil.


     EBITDA      EBITDA VARIATION     TOTAL     NET EQUITY WORK- EXPORTS                    NET    NET   EXPORT. Listed on
                                                                          ROE          ROA                                 OWNER-                                                   RK
    2011 US$    2010 US$ IN EBITDA ASSETS 2011 2011 US$ FORCE 2011 US$                     MARGIN EBITDA  AS %    STOCK                                WEBSITE (www.)
                                                                          (%)          (%)                                  SHIP                                                    11
     Millions    Millions 11/10 (%) US$ Millions Millions   2011 Millions                   (%)    (%) OF SALES EXCHANGE

        229.8     198.1     16.0       2,049.7     449.6     N.A.         -     6.7     1.5     2.4   17.9       -         Yes            P      juliosimoeslogistica.com.br        451
         N.A.      N.A.        -          N.A.      N.A.     N.A.   1,281.0       -       -       -      -   100.0         No             P      pluspetrol.net                     452
         N.A.      N.A.        -          N.A.      N.A.    7,358         -       -       -       -      -       -         No             P      grupo-iusa.com                     453
         N.A.      N.A.        -          N.A.      N.A.    6,300         -       -       -       -      -       -         No             P      metalsa.com.mx                     454
        168.3     173.9     -3.2       1,565.0     834.5   10,614         -     8.9     4.7     5.9   13.3       -         Yes            P      elpalaciodehierro.com.mx           455
         29.0     118.0    -75.4       1,283.0     229.0     N.A.         -   -19.7    -3.5    -3.6    2.3       -         No             P      galvaoengenharia.com.br            456
         N.A.      N.A.        -       2,055.2     493.8    5,192         -    21.9     5.3     8.5      -       -         No             P*     daimler.com.mx                     457
         N.A.      N.A.        -         583.4     273.6    8,930         -    21.1     9.9     4.6      -       -         No             P*     sanmina-sci.com                    458
         N.A.      N.A.        -       2,811.0   1,677.8      781         -    10.6     6.4    14.2      -       -         Yes            P      e-cl.cl                            459
        197.8     148.0     33.6       2,683.0   1,400.1    8,623     171.4     4.9     2.6     5.5   15.8    13.7         Yes            P      masisa.cl                          460
         N.A.      N.A.        -       2,009.0     673.0    5,470         -   -12.3    -4.1    -6.7      -       -         Yes            P      schincariol.com.br                 461
        250.2     131.5     90.3       1,270.6     407.3     N.A.         -    28.8     9.2     9.4   20.1       -         No             P      prodeco.com.co                     462
         N.A.      N.A.        -          N.A.      N.A.    2,000         -       -       -       -      -       -         No             P*     chrysler.com.ar                    463
         69.9      60.1     16.3         970.0     473.0     N.A.         -     8.9     4.3     3.4    5.6       -         No             P      alkosto.com.co                     464
        641.5     499.7     28.4       1,885.9   1,333.3     N.A.     160.4    27.8    19.6    29.9   51.7    12.9         Yes            P      volcan.com.pe                      465
        210.4     277.1    -24.1       2,843.7   1,406.5    6,782     141.0     3.7     1.8     4.2   17.0    11.4         Yes            P      magnesita.com.br                   466
        281.4     300.7     -6.4       1,027.8     462.7      440         -    29.0    13.1    10.9   22.9       -         Yes            P      ceg.com.br                         467
         N.A.      N.A.        -       1,208.6     524.5      788         -    -6.5    -2.8    -2.8      -       -         Yes            P      cge.cl                             468
        120.3     158.3    -24.0       2,225.3   1,031.5    7,715         -     3.8     1.8     3.2    9.9       -         No             P      eletricaribe.com                   469
         N.A.      N.A.        -         343.0     110.0      520         -    22.7     7.3     2.1      -       -         No             P      saganet.com.br                     470
        275.3     297.2     -7.4       1,511.7     708.1     N.A.         -    18.1     8.5    10.6   22.7       -         Yes            P      rge-rs.com.br                      471
         N.A.      N.A.        -       1,162.0     248.0    4,200         -    57.7    12.3    11.8      -       -         No             P      abril.com.br                       472
        298.1     349.5    -14.7       1,804.6   1,190.4     N.A.         -    10.6     7.0    10.4   24.6       -         No             P      aluar.com.ar                       473
        241.0      71.0    239.4       1,698.0     915.0     N.A.         -     7.1     3.8     5.4   20.0       -         Yes            P      valefertilizantes.com              474
        543.5     398.7     36.3       4,496.5   2,006.4    1,231         -    13.5     6.0    22.5   45.2       -         No             P*     ohlmexico.com.mx                   475
         N.A.      N.A.        -          N.A.      N.A.   15,000         -       -       -       -      -       -         No             P*     danone.com.mx                      476
         N.A.      N.A.        -          N.A.      N.A.     N.A.   1,197.0       -       -       -      -   100.0         No             P      psa.com.pe                         477
         N.A.      N.A.        -          N.A.      N.A.    5,476         -       -       -       -      -       -         No             P*     unilever.com.mx                    478
        198.4     145.8     36.1       1,412.4     708.2   11,229     430.6    14.2     7.1     8.4   16.6    36.1         Yes            P      metalleve.com.br                   479
         N.A.      N.A.        -          N.A.      N.A.      350         -       -       -       -      -       -         Yes            P      sony.com.mx                        480
         N.A.      N.A.        -       1,772.0     929.0     N.A.         -   -17.4    -9.1   -13.7      -       -         No             P      lbr-lacteosbrasil.com.br           481
         N.A.      N.A.        -       2,622.1    -689.8    2,310         -       -   -13.5   -30.0      -       -         Yes            S      celg.com.br                        482
        238.0     263.3     -9.6       3,087.3   1,254.1    6,415         -    13.7     5.5    14.6   20.3       -         Yes            P      urbi.com.mx                        483
         N.A.      N.A.        -          N.A.      N.A.    3,356      98.7       -       -       -      -     8.5         No             P*     finning.cl                          484
        179.9     163.2     10.2       1,864.7     584.6     N.A.     568.1    18.5     5.8     9.3   15.4    48.8         Yes            P      tupy.com.br                        485
        214.1     179.0     19.6          N.A.      N.A.    4,513         -       -       -     8.5   18.4       -         No             P*     kcl.cl                             486
         N.A.      N.A.        -         449.0      85.0      250         -    38.8     7.3     2.9      -       -         No             P      cisatrading.com.br                 487
         N.A.      N.A.        -         899.4      N.A.    1,551         -       -    12.7     9.9      -       -         No             S      codelco.cl                         488
         N.A.      N.A.        -          N.A.      N.A.    3,986         -       -       -       -      -       -         No             P*     apasco.com.mx                      489
        645.2     712.9     -9.5       1,170.9     886.3      848   1,131.1    55.1    41.7    42.6   56.3    98.6         No             P*     barrick.cl                         490
         N.A.      N.A.        -          N.A.      N.A.     N.A.         -       -       -       -      -       -         No             P*     claro.com.pe                       491
         N.A.      N.A.        -       2,981.2   1,391.6    1,005         -     6.2     2.9     7.5      -       -         No             P      gasnaturalmexico.com               492
        782.1     491.0     59.3       1,427.0     966.8     N.A.   1,012.0    47.1    31.9    40.1   68.8    89.0         No             P      shougang.com.pe                    493
        158.6     137.8     15.1       1,112.5     588.0   12,500         -    13.2     7.0     6.9   14.0       -         Yes            P      sonda.com                          494
         34.6      N.A.        -         281.9     105.7     N.A.         -     5.7     2.1     0.5    3.0       -         No             P      biomax.co                          495
         N.A.      N.A.        -          N.A.      N.A.     N.A.         -       -       -     1.9      -       -         No             P*     repsol.com/pe_es                   496
         N.A.      N.A.        -          N.A.      N.A.    3,400         -       -       -       -      -       -         No             P*     thyssenkrupp.com                   497
        457.5     354.5     29.1       1,250.8     746.5    1,700      10.2    36.3    21.7    24.3   41.0     0.9         No             P*     backus.com.pe                      498
         N.A.      N.A.        -         652.0     247.0    1,810         -    31.6    12.0     7.0      -       -         No             P      novartis.com.br                    499
        -11.9      82.0   -114.5         835.9     330.1    4,049         -   -11.0    -4.3    -3.3      -       -         Yes            P      positivo.com.br                    500
                                                                                                                     P: Privately-owned          S: State-owned         P*: Foreign-owned

                                                                                                                                               2012 - 2013 / AMÉRICAECONOMÍA 35


RANKING 500 GI.indd 35                                                                                                                                                                   17/8/12 16:45:05
RÁNKING
                                                      THE BEST BUSINESS SCHOOLS IN LATIN AMERICA


           INNOVATION
           IN OUR HEART                                                                                                        – all helped INCAE
                                                                                                                               to draw level with
                                                                                                                               Mexico’s top-ranking
                                                                                                                               business school.
                                                                                                                                  However, Incae
                                                                                                                               will have to do even
                                                                                                                               better if it wants to
                                                                                                                               match Chile’s Adolfo
                                                                                                                               Ibáñez University
                                                                                                                               (UAI) which took
                                                                                                                               first place for the
                                                                                                                               second year running.
                                                                                                         This was largely thanks to more intensive
                                                                                                         research, which was reflected in the pub-
                                                                                                         lication of 114 new papers in journals in
                                                                                                         the ISI system (against just 88 in 2010),
                                                                                                         and to the hiring of nine full-time teachers
                                                                                                         with PhD in management fields.
                                                                                                             In other moves, some high-scoring
                                                                                                         business schools swapped places on the
                                                                                                         ranking. For example, Mexico’s Egade
             In this new edition of the ranking of the best business                                     took fourth place, overtaking Brazil’s
             schools in Latin America, we have focused our                                               Fundación Getúlio Vargas (FGV),
             analysis on a key quality for any ambitious company                                         largely because the business school at
                                                                                                         Tecnológico de Monterrey eliminated
             which is often talked about but rarely implemented:                                         several of the inefficiencies created when
             innovation. AméricaEconomía Intelligence, Daniela Arce and Tamara Muñoz                     it merged its campuses in Mexico City


             P
                                                                                                         and Monterrey.
                     ositions on this ranking are pre-     push the Central American business                Egade also launched a campaign to
                     cisely calculated year by year.       school up a place, matching Mexico’s          accredit itself before the three leading
                     Each teacher and each paper           ITAM on points.                               international accreditation agencies:
                     counts, especially in the fight for       The publication of 53 ISI papers during   AACSB, Equis and AMBA. As these
             the top spots on the table. Latin America’s   2011, the signing of conventions with the     bodies act like professional perfor-
             business schools fight tooth and claw to      University of St Gallen and UCLA and          mance boosters in the European and
             improve their offer and compete in the        the improved standing in 2011 of San          US markets, this initiative is reflected
             tough market to educate Latin America’s       Jose and Managua in AméricaEconomía’s         in its Internationalization score.
             leading executives. This year, the recent     city ranking – which helped to boost the          Another interesting scrap was fought
             efforts of Incae (2°) were sufficient to      school’s Business Environment score           between Colombia’s Uniandes and


             36 AMÉRICAECONOMÍA / 2012 - 2013


MBA GI.indd 36                                                                                                                                      17/8/12 16:45:35
place your bets
             Chile’s Catholic University. This year      in which knowledge area do you want to specialize?
                                                         source: 2012 mba survey, América Economía Intelligence
             the Bogota business school won sixth
             place employing a similar strategy to                                                           None
             the other schools: more full-time teach-                          Corporate Social                     4%
             ers with PhDs, and more international                             Responsability
                                                                               5%
             conventions and accreditations, which
             allowed it to beat its Chilean rival into                                                                                          General Management
                                                                         Operations                                                                     and Strategy
             seventh position.                                          5%                                                                                     23%
                This was a tough fight in which
             every point counted and where in-               Human Resources
             novation represented a new area of             7%

             competition.
                                                         Informacion
             dirty innovation                            Tecnology
                                                         7%
             “Without innovation, there is no busi-
             ness” is a mantra endlessly repeated in
             business schools. However, these good                Economics                                                                            Finance
             intentions rarely result into anything                9%                                                                                     17%

             more than a few courses and programs
             so that directors and managers do not
             forget to include it in their power-point
             presentations. However, many now
             argue that to incorporate innovation                                     Entrepreneurship                   Marketing
                                                                                       11%                                   12%
             into company strategy, managers have
             to roll up their sleeves and get down
             to the factory floor.                       gineering and the creation of a design                     arguments with CEOs, executives, and
                 Manuel Suárez Barraza is a teacher      school focused on creating new prod-                       the board, even though their area ac-
             at Egade, who learned his trade at          ucts and services for the market,” says                    counts on average for half the budget”
             Toyota. He warns that when it comes         Alfonso Gomez, dean of the business                        says Roy Zúñiga of Incaer.
             to innovation, Latin America has not        school at UAI.                                                “Today, companies’ activities tend to
             taken up the challenge with sufficient          In Argentina, IAE is following a                       be dictated by what’s happening around
             force because the region’s business         similar path, but starting from innova-                    them. The curious thing is that they do
             schools and major companies, which          tion. “We dedicate 25% of our time to                      not realize the importance of homegrown
             largely work in industries created in       research and every teacher has a budget                    innovation,” adds Jorge Pancorvo,
             the nineteenth century, are not focused     for that,” explains Luis Dambra, direc-                    director of operations management at
             on operations. “If MBA students see         tor of the program “Leading Innovation                     Peru’s University of Piura.
             this area like a poor relative, they are    and Creativity.”                                              These outlooks are finding echo in
             never going to achieve major innova-            Or take the case of the Torcuato di                    companies. As leader of the industrial
             tions,” he says.                            Tella University. “What we are trying                      synergy community at the Colom-
                 However, there is growing aware-        to do is give our students the ability                     bian firm Nutresa and president of the
             ness among business schools about the       to think independently,” says Nicolas                      company’s services subsidiary, Carlos
             importance of innovation. Following         Stier, who has a doctorate in operations                   Gallega has been able to see close up
             some promising hi-tech start-ups, school    research from the Massachusetts Insti-                     how employees work and understand
             heads have spotted a gap in many MBA        tute of Technology (MIT).                                  that innovation in operations is key to
             courses: they teach little about what is        But to ensure that corporate innova-                   organizational success.
             needed to create Latin America’s answer     tors are not afraid of getting their hands                    “Obviously there is lot to be done,
             to Mark Zuckerberg.                         dirty, many argue that the companies                       but we must use incentives and connect
                 “That led to efforts to connect our     must place more emphasis on operations.                    high incomes to innovative ideas which
             business school with the schools of en-     “Operations managers are losing out in                     reduce costs.” n


                                                                                                                                     2012 - 2013 / AMÉRICAECONOMÍA 37


MBA GI.indd 37                                                                                                                                                         17/8/12 16:45:38
RÁNKING
                                                                    THE BEST BUSINESS SCHOOLS IN LATIN AMERICA

             Ránking latinoamericano
                                                                                                       ACADEMIC STRENGTH                                    KNOWLEDGE PRODUCTION AND DIFUSSION


                                                                                                 % OF                                                   N° OF
                                                                                  N° OF                           N° OF   % PART-TIME       N° OF ISI           N° OF                                           TO
             RK RK                                 COUN                                        FULL-TIME                               2012            PAPERS          N° OF
                                  SCHOOL                          CITY          FULL TIME                       PART-TIME TEACHERS          PAPERS              CASE                       INDEX
             12 11                                 -TRY                                        TEACHERS                               INDEX           IN OTHER         BOOKS
                                                                                TEACHERS                        TEACHERS WITH PH.D           2012              STUDIES                                         AGRE
                                                                                               WITH PH.D                                              DATABASE
                  1    1   U. A. IBÁÑEZ             CL      Santiago               48              100.0            29              34.5         93.4      114            71   143   26     94.6
                  2    3   INCAE                    CR/NI   Alajuela/Managua       40               95.0             0                 -         93.2       53            87   176   26     94.2
                  2    2   ITAM                     MX      Mexico City            54               88.9             9              77.8         96.1       52            17    10   14     90.1
                  4    4   EGADE BUSINESS SCHOOL    MX      Monterrey/Mexico       69               88.4           198              70.2         87.4      121           193    62   87     97.1
                  5    4   FGV - EAESP              BR      Sao Paulo              70               98.6             5             100.0         86.1       46           342     7   68     99.1
                  6    7   UNIANDES                 CO      Bogota                 39               84.6             7              71.4        100.0       33            29    26   48     76.4
                  7    6   PUC - CHILE              CL      Santiago               40               60.0            33              21.2         91.7       83             8    34    5     91.2
                  8   10   U. TORCUATO DI TELLA     AR      Buenos Aires           37               88.9            31              41.9         86.9      127           148    26   21     93.1
                  9    8   IAE - AUSTRAL            AR      Buenos Aires           48               70.8            30              13.3         88.4       13            50   108   25     65.3
                 10    9   U. DE CHILE (4)          CL      Santiago              113               85.8            50              50.0         88.2      213            98    20   20    100.0
                 11   11   FEA/FIA U. SÃO PAULO     BR      Sao Paulo              75               97.3            18              66.7         87.2       36           464    12   57     77.2
                 12   14   COPPEAD                  BR      Rio de Janeiro         24              100.0             3             100.0         81.8       23            53    14   16     56.1
                 13   12   IESA                     VE      Caracas                35               97.1            12              41.7         74.8       31           154    37   13     82.6
                 14   13   U. SAN ANDRÉS            AR      Buenos Aires           38               86.8            37              27.0         89.0       23           124    61   80     65.9
                 15   15   ESAN                     PE      Lima                   41               92.7           142               7.0         68.9       56            62   576   81     78.4
                 16   16   U.DEL DESARROLLO         CL      Santiago               36               69.4            54              31.5         77.1       40            22    19   25     51.1
                 17   18   U. D. PORTALES           CL      Santiago               39               66.7            24              33.3         68.3       62            40    29   26     77.2
                 18   17   UTFSM                    CL      Santiago               26               80.8            27              51.9         74.3       24            34     9    6     36.3
                 19   23   FGV – EBAPE              BR      Rio de Janeiro         26              100.0             3             100.0         53.8       43            44     0    9     54.9
                 20   25   U. DEL PACÍFICO          PE      Lima                   29               82.8            43              32.6         54.3       14            24     9   51     32.9
                 21   19   UDLAP                    MX      Puebla                 35              100.0             6             100.0         72.3        8            14     4    9     20.1
                 22   21   U. DE TALCA              CL      Talca                  30               76.7            12              33.3         64.5       29            40    16    6     42.6
                 23   22   USACH                    CL      Santiago               45               35.6            30              43.3         53.4       14             3     6    9     31.2
                 24   20   U. A. HURTADO            CL      Santiago               20               50.0            11              27.3         47.3       26            72    27   16     51.1
                 25   24   TEC. DE MONTERREY        MX      Guadalajara            47               68.1            37              56.8         53.5       14            10     5   15     30.2
                 26   34   ITESO                    MX      Guadalajara            27               66.7            26              11.5         39.7       29            17     0   15     37.9
                 27   28   U. EXTERNADO COLOMBIA    CO      Bogota                 30               90.0             7             100.0         44.8       13            55    45   32     31.3
                 28   32   U. DEL NORTE             CO      Barranquilla           29               58.6            17              41.2         47.0        5            22     4   34     20.5
                 29   26   U. DE PALERMO            AR      Buenos Aires           45               37.8            59               0.0         55.2        3             7     5   16     13.1
                 30   27   ORT                      UY      Montevideo             26               53.8            67              20.9         36.3       10            25    28   18     19.2
                 31   30   IDE                      EC      Guayaquil / Quito      15               73.3            15               6.7         33.2        1             6   116   14     15.0
                 32   31   ANÁHUAC - SUR            MX      Mexico City            13               84.6            22             100.0         40.5        3            39     0   13     19.9
                 33   33   U. ROSARIO               CO      Bogota                 34               50.0            25              24.0         31.1       18            83     3   37     41.8
                 34   29   BSP                      BR      Sao Paulo              25               40.0            60              50.0         46.9        6            20     1   40     24.1
                 35    -   U. IBEROAMERICANA        MX      Mexico City            34                8.8            41              12.2         33.5        5             1     0    8     14.2
                 36   35   EAFIT                    CO      Medellin               65               56.9            43              25.6         32.1       11            92    17   22     21.1
                 37   36   U. BELGRANO              AR      Buenos Aires           22               54.5            40              27.5         36.7       13            56     4   14     28.3
                 38    -   U. DE GUADALAJARA        MX      Guadalajara            22               54.5            12              25.0         42.1        1             0     0    2      5.4
                 39   38   ESPAE-ESPOL              EC      Guayaquil              12               58.3            16              25.0         37.4        4            16    19    9     13.9
                 40    -   UEES                     EC      Guayaquil              16               31.3            12              33.3         33.2        2             9    23   10     16.9
                 41   39   IEDE                     CL      Santiago               12              100.0            50              36.0         31.4        0             1     7   12      2.7
                 42   40   U. AMERICANA             PY      Asuncion                9               55.6            68              77.9         32.1        0             0     2    1      2.1
                 43    -   UNA                      BR      Belo Horizonte         29               79.3            33               3.0         28.7        5             7     1   10     14.2
                 44   42   U. CATÓLICA BOLIVIANA    BO      La Paz                  7               71.4            15              26.7         28.1        0             0     4    5      1.5
                 45   41   U. SAN FRANCISCO         EC      Quito                  11               63.6            13              23.1         24.3        3             1     2    5      8.7
             (1) Has simultanous double degree programs                                     (4) Faculty of Economics and Business together with Industrial Engineering
             (2) Shared with undergraduates                                                 (5) Only the EGADE Business School Monterrey has one.
             (3) Has an overseas campus                                                     IP - In Process


             38 AMÉRICAECONOMÍA / 2012 - 2013


MBA GI.indd 38                                                                                                                                                                              17/8/12 16:47:21
INTERNATIONALIZATION                                                NETWORKING                            BUSINESS
                                                                                                                         ENVIRONMENT
                                          ACCREDITATIONS
                N° OF     N° OF DOUBLE
   TOTAL N°                                                                                        GRADUATE
             AGREEMENTS      DEGREE                           RECRUITMENT HELP         ALUMNI
      OF                               AACSB EQUIS AMBA INDEX                                       SUCCESS   INDEX          INDEX       TOTAL INDEX
             WITH TOP 15 AGREEMENTS W/                              DESK             ASSOCIATION
  AGREEMENTS                                                                                         INDEX
              SCHOOLS TOP 80 SCHOOLS
       78          2             5 (1)   Yes       No        Yes    94.1   Yes          Yes (3)      74.1      98.2           92.0            94.6
       75          3                4    Yes       Yes       No     96.8   Yes          Yes (3)     100.0     100.0           77.0           94.5
       72          1                3    Yes       Yes       Yes    95.1   Yes          Yes          98.6      96.3           90.0           94.5
      122          3                5    Yes (5)   Yes (5)   Yes   100.0   Yes (2)      Yes (3)      94.2      93.6           82.5            92.2
       95          4                4    Yes       Yes       Yes    90.0   Yes          Yes          99.0      96.4          100.0            92.0
      203          3                2    Yes       Yes       Yes    87.6   Yes          Yes (3)      84.1      96.4           85.0            92.0
      140          4                2    Yes       Yes       No     85.4   Yes          Yes (3)      88.2      93.2           92.0            91.0
      106          3                2    No        No        Yes    74.3   Yes          Yes          78.9      93.2           86.0            87.5
       24          3             1 (1)   Yes       Yes       Yes    80.9   Yes          Yes (3)      80.0      99.2           86.0            84.7
       50          0             4 (1)   IP        No        Yes    68.9   Yes          Yes (3)      71.2      71.2           92.0            84.5
       21          2                0    No        No        Yes    68.4   Yes          Yes          72.0      94.0          100.0            84.4
       46          2                0    No        Yes       No     78.5   Yes          Yes          95.5      98.5           87.0            79.8
       59          1                2    Yes       Yes       Yes    87.3   Yes          Yes (3)      63.2      87.2           55.0            79.7
       41          2                0    No        No        Yes    59.9   Yes          Yes          70.9      86.6           86.0            79.4
      123          4                2    IP        IP        Yes    67.9   Yes          Yes (3)      58.9      88.3           83.0            75.2
       50          2                2    IP        No        Yes    66.8   Yes          Yes          72.9      88.2           92.0            73.3
      122          2                0    No        No        IP     50.1   Yes          Yes (3)      54.2      67.4           92.0            68.4
       92          0                0    No        No        Yes    61.1   Yes (2)      Yes          77.2      80.1           92.0            66.8
       39          0                0    IP        IP        No     33.3   Yes          Yes          78.9      86.9           87.0            59.2
       97          2                2    Yes       No        Yes    86.1   Yes (2)      Yes          78.9      67.9           83.0            58.9
       12          0                0    IP        No        IP     59.3   Yes (2)      No           78.4      68.0           70.0            58.9
       27          1                1    No        No        IP     38.0   Yes (2)      Yes          52.0      56.6           73.5            55.0
       99          0                0    No        No        No     58.0   Yes (2)      Yes          61.2      68.6           92.0            54.6
       16          0                1    No        No        IP     39.1   Yes (2)      Yes (3)      61.9      67.5           92.0            53.1
       51          1                2    No        No        No     50.2   Yes (2)      Yes (3)      41.2      59.9           70.0            50.5
       78          0                0    No        No        No     49.4   Yes (2)      Yes          69.4      67.1           70.0            47.8
       29          1                0    No        No        IP     41.9   Yes (2)      Yes (3)      44.4      59.7           85.0            47.5
       72          0                1    No        IP        IP     58.9   Yes (2)      Yes (3)      60.3      71.5           60.0            47.1
       10          0                0    No        No        IP     26.0   Yes          Yes (3)      50.0      61.3           86.0            45.2
       75          0                1    No        No        IP     53.7   Yes (2)      Yes          68.9      70.1           80.0            44.4
       22          1                1    No        No        IP     45.7   Yes          Yes          88.9      91.2           60.0            44.4
       17          1                0    No        No        No     41.0   Yes          Yes          56.3      65.2           90.0            43.9
       35          0                1    No        IP        No     60.1   Yes (2)      Yes          37.4      47.6           85.0            43.6
       17          1                0    No        No        IP     27.4   Yes (2)      Yes          43.3      52.3          100.0            43.2
        4          0                0    IP        No        No     28.9   Yes          Yes          87.9      88.1           90.0            42.7
       84          0                1    No        No        IP     60.3   Yes          Yes          63.0      65.2           70.0            42.6
        8          0                1    No        No        IP     35.6   Yes (2)      Yes          64.2      62.1           86.0            42.4
       11          0                0    No        No        No     31.1   Yes (2)      No           80.1      80.4           70.0            42.2
       11          0                0    IP        No        No     35.0   Yes          Yes          70.0      59.4           60.0            37.9
       30          0                0    No        No        No     32.2   Yes          Yes          65.4      66.7           60.0            37.8
        5          1                0    No        No        IP     34.1   Yes          Yes          36.3      58.3           92.0            34.5
       99          0                2    IP        IP        No     49.6   Yes (2)      Yes          58.2      52.1           60.0            34.1
        1          0                0    No        No        No      4.1   Yes          Yes          41.1      42.3           73.0            27.0
        1          1                0    No        No        No     19.0   No           No           68.3      39.9           55.0            25.1
        7          0                0    No        No        IP      9.3   Yes (2)      Yes          37.9      39.9           60.0            23.8


                                                                                                                      2012 - 2013 / AMÉRICAECONOMÍA 39


MBA GI.indd 39                                                                                                                                         17/8/12 16:47:28
RÁNKING
                                                  THE BEST BUSINESS SCHOOLS IN LATIN AMERICA


                                                                                                 market to provide a huge quality of
                                                                                                 data.
                                                                                                     The result is a detailed analysis of
                                                                                                 33 schools which provided sufficient
                                                                                                 information to answer the big questions
                                                                                                 on a range of issues which are critical
                                                                                                 when taking one of the biggest deci-
                                                                                                 sions in an executive’s career.
                                                                                                     While this ranking is not complete,
                                                                                                 as a number of leading and renowned
                                                                                                 business schools did not provide data,
                                                                                                 the three which have traditionally led
                                                                                                 the ranking did: Harvard, Stanford and
                                                                                                 London Business School, which again
                                                                                                 took the top three positions in the rank-
                                                                                                 ing, together with thirty of their leading
                                                                                                 competitors. They all competed in the
                                                                                                 ranking’s different fields, which seek to
                                                                                                 calibrate each business school’s academic
                                                                                                 and economic qualities, together with its
                                                                                                 networking potential and prestige within
                                                                                                 Latin America.
                                                                                                     In the heavyweight category, Harvard
                                                                                                 is the undisputed champion, given that
                                                                                                 – among other indicators – 98% of the


           MISSION
                                                                                                 schools’ teachers are employed full-time,
                                                                                                 have PhDs and carry out intensive research
                                                                                                 into management fields, which results in
                                                                                                 hundreds of papers published in journals
                                                                                                 which are indexed in the ISI database.
                                                                                                 On the opposite side of the classroom,


           LATIN AMERICA
                                                                                                 so to speak, Harvard is also on top with
                                                                                                 the highest criteria for selecting students.
                                                                                                 During the last academic year, its new
                                                                                                 intake consisted of 905 students with an
             Thirty-three leading business schools from around                                   average GMAT score of 724. The next
             the world opened up their books to let us assess the                                highest was Stanford with 803 students
             quality of their academic products, their costs and                                 with an average score of 730.
                                                                                                     The world’s most famous business
             how attractive they are to Latin American students.                                 school is also the most famous in Latin
             AméricaEconomía Intelligence, Andrés Almeida                                        America. That can be seen in its Prestige


             F
                                                                                                 indicators which helped Harvard score
                    ancy travelling outside of Latin      Because this year AméricaEconomía      the highest mark in this field. In a survey
                    America to study an MBA? If        Intelligence decided to strengthen the    of readers of AméricaEconomía – Latin
                    the exchange rates and your        methodology for its traditional ranking   American executives on high incomes
                    sense of adventure tempt you to    of the world’s best business schools      – practically all of them mentioned this
             say yes, or if it is something you have   for Latin Americans, asking business      school as one of the three best-regarded
             always dreamt about, then this article    schools from around the world, which      schools in the region.
             is for you.                               are interested in the Latin American          This, in addition to its strong showing


             40 AMÉRICAECONOMÍA / 2012 - 2013


MBA GI.indd 40                                                                                                                                  17/8/12 16:47:35
on balance
             price/quality ratio, based on monthly cost of mba program (in US$) and final ranking index
             source: AméricaEconomía Intelligence
                  US$                                                                                                                                                                                                                                                                                                                                    Ptje. RK 2012
                  12,000                                                                                                                                                                                                                                                                                                                                            90

                                                                                                                                                                                                                                                                                                                                                                      80
                  10,000
                                                                                                                                                                                                                                                                                                                                                                      70

                   8,000                                                                                                                                                                                                                                                                                                                                              60

                                                                                                                                                                                                                                                                                                                                                                      50
                   6,000
                                                                                                                                                                                                                                                                                                                                                                      40

                   4,000                                                                                                                                                                                                                                                                                                                                              30

                                                                                                                                                                                                                                                                                                                                                                      20
                   2,000
                                                                                                                                                                                                                                                                                                                                                                      10


                       -
                            Harvard


                                                 London


                                                                 Haas
                                                                        IE


                                                                                     HEC Paris
                                                                                                 Kellogg
                                                                                                           IMD
                                                                                                                 Tuck
                                                                                                                        Desaultes
                                                                                                                                    Mannheim
                                                                                                                                               HEC Montréal
                                                                                                                                                              Bath
                                                                                                                                                                     Cranfield
                                                                                                                                                                                 Kenan- Flagler
                                                                                                                                                                                                  Owen
                                                                                                                                                                                                         MacDonough
                                                                                                                                                                                                                      MacCombs
                                                                                                                                                                                                                                 Warwick


                                                                                                                                                                                                                                                  Mendoza
                                                                                                                                                                                                                                                            Miami University
                                                                                                                                                                                                                                                                               Simon
                                                                                                                                                                                                                                                                                       Katz
                                                                                                                                                                                                                                                                                              Weatherhead
                                                                                                                                                                                                                                                                                                            HHL-Leipzig
                                                                                                                                                                                                                                                                                                                          Boston
                                                                                                                                                                                                                                                                                                                                   Grenoble
                                                                                                                                                                                                                                                                                                                                              Chapman
                                                                                                                                                                                                                                                                                                                                                        Gisma
                                                                                                                                                                                                                                                                                                                                                                Cox
                                                          Iese


                                                                                                                                                                                                                                           Esic
                                                                             Esade
                                      Stanfrod


                 Monthly cost                Position in 2012 ranking

             in a number of international rankings,                                                                a month, studying at a counterpart in                                                                                                                       ies one’s MBA, but also the career
             gave it a significant advantage over its                                                              the United States cost an average of                                                                                                                        one pursues after graduation. To put it
             main rival: Stanford.                                                                                 US$4,628 a month.                                                                                                                                           another way, the incomes of business
                                                                                                                       Another interesting case is that of the                                                                                                                 school graduates depend on which wall
             Education costs                                                                                       Canadian schools which achieved a better                                                                                                                    they choose to hang their academic
             (and pays)                                                                                            relationship between quality, measured                                                                                                                      certificates. And these walls are often
             Of course, the academic quality and good                                                              by their position on the ranking, and the                                                                                                                   in Latin America.
             reputation of these business schools is                                                               monthly cost of their full-time MBA
             nothing new. And quality costs. So the                                                                programs. For example, HEC-Montréal                                                                                                                         L.A. stands for
             methodology for this ranking included                                                                 (14th) costs US$ 2,583 a month and                                                                                                                          Latin America
             a cost/benefit dimension which sought                                                                 achieved a final score on the ranking                                                                                                                       According to a Financial Times study
             to analyze the decision to study in this                                                              of 57.11 points, while Desautels, which                                                                                                                     from 2011, the overwhelming majority
             or that school as if it were an investment                                                            costs a little more (US$3,250), achieved                                                                                                                    of Latin Americans who complete an
             (which it is). So we added variables to                                                               a slightly higher score (59.33).                                                                                                                            MBA at one of the schools on its ranking
             the methodology which measure the total                                                                   More interesting facts? Did you know                                                                                                                    of fifty leading business schools return
             and monthly cost of a full-time MBA,                                                                  that graduates from these 33 schools                                                                                                                        to their home countries after graduat-
             living costs in the campus city, average                                                              earned an average salary of US$ 97,355,                                                                                                                     ing. For most of them, the region is still
             monthly salary upon graduation, the in-                                                               implying an average increase in income                                                                                                                      their principal labor market.
             crease in income between entering and                                                                 of 77% between entering and graduating?                                                                                                                         That explains why each school’s
             graduating from a school, and scholar-                                                                Of course, averages can be misleading.                                                                                                                      Power Network in Latin America is
             ships and other financial help.                                                                       The average salary of graduates from                                                                                                                        so important.
                 The UK’s University of Bath (15th)                                                                the best schools can often double those                                                                                                                         The ranking analyzes this aspect
             achieved the highest marks. It’s no ac-                                                               of graduates from schools lower down                                                                                                                        by examining a series of variables
             cident that a European school won here.                                                               the table.                                                                                                                                                  which measure the networks of power
             While studying at a European business                                                                     Statistical averages aside, salary                                                                                                                      which these schools have developed
             school costs an average of US$4,230                                                                   depends not only on where one stud-                                                                                                                         in the region.


                                                                                                                                                                                                                                                                                                                2012 - 2013 / AMÉRICAECONOMÍA 41


MBA GI.indd 41                                                                                                                                                                                                                                                                                                                                                             17/8/12 16:47:41
RÁNKING
                                                                       THE BEST BUSINESS SCHOOLS IN LATIN AMERICA

             Internacional ranking
                                                                                                                                                                                  Key Indicators 2011

              RK                                                                                                                                                                          Total Cost
                                           School                                      University           Country          Nº of                              N° of Students                                 D
             2012                                                                                                                       % of Full-   N° of                       GMAT    of Full-Time
                                                                                                                           Full- Time                            for every ten
                                                                                                                                      Time con PhD Students *                  Average * MBA program
                                                                                                                           Teachers                             candidates *
                                                                                                                                                                                             (US$)

                 1    Harvard Business School                               Harvard                        United States     194          98.0        905           8.9          724       87,200
                 2    Stanford Graduate School of Business                  Stanford                       United States     112          96.0        803           8.5          730       114,600
                 3    London Business School                                -                              UK                 98          99.0        404          N.A.          701       92,856
                  4   IESE Business School                                  Navarra                        Spain              70         100.0        270           6.3          678       85,879
                  5   Haas School of Business                               California, Berkeley           United States      77         100.0        236           5.6          715       106,792
                  6   IE Business School                                    IE                             Spain             101          95.0        400           5.1          680       79,721
                  7   ESADE Business School                                 -                              Spain              75          88.0        180           5.7          670       76,950
                  8   HEC Paris                                             -                              France            115          99.0        233           6.5          690       62,570
                  9   Kellogg School of Management                          Northwestern                   United States     182          94.0        623           5.7          712       162,458
                 10   IMD                                                   -                              Switzerland        42         100.0         90           1.1          670       92,900
                 11   Tuck School of Business                               Dartmouth                      United States      44         100.0        267           5.4          718       56,555
                 12   Desautels Faculty of Management                       McGill                         Canada             80          96.0         58           6.1          661       65,000
                 13   Mannheim Business School                              Mannheim                       Germany            86         100.0         53           8.0          672       43,150
                 14   HEC Montréal                                          Montréal                       Canada             66          75.8         80           7.5          637       31,000
                 15   School of Management - Bath                           Bath                           UK                 79          91.0         59           5.5          640       35,400
                 16   Cranfield School of Management                         Cranfield                       UK                 92          82.0         84           4.6          680       52,000
                 17   Kenan-Flagler Business School                         North Carolina, Chapel Hill    United States     111          90.0        288           4.8          689       96,829
                 18   Owen Graduate School of Management                    Vanderbilt                     United States      39         100.0        162          N.A.          695       89,560
                 19   McDonough School of Business                          Georgetown                     United States      53          87.0        253           3.9          690       99,276
                 20   McCombs School of Business                            Texas, Austin                  United States      73          96.0        263           4.6          692       94,972
                 21   Warwick Business School                               Warwick                        UK                154          92.0         55           3.6          648       47,600
                 22   Esic                                                  -                              Spain              12         100.0         40           9.3          670       34,590
                 23   Mendoza College of Business                           Notre Dame                     United States      65          92.3        130           4.4          692       60,620
                 24   School of Business Administration- UM                 Miami                          United States     135          81.0         98           5.1          636       80,120
                 25   Simon Graduate School of Business                     Rochester                      United States      59          85.0        318           3.2          675       92,820
                 26   Katz Graduate School of Business                      Pittsburgh                     United States      48          94.0        108           4.8          612       56,192
                 27   Weatherhead School of Management                      Case Western Reserve           United States      69          91.0         60           3.2          633       87,740
                 28   HHL - Leipzig Graduate School of Management           -                              Germany             9         100.0         65           4.6          620       38,130
                 29   School of Management -Boston                          Boston                         United States      63          79.4        151           3.8          684       82,732
                 30   Grenoble Graduate School of Business                  Grenoble Ecole de Management   France             22          78.0         44           8.8          N,A,      36,000
                 31   Chapman Graduate School of Business                   Florida International          United States      19         100.0         85           5.1          555       39,000
                 32   Gisma Business School                                 Leibniz, Hannover              Germany            32         100.0         42           7.0          620       39,000
                 33   Cox School of Business                                Southern Methodist             United States      88         100.0        126           1.8          641       91,616
             * = Last recorded year • N.A. = Not Available/Not Applicable
                                                                                                                                            a network of contacts that crisscross the
                 These include the number and propor-                            90% of the students are foreigners, of                     region and link continents. To analyze
             tion of Latin Americans in the student                              whom 13% are Latin Americans. The                          the strength of these networks, the mea-
             body as a whole and the foreign student                             ranking also looks at the diversity of Latin               sure takes into account the institutional
             body. On average, more than half of the                             American nationalities in the classroom                    links between these schools and their
             students at the thirty-three schools included                       in order to measure the breadth of each                    counterparts in Latin America, through
             in the ranking are foreigners, while 18%                            school’s Latin network. Here the list is                   academic conventions and exchanges,
             come from Latin America. One notable                                headed by IE and Esic, which included                      as well as the relations they maintain
             school is IE (6th), where 89% of its stu-                           first-year students from sixteen and                       with major companies from the region.
             dents are foreigners and, of these, 29%                             twelve countries, respectively.                            IESE (4th) offers an interesting case of
             are Latin Americans. Another interesting                                After graduation, these small Latin                    a school with strong links with some of
             case is London Business School, where                               American expat communities will become                     Latin America’s biggest companies,


             42 AMÉRICAECONOMÍA / 2012 - 2013


MBA GI.indd 42                                                                                                                                                                              17/8/12 16:47:47
Prestige

                                 Average                 Latin Ameri- Latin Americans                 Power of                        2012
         Duration of Full-Time                                                               Selec-                                                        website          RK 2012
                                 graduate   % increase cans as % of as % of total Academic            network      Cost/             Index
           MBA program (in                                                                  tivity of                    Prestige
m                                 salary     in salary total number of number of fo- weight            in Latin   benefit
               months)                                                                      students
                                  (US$)                    students    regn students                  America

                     9           120,000       N.A.         3.5          10.4        100.0     100.0      43.2     46.2   100.0      83.26   hbs.edu                           1
                   18            127,189       N.A.         6.5          20.8         76.8      98.0      54.7     45.5    84.3      76.06   gsb.stanford.edu                  2
                   21            121,206       72.5        12.1          13.5         74.9      91.8      55.1     52.7    76.8      73.33   london.edu                        3
                   19            121,361       N.A.        16.3          20.4         64.5      89.6      75.6     61.2    54.0      70.56   iese.edu                          4
                   21            114,232       72.2         9.3          22.2         76.4      91.9      71.3     51.7    42.2      69.95   haas.berkeley.edu                 5
                   13               N.A.       N.A.        26.0          29.2         54.8      87.8     100.0     55.8    38.0      68.84   ie.edu                            6
                   15            105,648     115.3         18.3          22.0         71.4      85.8      86.5     60.3    29.3      68.48   esade.edu                         7
                   16            109,000       N.A.        10.7          12.7         66.4      91.1      56.9     75.4    21.7      62.60   hec.edu                           8
                   22            111,928       52.0         6.6          18.4         72.5      91.5      56.5     39.9    31.0      62.51   kellogg.northwestern.edu          9
                   11            129,600       66.2        11.1          11.2         58.5      80.4      56.3     47.0    47.1      60.12   imd.org                          10
                   21            115,143       61.7         5.2          14.1         55.5      89.7      33.1     72.2    46.0      59.34   tuck.edu                         11
                   20               N.A.       N.A.         6.9           9.1         79.0      83.6      52.7     67.6     6.8      59.33   mcgill.cadesautelsmba            12
                   12            121,000      100.0        13.2          17.9         83.6      83.8      17.7     92.3    14.7      57.55   mannheim-business-school.com     13
                   12             75,713       34.4        10.0          21.6         73.5      83.8      37.6     90.8     5.9      57.11   hec.ca                           14
                   12               N.A.       N.A.         6.8           7.1         67.0      80.9      32.4    100.0    17.9      57.03   bathmba.com                      15
                   12            104,000     160.0         11.9          15.2         59.4      82.9      43.2     78.2    18.8      55.79   cranfieldMBA.info                 16
                   21             99,628       53.4         2.4           8.1         73.4      86.0      37.1     48.9    12.6      54.71   kenan-flagler.unc.edu             17
                   21             91,653       N.A.         7.0          35.4         63.9      93.0      31.6     60.2    13.0      54.16   owen.vanderbilt.edu              18
                   21             97,297       84.9         5.5          12.7         54.9      84.7      50.6     50.7    20.2      54.14   msb.georgetown.edu               19
                   21            101,412       55.9         4.6          19.0         62.8      84.1      45.6     51.1    14.9      53.93   mccombs.utexas.edu               20
                   12             86,000       71.0         3.6           4.0         89.4      74.3      15.1     69.0    13.1      53.45   wbs.ac.uk                        21
                   11             90,000     157.1         62.5          86.2         32.1      87.6      62.0     94.5     5.2      52.85   esic.edu                         22
                   22             93,175       74.1         1.5           7.7         66.3      79.6      30.1     72.0    11.4      51.98   business.nd.edu                  23
                   21             73,246       50.8         5.1          16.7         55.6      81.8      53.0     53.8     7.1      51.77   bus.miami.edu                    24
                   22             75,686       N.A.         1.9           3.5         69.7      84.2      25.4     55.4    13.1      51.73   simon.rochester.edu              25
                   20             71,328       73.6         3.7           9.1         58.4      79.2      33.8     68.6     5.4      49.11   business.pitt.edu                26
                   20             77,440       99.5         1.7           2.9         62.5      78.3      22.7     57.8    11.3      47.79   weatherhead.case.edu             27
                   18             94,700       41.1        13.8          21.4         31.4      79.5      40.9     97.6     7.2      47.11   hhl.de                           28
                   21             87,066       N.A.         4.6          13.0         55.1      77.8      24.7     55.6    14.0      46.53   management.bu.edu                29
                   12            100,320       69.5        31.8          31.8         65.0      30.6      55.5     94.7     7.5      45.97   grenoble-em.com                  30
                   12             48,200       60.7        16.5          35.0         39.1      70.4      44.7     77.8     7.5      45.62   business.fiu.edu                  31
                    11            73,000       62.2         7.1           9.7         48.9      77.4      12.1     86.6    11.8      45.02   gisma.com                        32
                   22             84,465       58.8         3.2          17.4         56.1      74.8      24.0     55.0     6.1      44.23   coxgrad,com                      33

                   including Itau, Taca and LAN.                          ers of MercadoLibre, Marcos Galperin                    who has been director of ESADE’s
                       The study also measured the alumni                 and Hernan Kaza, who graduated from                     CEAL Center of European and Latin
                   networks, to which current students                    Stanford in 1999, as well as Alejandro                  American Studies (7th) or Frank Hoff-
                   can turn to upon graduation, not only                  Vollbrechthausen, president of Goldman                  man, who works at HHL-Leipzig (28th)
                   in terms of their size and diversity, but              Sachs Brazil, who graduated from Kellogg                and is director of international relations
                   also their success. The global business                (9th) in 1995, to mention just three.                   at the Latin American Council of Busi-
                   schools were asked to name their five                     We should also mention the teachers.                 ness Schools (Cladea). This is a key
                   most successful Latin American gradu-                  The ranking also counts the number of                   factor if one assumes that their presence
                   ates: many are founders, chief executives              teachers, Latin American or otherwise,                  ensures that the content imparted in the
                   and directors of leading global and Latin              who maintain strong professional or                     classroom is relevant to Latin America
                   American companies. These notable                      research links with the region.                         and that the region is considered worthy
                   alumni include, for example, the found-                   Take, for example, Agustin Ulied,                    of study. ■


                                                                                                                                               2012 - 2013 / AMÉRICAECONOMÍA 43


    MBA GI.indd 43                                                                                                                                                                    17/8/12 16:47:53
RANKING
LATIN AMERICA´S
  MOST GLOBALIZED
        COMPANIES

                                                                                                     from US$668.974 billion.
                                                                                                         Another example of a sustained in-
                                                                                                     ternational offense was Brazil’s WEG.
                                                                                                     Last November, it acquired Austria’s
                                                                                                     Watt Drive Antriebstechnik, an energy
                                                                                                     supply company with operations across
                                                                                                     Europe and industrial plants in Germany
                                                                                                     and Singapore. That same month it signed
                                                                                                     a deal with GE Energy to buy US-based
                                                                                                     EM (Electric Machinery), which builds
                                                                                                     motors and generators for the oil and gas
                                                                                                     industry. The deal means WEG now has
                                                                                                     operations in South Africa, Argentina,
                                                                                                     Austria, China, the United States, India,
                                                                                                     Mexico and Portugal. It is also present
                                                                                                     in sixteen other countries. Like Sigdo
                                                                                                     Koppers, its executives saw the crisis
                                                                                                     in Europe and the US as an excellent

            AGAINST WIND                                                                             strategic opportunity to buy valuable
                                                                                                     assets at knockdown prices. Stories


            AND TIDE
                                                                                                     like those of Sigdo Koppers and WEG
                                                                                                     sum up a key moment in the history
                                                                                                     of Latin American business. This is a
                                                                                                     new phase of globalization where trade
             Despite the uncertainties of 2011, the multilatinas                                     disputes between countries coexist with
             continued to expand. Although prudence was the order                                    the need to maintain investment levels
                                                                                                     and gross capital formation in order to
             of the day, Latin America’s most globalized companies
                                                                                                     create jobs.
             did not swerve from their strategies to conquer                                             When this article went to print, these
             markets beyond their borders.                                                           success stories did not include the immi-
             Andrés Almeida, AméricaEconomía Intelligence                                            nent merger of LAN and TAM which has


            G
                                                                                                     been delayed for legal reasons, meaning
                    reece was a drama bordering on       ranking for the first time, in fifteenth    that there are no reliable figures to esti-
                    tragedy. The United States is no     place. Through its acquisition of Mag-      mate the real level of internationalization
                    longer a speedy Mustang con-         otteaux, the company is now present in      at the new Latin American air giant (see
                    vertible, but a beat-up pick-up      25 countries and eight different regions.   note on page 44).
            sadly trundling down the lost highway.       Previously, Sigdo Koppers was focused           AméricaEconomía’s Multilatinas
            Meanwhile, China is threatening to curb      on mine engineering in Chile and main-      ranking measures a number of indicators
            its hitherto insatiable appetite for raw     tained a minor presence in some other       on internationalization. For example,
            materials. For the major trade blocs, 2011   countries in South America.                 which companies made the biggest
            was a year of worrying signs.                    Clearly the muiltilatinas have not      proportion of their investments abroad?
                But, where some see risk, others see     been intimidated by the Mayan proph-        That list was led by Colombia’s ISA with
            opportunities. That was the case of Sigdo    ecies for 2012. The sixty-five compa-       an astounding 92%, followed by three
            Koppers, a Chilean company which last        nies on the 2012 Ranking maintained         Argentinean companies: Laboratorios
            year made the audacious move of acquir-      their proportion of foreign investment      Bagó, Tenaris and IMPSA.
            ing for US$790 million the Belgian firm      at around 38%, similar to the level re-         Meanwhile, there are other compa-
            Magotteaux, which has operations on five     corded in last year’s ranking. And this     nies which achieve equally high levels
            continents. This deal put Sigdo Koppers      year they did even better, racking up       of sales outside their domestic market,
            onto AméricaEconomía’s Multilatinas          sales totaling US$710.228 billion, up       such as Mexico’s Telmex, Venezuelan


             44 AMÉRICAECONOMÍA / 2012 - 2013


MULTILATINAS GI.indd 44                                                                                                                            17/8/12 16:48:45
RANKING
                                                                                                                                        LATIN AMERICA´S
                                                                                                                            MOST GLOBALIZED
                                                                                                                                                 COMPANIES

             oil giant PDVSA or Chilean shipping           PROTEIN AND BITS
                                                           NUMBER OF MULTILATINAS AND AVERAGE SALES, BY SECTOR
             firm CSAV. But the real global employ-        SOURCE: AMÉRICAECONOMÍA INTELLIGENCE
             ers are Telmex, Bolivia’s Brightstar and          90.0                                                                                                                                      10
                                                                                                                                                           Sales in billions of US$ $2011
             Chilean software and IT firm Sonda                         9                                                                                   Nº of companies
                                                               80.0                                                                                                                                       9
             which have the largest foreign work-
                                                               70.0 79.1
             forces on the list.                                                                                                                                                                          8

                                                               60.0                                                                                                                         59.4
                                                                                                                                                                                                          7
             THE PROTEIN EMPIRE
                                                               50.0                                                                                                                                       6
             WEG and Sigdo Koppers are both
                                                                                           5
             industrial companies. Others such as              40.0
                                                                                                                                                                                                          5

             Argentina’s Tenaris and Grupo Mexico                                        33.2               4                       4                  4
                                                                                                                                                                                                          4
             achieved high positions on the ranking            30.0
                                                                                                                                                                          3                  3
                                                                                                                                  23.2                                                                    3
             and had a strong presence in Europe                                                                                                     21.3
                                                               20.0                                        17.4
             even before the crisis.                                                                                                                                                                      2

                 But this year a food company has taken        10.0
                                                                                                                                                                                                          1
             first place in the ranking, Brazil’s Grupo                                                                                                                  1.9
             JBS-Fribois, which just crept past cell-             0
                                                                        Foods            Retail            Airlines
                                                                                                                                  Beverages
                                                                                                                                                     Cement            Technology        Telecoms
                                                                                                                                                                                                          0

             phone supplier Brightstar in large part
             due to its larger growth potential and the    MAPA MUNDI
             fact that it has the highest proportion of    COMPANIES WITH THE GREATEST GEOGRAPHICAL COVERAGE IN 2011
                                                           SOURCE: AMÉRICAECONOMÍA INTELLIGENCE
             foreign sales of all the multilatinas. JBS      60                                                                                                                                         105.0
             is an interesting case as it demonstrates                                                                                                                                Nº of countries
                                                                      100.0      99.8          98.2                                                                                   Nº of regions
             the risks and difficulties implied by rapid     50
                                                                                                                                                                                       Coverage Index
                                                                                                                                                                                                        100.0
                                                                  50            49
             growth. JBS’s story is an impressive one.                                                     94.5
                                                             40                            36                              92.4                                                                          95.0
             From a small abattoir in Anapolis in Goias                                                                             34
             state it became, in just over five decades,                                                              39                                                  29           30
                                                             30                                                                          89.6        89.4                                                90.0
                                                                                                      27                                                        87.6
             the world’s largest supplier of protein.                                                                                                                          86.3
                                                                                                                                                                                              8.,0
                                                                                                                                                27
             “The company took much larger posi-             20                                                                                               26                                         85.0

             tions over a short period of time,” says                    8           8            8                          9                                                   9
                                                             10                                                                                                                                          80.0
                                                                                                                                          7            7             7                        7
             Iberville D’Athay de Neto, an analyst at                                                        5

             Brazilian consultancy Scot Consultoría.          0                                                                                                                                          75.0
                                                                  Brightstar     Weg        Cemex     Brasil           Vale           Const. Bematech    Dhb      Petrobras   Viña
             Their foreign forays include acquisitions              (BO)         (BR)        (MX)     Foods            (BR)          Norberto  (BR)     Comp.       (BR)    Concha y
                                                                                                       (BR)                         Odebrecht         Automotivos           Toro (CL)
             of the US firms Swift Foods and Pilgrim`s                                                                                 (BR)              (BR)
             Pride. Today JBS produces abroad and
             has diversified from beef, its traditional       José Yordan and Rebecha Sánchez                                            Ibovespa as a whole.
             product, into pork and poultry.               Sarmiento wrote a report for Deutsche                                             This year the company is expected
                 But JBS has paid a high price for be-     Bank where they noted that “inves-                                            to concentrate on realizing operational
             coming an icon of globalization among         tors have historically not liked the                                          synergies and improving its cash-flow.
             Brazilian companies. It owes more             company” and that it suffers from “a                                          To help in the task it has hired a heavy-
             than US$6 billion and it has struggled        long list of concerns.” As well as its                                        weight executive: Henrique Meirelles,
             to realize synergies between its recent       high level of indebtedness and the low                                        a former chairman of Brazil’s Central
             acquisitions.                                 margins at some of its foreign units,                                         Bank. His considerable experience in
                 For example, analysts say the acqui-      they point to the lack of corporate                                           the financial sector should help manage-
             sition of US poultry producer Pilgrim’s       governance mechanisms to explain                                              ment to get a handle on its swollen debts
             has proved to be a headache for JBS           JBS’s poor performance on the stock                                           and develop the corporate governance
             after profitability slumped. Last year        market. Since it first listed its shares                                      of the quality required in a company of
             the company posted losses totaling            in 2007, the company has quintupled                                           this size and global reach. ■
             US$345 million and got poor marks             in size but its share price has risen by
             from the market.                              barely 5%, compared with 50% for the                                               With Natalia Gómez in São Paulo


                                                                                                                                                             2012 - 2013 / AMÉRICAECONOMÍA 45


MULTILATINAS GI.indd 45                                                                                                                                                                                    17/8/12 16:48:49
RANKING
LATIN AMERICA´S
  MOST GLOBALIZED
        COMPANIES
                                                                                                                                                           KEY FIGURES 2011
                                                         RK RK                               HOME
                                                                              COMPANY                              SECTOR             SALES    VAR. IN SALES                  PROFITS                      N°
                                                         12 11                              COUNTRY                                                          WORKFORCE
                                                                                                                                   US$ MILLIONS 11-10 %                       MM US$                       U
                                                          1    2   GRUPO JBS - FRIBOI       BR        FOODS                          32,944.0       -0.3       128,036          -345.4
                                                          2    1   BRIGHTSTAR (1)           BO        TELECOMMUNICATIONS              4,700.0       13.8         3,750            N.A.
                                                          3    5   LAN                      CL        AIRLINES                        5,718.2       30.3        21,838           320.2
                                                          4    3   CEMEX                    MX        CEMENT                         13,546.2       -6.2        46,500        -1,371.3
                                                          5    4   TENARIS                  AR        STEEL                           9,972.5       29.3        25,422         1,331.2
                                                          6    6   TELMEX                   MX        TELECOMMUNICATIONS              7,057.0      -13.2        19,026         1,045.5
                                                          7    7   GRUPO ALFA               MX        AUTOPARTS/PETROCHEMICALS       13,053.1       18.2        56,978           373.2
                                                          8    9   VALE                     BR        MINING                         55,014.1       10.1        70,785        20,158.7
                                                          9   11   GERDAU                   BR        STEEL                          18,875.6        0.2        50,000         1,069.3
                                                         10   12   AJEGROUP (1)             PE        BEVERAGES                       1,450.0       28.7        10,000            N.A.
                                                         11    8   IMPSA                    AR        ELECTRICITY                     1,066.9       35.2         3,108            N.A.
                                                         12   10   CONST. N. ODEBRECHT      BR        ENGINEERING                    32,325.0       38.5        89,500            N.A.
                                                         13   13   GRUPO BIMBO              MX        FOODS                          10,462.8       10.3       126,747           382.1
                                                         14   16   LABORATORIOS BAGÓ        AR        PHARMACEUTICALS                 1,012.0       54.6         6,500            N.A.
                                                         15    -   SIGDO KOPPERS (1)        CL        CONSTRUCTION & ENGINEERING      2,016.9        9.9        20,334           334.8
                                                         16   17   AMÉRICA MÓVIL            MX        TELECOMMUNICATIONS             47,689.6       -3.1        56,500         5,923.7
                                                         17   14   PETROBRAS                BR        OIL                           130,171.7        1.7        80,492        17,759.4
                                                         18    -   ISA (INTERCONEX ELEC)    CO        POWER TRANSMISSION              2,240.3       27.8         3,435           168.0
                                                         19   19   GRUPO CASA SABA (FASA)   MX        RETAIL                          4,670.0       13.9        11,758            N.A.
                                                         20   20   MARFRIG                  BR        FOODS                          11,548.8       48.3        96,000          -243.9
                                                         21   15   AVIANCA – TACA           CO/SV     AIRLINES                        3,279.4        9.3         6,950            N.A.
                                                         22   18   GRUPO NUTRESA            CO        FOODS                           2,736.4       23.0        29,679           186.1
                                                         23   21   CSAV                     CL        SHIPPING                        5,151.9       -5.4         9,749        -1,249.8
                                                         24   24   INTEROCEÁNICA            CL        SHIPPING                          879.9        7.1         3,251           -39.9
                                                         25   26   MEXICHEM                 MX        PETROCHEMICALS                  3,415.8       15.6        10,000           197.5
                                                         26   24   BRASIL FOODS             BR        FOODS                          13,485.5        5.8       127,982         1,155.2
                                                         27   32   FIBRIA                   BR        PULP                            3,121.0      -17.2        16,956          -462.2
                                                         28   23   INTERCEMENT *            BR        CEMENT                          1,325.3       N.A.         4,700            N.A.
                                                         29   22   CENCOSUD                 CL        RETAIL                         13,971.2       18.2       126,530           744.9
                                                         30   34   WEG                      BR        MACHINERY                       2,766.5        5.2        19,406           312.9
                                                         31   28   SONDA                    CL        TECHNOLOGY                      1,136.8       19.4        10,882            77.9
                                                         32   31   ARAUCO                   CL        FORESTRY/PULP                   4,451.4       17.5        35,704           620.8
                                                         33   29   GRUMA                    MX        FOODS                           4,104.4        9.1        21,318           377.9
                                                         34   27   VIÑA CONCHA Y TORO       CL        BEVERAGES                         770.1       -3.6         2,848            93.2
                                                         35   33   CMPC                     CL        FORESTRY                        4,613.3       20.8        15,068           492.1
                                                         36   38   TAM                      BR        AIRLINES                        6,927.4        1.7        28,193          -178.6
                                                         37   40   GRUPO ARGOS              CO        CEMENT                            779.2      -51.1         6,263            N.A.
                                                         38   41   GRUPO MODELO             MX        BEVERAGES                       6,539.0       -5.0        36,566           856.4
                                                         39   35   VOTORANTIM CIM. (1)      BR        CEMENT                          5,680.0        6.9        12,000            N.A.
                                                         40   36   POLLO CAMPERO            GT        FOODS                             400.0       N.A.         7,000            N.A.
                                                         41   37   PDVSA (1)                VE        OIL                           102,500.0        7.3        80,000            N.A.
                                                         42   30   EMBRAER                  BR        AEROSPACE                       5,140.6      -19.5        17,149           385.2
                                                         43   42   TIGRE (1)                BR        CONSTRUCTION                    1,460.0       14.1         5,200            N.A.
                                                         44   39   FALABELLA                CL        RETAIL                          9,044.0       11.8        70,841           811.3
                                                         45   45   P.I. MABE (1)            MX        DIAPERS                           320.0       14.3        20,000            N.A.
                                                         46   44   METALFRIO                BR        WHITE GOODS                       402.6      -14.4         1,600             3.9
                                                         47   46   ARCOR (1)                AR        FOODS                           2,540.0        6.4        20,000            N.A.
                                                         48   43   SUZANO PAPEL E C.        BR        PULP                            2,538.3       -6.3         4,352            52.1
                                                         49   48   GRUPO TELEVISA           MX        MASS MEDIA                      4,486.9       -4.2        24,362           494.0
                                                         50   49   GRUPO ELEKTRA            MX        RETAIL                          3,729.6        0.1        39,429         2,144.6
          (1): Ventas Estimadas • N.D.: No Disponible


                                                         51   63   TOTVS                    BR        TECHNOLOGY                        681.9        0.6         5,507            90.0
                                                         52   51   CAMARGO CORREA           BR        CONSTRUCTION & ENGINEERING      9,610.0       -0.9        61,700            N.A.
                                                         53   50   FEMSA                    MX        BEVERAGES                      14,501.6        5.5       177,470           761.0
                                                         54   53   ANDRADE GUTIERREZ (1)    BR        CONSTRUCTION & ENGINEERING      8,400.0      -22.9       175,533            N.A.
                                                         55   64   DHB COMP. AUTOMOTIVOS    BR        AUTOPARTS                         163.1       -3.9         1,151            16.8
                                                         56   55   COPA AIRLINES (1)        PA        AIRLINES                        1,550.0        9.8         5,000            N.A.
                                                         57   54   ARTECOLA                 BR        CHEMICALS                         238.3      -36.9         1,831            N.A.
                                                         58   59   BEMATECH                 BR        TECHNOLOGY                        158.4      -20.6         1,144           -22.6
                                                         69   52   VITRO (1)                MX        GLASS                           2,030.0        7.7        17,628            27.6
                                                         60   60   MARCOPOLO                BR        AUTOPARTS                       1,804.6        1.4        17,231           182.9
                                                         61   58   NATURA                   BR        COSMETICS                       2,980.8       -3.3         7,037           443.0
                                                         62   61   GRUPO GLORIA             PE        FOODS                             954.1       16.8        13,680            84.1
                                                         63    -   RIPLEY                   CL        RETAIL                          1,821.0      -14.2        20,863           154.0
                                                         64   56   MADECO                   CL        MANUFACTURING                     428.2       26.4         2,416            19.2
                                                         65   62   LUPATECH                 BR        ENGINEERING                       327.3       -6.2         3,215           -92.9


                                                        46 AMÉRICAECONOMÍA / 2012 - 2013


MULTILATINAS GI.indd 46                                                                                                                                                                 17/8/12 16:48:55
RANKING
                                                                                                       LATIN AMERICA´S
                                                                                                  MOST GLOBALIZED
                                                                                                                 COMPANIES
                                                          RANKING VARIABLES
                                                                                                       GLOBALIZATION
    N° OF CO-                  GEOGRAPHICAL    % FOREIGN % FOREIGN      % FOREIGN     INTERNATIONAL                                 WWW.
              Nº OF REGIONS                                                                              INDEX 2012
    UNTRIES                   COVERAGE INDEX     SALES   INVESTMENT     WORKFORCE   GROWTH POTENTIAL
        22          8              79.2          89.2        66.5         61.7           98.1             80.3          JBS.COM.BR
        50          8             100.0          60.3        77.1         84.0           75.0             80.1          BRIGHSTARCORP.COM
        20          7              75.3          75.1        77.6         48.2           97.0             79.8          LAN.COM
        36          8              98.2          75.6        68.7         65.8           82.0             79.0          CEMEX.COM
        12          5              73.3          80.4        82.3         71.5           75.0             77.0          TENARIS.COM
         9          3              61.2          95.9        51.0         89.9           85.0             71.6          TELMEXINTERNACIONAL.COM
        17          6              83.8          45.0        72.1         27.0           75.0             68.1          ALFA.COM.MX
        39          9              92.4          18.4        50.6         27.1           95.0             66.7          VALE.COM
        14          6              71.3          38.9        60.9         48.0           83.0             66.1          GERDAU.COM.BR
        16          4              74.9          78.0        68.4         74.0           48.0             65.1          AJEGROUP.COM
        13          4              67.5          46.3        79.2         49.8           60.0             64.9          IMPSA.COM
        34          7              89.6          34.6        57.0         48.6           70.0             64.3          ODEBRECHT.COM
        19          6              73.7          54.4        61.1         52.7           68.0             64.2          GRUPOBIMBO.COM
        18          4              69.9          23.1        86.4         67.5           45.0             62.5          BAGO.COM
        25          8              84.5          43.5        70.4         25.0           55.0             61.4          SIGDOKOPPERS.CL
        18          4              69.9          36.0        33.6         70.0           88.0             61.1          AMERICAMOVIL.COM
        29          9              86.3          34.5        31.5         17.5           95.0             60.4          PETROBRAS.COM.BR
         7          2              48.1          70.1        92.3         65.3           30.0             59.9          ISA.COM.CO
         4          2              40.3          73.0        53.9         68.4           70.0             59.4          CASASABA.COM
        23          7              83.5          60.1        32.1         41.7           75.0             59.0          MARFRIG.COM.BR
        25          4              76.5          82.0        22.4         77.0           70.0             58.9          TACA.COM
        11          4              60.7          30.5        72.8         20.9           65.0             58.6          GRUPONUTRESA.COM
         6          5              60.0          93.4        38.0         63.0           55.0             55.6          CSAV.CL
         4          4              56.6          79.2        59.0         54.0           40.0             54.3          CCNI.CL
        16          6              66.7          76.0        30.6         70.0           56.0             53.9          MEXICHEM.COM.MX
        27          5              94.5          40.0        16.3         16.4           81.0             53.7          BRASILFOODS.COM
         8          4              69.8          58.0        28.5          4.0           82.0             53.3          FIBRIA.COM.BR
         4          1              39.4          39.0        67.1         57.4           52.0             53.3          INTERCEMENT.COM
         5          1              44.1          46.0        49.1         57.0           64.0             53.1          CENCOSUD.CL
        49          8              99.8          33.7        19.5         14.9           72.0             52.3          WEG.COM.BR
         9          3              56.4          55.3        42.7         79.5           48.0             52.0          SONDA.CL
        11          6              68.1          88.0        23.7         23.6           66.0             51.7          ARAUCO.CL
        16          7              77.8          65.7        18.7         63.3           58.0             51.5          GRUMA.COM
        30          7              86.0          77.4        19.7         13.8           64.0             51.4          CONCHAYTORO.COM
         9          2              57.1          75.8        30.5         29.5           67.0             51.2          CMPC.CL
        13          3              79.0          31.3         9.2          8.3           95.0             51.0          TAM.COM.BR
         7          3              50.9          51.0        32.7         38.9           70.0             50.0          ARGOS.CO
        22          9              81.6          51.6        15.9          2.9           77.0             49.6          GMODELO.COM.MX
         4          3              49.4          35.0        49.8         36.0           55.0             48.4          VOTORANTIM-CIMENTOS.COM
        13          6              72.6          72.0        10.3         76.5           53.0             48.4          GLOBAL.CAMPERO.COM
        10          5              70.0          95.2         5.3          4.7           75.0             48.1          PDVSA.COM
         6          4              60.0          87.0        27.0         12.3           58.0             47.4          EMBRAER.COM.BR
        10          2              61.4          22.4        44.0         25.0           56.0             47.0          TIGRE.COM.BR
         4          1              39.7          31.0        40.3         40.2           65.0             46.7          FALABELLA.CL
        21          6              73.1          46.1        36.7         24.1           42.0             45.3          GPOMABE.COM.MX
         6          4              67.0          29.8        41.7         51.0           36.0             44.8          METALFRIO.COM.BR
        16          6              74.8          16.3        27.6         28.7           56.0             44.5          ARCOR.COM.AR
         9          5              75.0          58.0        10.4          6.0           63.0             43.4          SUZANO.COM.BR
         8          3              52.5          16.8        22.4         10.5           77.0             43.0          TELEVISA.COM.MX
         8          3              49.6          15.0        28.8         16.8           70.0             42.7          ELEKTRA.COM.MX
        19          5              83.6          47.0         2.8          6.7           65.0             42.4          TOTVS.COM.BR
        14          5              71.5          18.4        15.2         16.9           66.0             42.2          CAMARGOCORREA.COM.BR
         9          3              52.7          41.1        18.3         35.6           61.0             42.0          FEMSA.COM
        38          8              70.1          25.2         7.6          9.7           73.0             41.7          ANDRADEGUTIERREZ.COM.BR
        26          7              87.6          25.7         3.6          1.6           64.0             40.5          DHB.COM.BR
         7          6              62.9          25.3        18.2         22.7           55.0             39.3          COPAAIR.COM
         6          2              48.9          21.6        30.1         16.3           52.0             39.3          ARTECOLA.COM.BR
        27          7              89.4          13.6        15.2          9.1           44.0             37.9          BEMATECH.COM
        11          5              70.9          48.5        16.0         17.0           48.0             37.7          VITRO.COM.MX
        12          7              59.6          27.1        11.4         26.1           56.0             37.5          MARCOPOLO.COM.BR
        10          3              65.7           7.2         7.7         21.7           62.0             36.9          NATURA.COM.BR
         6          2              47.2          16.3        14.4         24.0           60.0             35.8          GRUPOGLORIA.COM
         2          1              25.7          29.3        28.5         30.3           51.0             35.0          RIPLEY.CL
         3          1              33.9          38.2        17.2         53.2           46.0             34.9          MADECO.CL
        39          6              49.7          23.6        13.9         20.8           53.0             34.4          LUPATECH.COM.BR


                                                                                                                       2012 - 2013 / AMÉRICAECONOMÍA 47


MULTILATINAS GI.indd 47                                                                                                                               17/8/12 16:49:01
BANKING
SPECIAL                INTRODUCTION


          NO CRISIS
          HERE…YET
            Latin America’s banking sector is following a different path from the rest of the
            world’s financial industry thanks to growth in domestic markets. While the world’s
            biggest banks tumble, here they are achieving record results. But global turbulence
            could bring trouble in the months ahead. AméricaEconomía Intelligence


            V
                     isiting Bogota, it is impossible           in chaos, we see a future with lots of               60-65). While the world’s biggest bank-
                     not to notice the Colpatria Tower.         growth,” says one of the Colombian                   ing groups are fighting to remain liquid
                     Measuring 196 meters high, it              bankers participating in the battle for              and avoid seeing their net worth shrink,
                     is the tallest building in a city          Colpatria. It is a view shared by the                Latin America’s banks are exploiting the
            which has favored horizontal spread over            majority of executives who work at the               huge potential for long term growth in the
            towering skyscrapers. Even at night, its            financial institutions included in this              region’s financial sector. In fact, during
            colored lights make it a landmark in the            latest edition of our ranking of Latin               the first half of 2011, Latin America’s
            Colombian capital.                                  America’s 250 biggest banks (see pages               250 biggest banks proved to be com-
                Today the building is also
            in the spotlight of Latin Amer-       BANKING ASSETS America´s 250 biggest banks, by coun-
                                                   Growth of assets held by Latin
            ica’s banking industry. The
                                                   try, in millions of USD
            shareholders of the Colpatria          SOURCE: AMÉRICAECONOMÍA INTELLIGENCE
            conglomerate, which has its                                                                                                      OTHERS
                                                       BRAZIL      MEXICO       CHILE   COLOMBIA ARGENTINA    VENEZUELA   PERU     PANAMA
            head offices in the tower, are
                                                   4,500,000
            in the final stages of choosing
            a strategic partner to take a          4,000,000
            stake in Colpatria Multibanca,
            Colombia’s eighth biggest bank         3,500,000
            and the eighty-third largest in
            Latin America. A medium-               3,000,000

            sized bank with assets valued
                                                   2,500,000
            at US$6.24 billion, but which,
            according to media reports,            2,000,000
            some of the biggest global
            banking groups active in Latin          1,500,000

            America are keen to get their
                                                   1,000,000
            hands on: from Spain’s BBVA
            to the UK’s HSBC, as well as
                                                      500,000
            Itau and Banco do Brasil, both
            from Brazil.
                “Although the world is                        2000      2001       2002    2003  2004      2005    2006     2007     2008   2009    2010     2011


            48 AMÉRICAECONOMÍA / 2012 - 2013


BANCOS GI.indd 48                                                                                                                                               17/8/12 16:51:37
ESPECIAL
                                                                                                                                                 INTRODUCCIÓN                            BANCOS

            pletely detached from the global banking                   the New York branch of Deutsche Bank                                      continuing to see vigorous growth in
            industry. While banks in Europe and the                    Securities, citing a recent internal report                               consumer credit, credit cards and mort-
            United States suffer from illiquidity and                  at the German bank. Annualized ROA                                        gages,” says Sergio Fuentes, an S&P
            shrinking assets, banks in this part of the                (return on assets) of Latin America’s 250                                 analyst who follows these countries
            world saw their assets grow by 33% to                      biggest banks averaged 1.77% in the year                                  closely. Even Mexican banks, despite
            almost US$4 trillion, the highest figure                   to June 2011, while the return on equity                                  their proximity to the United States, have
            on record. Half-yearly profits rose by an                  reached a stunning 16.6%. Amidst the                                      continued to grow. The world’s biggest
            average of 30% to US$24.206 billion,                       flood of bad news about banking losses                                    financial groups are continuing to make
            almost matching the profits achieved in                    from around the world, only eighteen of                                   profits in Latin America that they cannot
            2008, which were the highest in the his-                   Latin America’s 250 largest banks failed                                  find elsewhere in the world. Take the
            tory of banking in Latin America. “Latin                   to make a profit. Just one of them, the                                   UK’s HSBC as an example. Its Latin
            American banks are the most profitable                     Brazilian subsidiary of France’s Société                                  American subsidiaries posted profits of
            in the world,” says Argentinean Gabriel                    Générale suffered a major loss.                                           US$1.151 billion during the first half of
            Roitman, director of Global Markets at                         “Countries like Peru and Chile are                                    2011, an increase of 30% from the same

             RANKING LATIN AMERICA´S 25 BEST BANKS


                                                                                                                          1
                                                                                                                        01
                                                                                                                       )2
                                                                                         1
                                                                                        01


                                                                                                                                                                                      -10
                                                                                                                     %


                                                                                                                                              -10
                                                                                                                                   1
                                                                                                         0


                                                                                                                                                                                      11
                                                                                                                               01
                                                                                                       1-1


                                                                                                                   S(
                                                                                        .2


                                                                                                                                                                                   11
                                                                                                                                                                                   20
                                                                                                                                            11
                                                                                                                              )2
                                                                                   LL


                                                                                                                  AN
                                                                                                    S1


                                                                                                                                                                                CY
                                                                                                                                                                       01 AL


                                                                                                                                                                               00
                                                                                                                              %


                                                                                                                                         ITY
                                                                                  MI


                                                                                                                LO


                                                                                                                                                                              00
                                                                                                  ET


                                                                                                                                                                            IEN
                                                                                                                         Y(


                                                                                                                                                                            F1
                                                                                                                                                                    ) 2 OT
                                                                                                                                       BIL
                                                                             S$


                                                                                                                                                    F1
                                                                                              SS


                                                                                                             NG


                                                                                                                       UIT


                                                                                                                                                                (% / T


                                                                                                                                                                        TO


                                                                                                                                                                        FIC
                                                                                                                                                                          1
                                                                            SU


                                                                                                                                    ITA
                                                                                             LA


                                                                                                                                                 TO
                                                                                                         MI


                                                                                                                     EQ


                                                                                                                                                            TS TY


                                                                                                                                                                     OU


                                                                                                                                                                     EF
                                                                            ET


                                                                                                                                   OF
                                                                                                         OR
                                                                                             TA


                                                                                                                                                 OU


                                                                                                                                                         SE UI


                                                                                                                                                                    X
                                                                                                                  ON


                                                                                                                                                                 IN
                                                                                                                                                                 CY


                                                                                                                                                                 DE
                                                                        SS


                                                                                                                                  PR
                                                                                         TO


                                                                                                       RF


                                                                                                                                                      AS ET EQ
                                                                                                                                             ITY
                                                             Y


                                                                                                                                                             IEN


                                                                                                                                                              %


                                                                                                                                                              IN
                                                                       LA


                                                                                                                RN
                                                         TR


                                                                                                    PE
                                                                                        %


                                                                                                                              %


                                                                                                                                           UID


                                                                                                                                                           R.


                                                                                                                                                          AL
               11

                         10


                                       NK


                                                                                                              TU
                                                        UN


                                                                                                                                                         FIC
                                                                     TA


                                                                                                    N-


                                                                                                                                                          N
                                                                                        R.


                                                                                                                              R.


                                                                                                                                                       VA


                                                                                                                                                      FIN
                                                                                                                                        LIQ
                                                                                                             RE
                                                                                                  NO
                                                                   TO
             RK

                    RK


                                       BA


                                                        CO


                                                                                   VA


                                                                                                                         VA


                                                                                                                                                      EF
               1    2     ITAÚ                     BR        480,623.0           36.2         4.2        13.6          13.2         20.0               5.8       74.3      6.8       61.0
               2    1     SANTANDER SANTIAGO       CL            52,546.9        39.0         2.6        27.4          -9.5         70.0               7.7      100.0        -       60.8
               3    4     BRADESCO                 BR        432,594.5           38.1         7.1        14.9           1.3         20.0               7.8       73.1      3.4       60.7
               4    6     DE CHILE                 CL            43,133.9        33.9         1.0        28.2          -9.4         90.0               8.1       72.8     -0.7       58.0
               5    3     CONTINENTAL BBVA         PE            14,440.5        30.3         0.2        34.2           4.2        100.0               7.8       67.5      1.7        57.6
               6    5     SANTANDER                MX            67,748.2        38.3         2.4        15.2          -6.8        100.0              10.6       80.2     -4.3       54.4
               7    7     INTERBANK                PE             7,026.5        15.8         1.1        31.2          -3.6        100.0               8.3       61.8      0.3       53.4
               8    9     SANTANDER                BR        270,588.1           30.4         7.3         2.1        -44.4          30.0              15.2       80.3     -4.2       53.1
               9     -    CITIBANK                 BR            30,589.9        18.5         4.3        48.9        482.9          60.0               8.8       52.1     -3.3       52.9
              10 12       CRÉDITO                  PE            23,666.6        27.0         1.1        24.4          -0.2        100.0               8.6       58.7     -0.2       51.3
              11    8     SANTANDER                UY             4,536.2        15.0         0.1         6.0        -59.5          80.0               9.9       79.3     -5.4       51.2
              12    11    BBVA BANCOMER            MX            95,914.9        10.7         3.2        21.1          -9.0        100.0               9.8       52.9     -5.0       51.1
              13 13       SCOTIABANK               PE            10,338.0        25.7         1.2        19.8          -8.7        100.0              12.5       57.6     -0.9       50.7
              14 10       INDUSTRIAL E COMERCIAL   BR            10,793.3        41.8         1.9         9.6        -29.9          20.0              12.0       89.1     -0.9       50.6
              15 15       CORPBANCA                CL            16,899.7        31.0         1.9        23.5           5.4         40.0               6.5       82.7      2.7       50.5
              16 16       DE BOGOTÁ                CO            23,018.6        38.6         1.9        13.1        -23.0         100.0              18.8       64.5     -0.5       50.4
              17 19       BICE                     CL             6,327.8        29.6         0.8        19.9          22.6         90.0               8.0       62.1     -5.9       50.0
              18 20       PICHINCHA                EC             6,245.5        21.7         1.7        22.8          78.9        100.0               8.8      58.2       0.3       49.9
              19 18       BCI                      CL            31,869.2        35.2         2.1        24.2          18.0        100.0               7.6      68.9       4.4       49.7
              20 22       MERCANTIL DEL NORTE      MX            50,475.6        12.7         2.4        14.3          -1.7        100.0               7.8       59.1     -0.2       44.6
              21 21       BBVA                     CL            16,063.9        18.5         2.1        16.8          -7.8         80.0               6.9      68.3      -1.2       43.8
              22 25       BANCOLOMBIA              CO            30,698.3        35.6         2.1        17.6           2.5        100.0              14.4       39.2      2.9       43.2
              23 23       INBURSA                  MX            22,605.3        30.7         4.2         8.6          41.0        100.0              18.2       60.0     -0.2       42.5
              24 17       ABC BRASIL               BR             5,951.6        20.8         0.3        10.8          13.1         10.0              15.3       49.5      3.3       42.4
              25 14       BANAMEX                  MX            96,962.2        14.4        15.6         8.0        -42.5         100.0              11.1       49.8     -1.6       40.6


                                                                                                                                                             2012 - 2013 / AMÉRICAECONOMÍA 49


BANCOS GI.indd 49                                                                                                                                                                            17/8/12 16:51:42
BANKING
SPECIAL               INTRODUCTION


            period of 2010 and equivalent to 10% of        CARRY ON LENDNG
                                                           The ten banks which most enlarged their credit portfolio, annual varia-
            the group’s total profits (in 2010, they       tion as a percentage
            accounted for just 8%). Only its new           SOURCE: AMÉRICAECONOMÍA INTELLIGENCE
            operations in Africa grew faster than its      700.00

                                                           600.00
            Latin American business, but starting          500.00
            from a much lower base. In fact, globally      400.00
            HSBC saw zero profit growth.                   300.00

                In the case of Citicorp, its banks in      200.00
                                                           100.00
            Latin America achieved the group’s best
                                                                .00
            performance during the first half of 2011,


                                                                          X)


                                                                                              )


                                                                                                                )


                                                                                                                                   )


                                                                                                                                                    )


                                                                                                                                                                       )


                                                                                                                                                                                       )


                                                                                                                                                                                                         )


                                                                                                                                                                                                                              )


                                                                                                                                                                                                                                               )
                                                                                          (BR


                                                                                                               GT


                                                                                                                               GT


                                                                                                                                                  (GT


                                                                                                                                                                    GT


                                                                                                                                                                                      BR


                                                                                                                                                                                                        BR


                                                                                                                                                                                                                           GT


                                                                                                                                                                                                                                              GT
                                                                        (M


                                                                                                            S(


                                                                                                                            L(


                                                                                                                                                                 R(


                                                                                                                                                                                                                             (


                                                                                                                                                                                                                                             L(
                                                                                                                                                                                   N(


                                                                                                                                                                                                    A(
                                                                                                                                                TIL


                                                                                                                                                                                                                         IAL
                                                                                         RE
                                                                        CO


                                                                                                                          RA


                                                                                                                                                                                                                                           TA
                                                                                                          RE


                                                                                                                                                                   O


                                                                                                                                                                                                    FR
            lifting profits by 12.7% to US$6.739


                                                                                                                                                                                 GA
                                                                                                                                                                AD
                                                                                                                                              AN
                                                                                     EE


                                                                                                                                                                                                                      TR
                                                                      AN


                                                                                                                                                                                                                                         EN
                                                                                                                         RU
                                                                                                         DO


                                                                                                                                                                                                  SA
                                                                                                                                                                                  R
                                                                                    ND


                                                                                                                                                              RM


                                                                                                                                                                                                                    US
                                                                                                                                            RC


                                                                                                                                                                               MO
                                                                  CIB


                                                                                                                                                                                                                                      TIN
                                                                                                       JA


                                                                                                                        LLO


                                                                                                                                                                                               J.


                                                                                                                                                                                                                   IND
                                                                                                                                         ME


                                                                                                                                                          FO
                                                                                     H


                                                                                                     BA


                                                                                                                                                                                                                                    ON
                                                                                                                                                                            JP
                                                                                  JO


                                                                                                                    RO


                                                                                                                                                         RE
                                                                                                                                       RO
                                                                                                     RA


                                                                                                                                                                                                                                  TC
            billion. Asia, on the other hand, grew


                                                                                                                   AR


                                                                                                                                       AG
                                                                                                  ST


                                                                                                                                                                                                                               G&
                                                                                                                 ES
                                                                                                LO


                                                                                                               LD
                                                                                              DE


                                                                                                               DE
            by just 2.3%, while its global profits fell
            by 6.2% in the same period.                    TAKING ON RISK
                The strong presence in Latin America       The ten largest increases in the credit/asset ratio, measured in percen-
            of some Spanish banks literally saved          tage points
                                                           SOURCE: AMÉRICAECONOMÍA INTELLIGENCE
            their skin. In the middle of a recession in
                                                            350%
            Spain, BBVA lifted its profits generated
                                                            300%
            in Latin America during the first half of       250%
            the year by 14% (measured in Euros).            200%

            Meanwhile, its profits in Spain fell by         150%

            34.4%. The region now generates 47% of          100%

                                                             50%
            the Spanish firm’s brute margin, despite
                                                              0%
            representing just 22% of its assets.
                                                                              )


                                                                                                  )


                                                                                                                    )


                                                                                                                                    )


                                                                                                                                                    X)


                                                                                                                                                                       )


                                                                                                                                                                                        )


                                                                                                                                                                                                          )


                                                                                                                                                                                                                              )


                                                                                                                                                                                                                                               )
                                                                             GT


                                                                                                GT


                                                                                                                BR


                                                                                                                                   (GT


                                                                                                                                                                    (GT


                                                                                                                                                                                      GT


                                                                                                                                                                                                         (GT


                                                                                                                                                                                                                          (BR


                                                                                                                                                                                                                                              (BR
                                                                                                                                                    (M
                                                                             L(


                                                                                                S(


                                                                                                                                                                                      L(
                                                                                                               E(


                                                                                                                               OR


                                                                                                                                                                 TIL


                                                                                                                                                                                                    IAL


                                                                                                                                                                                                                         AN


                                                                                                                                                                                                                                         ICO
                                                                                                                                               CO


                The story is similar for their compa-
                                                                        RA


                                                                                                                                                                                   TA
                                                                                           RE


                                                                                                               ER


                                                                                                                              AD


                                                                                                                                                                AN


                                                                                                                                                                                                   TR


                                                                                                                                                                                                                     RG
                                                                                                                                              AN


                                                                                                                                                                                 EN


                                                                                                                                                                                                                                        NT
                                                                        RU


                                                                                          DO


                                                                                                           DE


                                                                                                                          RM


                                                                                                                                                                                                   US
                                                                                                                                                              RC


                                                                                                                                                                                                                    MO
                                                                                                                                            CIB


                                                                                                                                                                                TIN


                                                                                                                                                                                                                                      LA
                                                                                         JA
                                                                      LLO


                                                                                                          HN


                                                                                                                                                                                              IND
                                                                                                                                                          ME


                                                                                                                                                                                                                                    AT
                                                                                                                         FO
                                                                                     BA


                                                                                                                                                                             ON


                                                                                                                                                                                                                 JP
                                                                                                       JO
                                                                  RO


                                                                                                                                                                                                                                  ER
                                                                                                                        RE


                                                                                                                                                         RO
                                                                                    RA


            triots at Banco Santander. The region
                                                                                                                                                                            TC


                                                                                                                                                                                                                                 NT
                                                                AR


                                                                                                                                                         AG
                                                                                  ST


                                                                                                                                                                           G&


                                                                                                                                                                                                                               AI
                                                             ES


                                                                               LO


                                                                                                                                                                                                                            IST
                                                           LD


                                                                              DE


                                                                                                                                                                                                                          AV
                                                           DE


            generated US$4.001 billion in profits


                                                                                                                                                                                                                         BO
            during the first half of the year, 13.4%       PLAYING IT SAFE
                                                           The ten largest falls in the credit/asset ratio, measured in negative
            more than the same period of 2010. At          percentage points
            the time, profits from its operations          SOURCE: AMÉRICAECONOMÍA INTELLIGENCE
            in continental Europe fell by 17%. At            90%
                                                             80%
            the end of the first half of 2011, Latin         70%

            America accounted for 44% of San-                60%
                                                             50%
            tander’s group profits.                          40%
                These rising profits and ballooning          30%

            assets were created by banking systems           20%
                                                             10%
            which have massively expanded their               0%
            coverage in recent years. In addition,
                                                                                )


                                                                                              MX


                                                                                                                )


                                                                                                                                  )


                                                                                                                                                    )


                                                                                                                                                                       )


                                                                                                                                                                                      )


                                                                                                                                                                                                        R)


                                                                                                                                                                                                                          )


                                                                                                                                                                                                                                              )
                                                                             BR


                                                                                                              MX


                                                                                                                               BR


                                                                                                                                                  (BR


                                                                                                                                                                   (BR


                                                                                                                                                                                   BR


                                                                                                                                                                                                                         (BR


                                                                                                                                                                                                                                           MX
                                                                                                                                                                                                    . (B
                                                                                           K(
                                                                          A(


                                                                                                                              B(


                                                                                                                                                                                  O(
                                                                                                            E(


                                                                                                                                                                                                                                        K(
                                                                                                                                               NO


                                                                                                                                                                LE


                                                                                                                                                                                                                     AL
                                                                                                                                                                                                   N.A
                                                                                            N
                                                                        FR


                                                                                                                              IM


                                                                                                                                                                                SIC
                                                                                                          IRM


                                                                                                                                                                                                                                          N
                                                                                                                                                               ST


                                                                                                                                                                                                                    ER
                                                                                         BA


                                                                                                                                              ICA


                                                                                                                                                                                                                                       BA


            the growing commercial and financial
                                                                        SA


                                                                                                                                                                              AS


                                                                                                                                                                                              NK
                                                                                                                                                          WE


                                                                                                                                                                                                                     N
                                                                                                          AF
                                                                                     .G.


                                                                                                                                            ER


                                                                                                                                                                                                                                    HE
                                                                                                                                                                                                                  GE
                                                                      J.


                                                                                                                                                                            CL


                                                                                                                                                                                             BA
                                                                                    I.N


                                                                                                                                         AM


                                                                                                                                                                                                                                   SC
                                                                                                                                                                                                               TE
                                                                                                                                                                                               I
                                                                                                                                                                                           CIT


                                                                                                                                                                                                                                 UT
                                                                                                                                          N


                                                                                                                                                                                                             CIE
                                                                                                                                       PA


                                                                                                                                                                                                                               DE


            importance of China helped to offset the
                                                                                                                                                                                                          SO


            restrictions spreading from the financial     financial system. Their performance                                                                   liquidity tests to select Latin America’s
            markets of the United States and Europe.      depends on their capacity to success-                                                                 25 best banks. To do this, we used the
            However, banks cannot only be measured        fully face cycles of tightening credit                                                                CAMEL methodology, an international
            in terms of their profits. While banking      and shrinking assets, like the one the                                                                benchmark which analyses financial in-
            profits mean corporate strength and the       world is going through today. So as                                                                   stitutions based on their Capital, Assets,
            capacity to face external shocks, they are    well as revising the balance sheets of                                                                Management, Earnings and Liquidity.
            not the only qualities which we should        Latin America’s 250 biggest banks for                                                                     In addition, in order to reflect the
            ask of institutions which remain the big-     this special report, AméricaEconomía                                                                  difficulties which financial institutions
            gest component of the Latin American          Intelligence also carried out stress and                                                              have faced in maintaining good indicators


            50 AMÉRICAECONOMÍA / 2012 - 2013


BANCOS GI.indd 50                                                                                                                                                                                                                                   17/8/12 16:51:45
ESPECIAL
                                                                                                        INTRODUCCIÓN                            BANCOS

            while operating at scale, the methodology     other financial crisis? “This new global      says Torres. “We in turn were able to
            for selecting the best banks also awarded     crisis will find Latin America not totally    resolve it in just ninety days by working
            the volume of assets which the banks          prepared,” says the Peruvian economist        together and you can still see the results
            have to manage (in fact, Latin America’s      Liliana Rojas-Suárez, who chairs the          of that effort today.”
            fifty biggest banks have a smaller return     Latin-American Shadow Financial                   One of the results of that deal was
            on assets or ROA than the fifty smallest      Regulatory Committee. “Much of the            a sharp increase in lending by relaxing
            banks on the ranking or than the average      region’s fiscal health has been spent         criteria.
            of the 250 biggest banks).                    countering the effects of the last crisis         Today Brazil faces the opposite prob-
                In this 2011 version of the ranking,      and that has left us with fewer tools to      lem: how to prevent the economy from
            Brazil’s Banco Itau took first place for      employ.”                                                           overheating. “Today
            the first time (page 53). Its capacity to         According to the                                               we are cutting our
            generate unprecedented growth in as-          consultant Ernani
                                                                                   Latin America                             funding for these loans
            sets, and deposits, lifted it to the top of   Torres, until recently   is less prepared                          to avoid a bubble,”
            the ranking, ending the six-year reign        head of economic                                                   says Marcelo Nasci-
            of Santander Santiago, the jewel in the       research at Brazilian    for the next crisis                       mento, senior research
            crown of the Spanish banking group.           development bank                                                   analyst at BNDES. He
            Despite a fall in profitability, the Chil-    BNDES, it is a mis-
                                                                                   than it was for                           describes as realistic
            ean firm remains Latin America’s most         take to believe that     the collapse of                           the S&P report which
            efficient bank.                               the crisis which be-                                               last June explained
                To study banking, one must take           gan with the fall of     Lehman Brothers                           that “BNDES, which,
            a well-rounded approach. Especially           Lehman Brothers and                                                until 2010, was a key
            in today’s uncertain times when slow          is continuing today
                                                                                   in 2008.                                  promoter of counter-
            global growth could at any moment             did not affect Latin                                               cyclical fiscal policies
            trigger the collapse of a major European      America. “It affected                                              and expanding cred-
            institution (bank or country) which would     us and continues to                                                it, has significantly
            then cause a major shock to the global        affects us. Just look at the merger of Itau   slowed its rate of lending during 2011.”
            financial system.                             and Unibanco. That would not have oc-         In fact, according to S&P, the volume
                In 2008, when the fall of the invest-     curred without the crisis,” he says.          of lending, both direct and secondary
            ment bank Lehman Brothers sparked a               In Brazil, a strategic agreement, not     (loans from other banks, but financed
            generalized run on the banks which forced     widely reported at the time, played a         by BNDES) grew by just 0.3% in April
            governments to stump up cash to prevent       key role. “In December 2008, the gov-         and by 2.5% so far this year.
            further collapses, Latin America’s banks      ernment, the central bank and BNDES               However, for many observers, it is
            were also hit. In the year to June 2009,      literally locked in a room all the bank-      already too late. “Brazil lacks the fis-
            the region’s banks saw the value of their     ers and business leaders whose pockets        cal margin to either promote expansive
            assets fall by 0.65% after two years with     were stuffed with derivatives and told        policies or to cut interest rates,” says
            growth rates of around 40% a year.            them: if you want to leave, leave now,        Rojas-Suarez from Washington.
                Fortunately, Latin America’s leading      those who stay, close your eyes and               Colombia is in a similar situation
            economies were coming out of a long           prepare to follow the plan we are going       after a series of fiscal deficits. Mexico,
            period of economic expansion during           to implement.”                                Chile, Peru and Panama, on the other
            which conservative fiscal policies meant          According to Torres, it was this ca-      hand, have room to act.
            that governments had sufficient resources     pacity to change and adapt learnt during          But if a global crisis is not on the
            to fund countercyclical fiscal policies,      decades of economic and political insta-      cards then Latin America’s banks and
            such as lowering interest rates, increasing   bility that led the whole financial sector    governments can continue to breathe
            spending and promoting lending through        to follow the government’s recipe for         easy. Will these good results be repeated
            state and development banks. As a result,     filling the hole left by derivatives.         during the next two halves? For now, the
            the contraction of bank assets lasted just        “The United States was a slow and         answer lies beyond their borders. ■
            one year, compared with four years after      clumsy elephant which took the crisis to
            the tech bubble burst in 2000.                Congress, devalued its assets and turned               Pablo Gonzalez collaborated
                What would happen if there was an-        an economic crisis into a political one,”        with this article from Buenos Aires.


                                                                                                                     2012 - 2013 / AMÉRICAECONOMÍA 51


BANCOS GI.indd 51                                                                                                                                       17/8/12 16:51:48
BANKING
SPECIAL                  LATIN AMERICA´S 250 BIGGEST BANKS


                                                                                                    )
                                                                     FO ON S$ UNE


                                                                                                   %
                                                                                                  1


                                                                                                1(
                                                                                                 1


                                                                                              01
                                                                                     U J
                                                              AS A OF U UNE


                                                                                             01


                                                                                               )

                                                                                            S1
                                                              11 RIA S$ 2011


                                                                                              S
                                                              MI POS /10 EDIT


                                                                                            %
                                                              PO RIA OF IN


                                                              MI OFI US$ NE 2


                                                                                         F IT
                                                                                 S$ E 2
                                                              20 EDI %) L


                                                                                        1(

                                                                                       AN
                                                                    T S N S$
                                                                  CR /10 ( TOTA
                                                                  VA NS IN J


                                                                   VA ONS OLIO


                                                                                        )


                                                                                     RO
                                                                             F U UN
                                                                  DE 11 CR
                                                                 LL IT (%


                                                                                     Y1
                                                                  PR OF JU


                                                                             F U NE


                                                                                    LO
                                                                    ION ITY )
                                                              MI ET EQ 10 (%


                                                              RE ) IN P
                                                                         S O IN J
                                                                        LL T S


                                                                        LL T F


                                                                         S O JU


                                                                                 UIT
                                                                        LIO IN


                                                                         S IN


                                                                                ING
                                                                        11 IN


                                                                        S 1 IN
                                                                                 IP

                                                                     MI SSE


                                                                     MI OR


                                                                    ION IN


                                                                             EQ
                                                                             SH


                                                                    SIT N


                                                                     (% N


                                                              RK FORM
                                                                    ION S


                                                                  N 1/
                                                                 11 T P
                                                                 SE T IO


                                                                PO TIO


                                                                /10 TIO
                                                                           IO


                                                                 RT TI


                                                                 LL T S
                                                                 LL U
                                                                 11 A
                                                              R


                                                                         ON
                                                             Y


                                                                           I
                                                           NE
                                                         TR


                                                              20 TAL


                                                              DE RIA


                                                                       R
                                                                      RI


                                                                     RN
                                                         OW
                                                       UN


                                                                   PE
                                                                  TO
                                 NK


                                                                  VA


                                                                  VA
              11


                                                                 10
                                                                 TU

                                                                 N-
                                                     CO
                               BA


                                                              NO
            RK


               1    DO BRASIL                   BR       S    492,278.5    35.8   185,260.0    33.4   232,072.3    33.4   34,983.3   3,061.4     34.6   17.5    1.0     1
               2    ITAÚ UNIBANCO               BR       DP   480,623.0    36.2    76,439.7    44.7   234,047.1    40.9   27,900.1   1,901.1     28.8   13.6    4.2     2
               3    BRADESCO                    BR       DP   432,594.5    38.1    96,043.6    44.1   186,967.4    28.2   33,689.9   2,503.7     38.5   14.9    7.1     3
               4    CAIXA ECONOMICA FEDERAL     BR       S    293,374.8    38.3   122,931.3    58.4   149,480.9    37.2   11,647.9   1,176.6     64.0   20.2    2.0     4
               5    SANTANDER BRASIL            BR       FO   270,588.1    30.4    68,328.9    35.5    98,688.5    35.6   41,249.3     425.6    -36.9    2.1    7.3     5
               6    BANAMEX                     MX       FO    96,962.2    14.4    29,336.9    10.7    41,464.6    27.8   10,800.4     430.3    -44.7    8.0   15.6     7
               7    BBVA BANCOMER               MX       FO    95,914.9    10.7    47,304.2    17.3    51,643.9    18.6    9,438.3     993.9     10.9   21.1    3.2     6
               8    HSBC BANK BRASIL, BM        BR       FO    88,581.1    39.1    22,973.0    48.5    49,186.6    23.2    5,245.6     389.4     65.3   14.8    3.5     8
               9    VOTORANTIM                  BR       DP    81,960.6    38.1    11,663.5    38.0    14,266.6    14.9    5,632.1     344.6     29.7   12.2    1.0     9
              10    SANTANDER MÉXICO            MX       FO    67,748.2    38.3    24,034.7    52.3    26,867.8    37.7    7,177.1     546.2      8.5   15.2    2.4    10
              11    SAFRA                       BR       DP    55,237.6    39.3    16,304.9    59.8    17,023.3    64.1    3,778.5     372.9     30.8   19.7    0.9    12
              12    SANTANDER CHILE             CL       FO    52,546.9    39.0    37,108.9    39.8    28,342.8    37.1    4,042.0     553.9     18.7   27.4    2.6    13
              13    MERCANTIL DEL NORTE         MX       DP    50,475.6    12.7    22,024.7    22.0    23,754.0     9.4    3,932.8     282.0     18.2   14.3    2.4    11
              14    DE CHILE                    CL       DP    43,133.9    33.9    33,815.0    37.6    28,183.7    32.9    3,482.7     491.8     29.5   28.2    1.0    15
              15    ESTADO                      CL       S     42,911.8    35.9    25,331.9    22.5    28,932.1    41.7    1,998.1      96.2     31.7    9.6    4.9    16
              16    HSBC MÉXICO                 MX       FO    42,262.2    28.0    15,106.6    31.2    23,225.9    28.7    3,120.7      43.5    145.2    2.8    2.5    14
              17    NACIÓN ARGENTINA            AR       S     35,608.6    14.5    11,599.6    18.1    28,354.5    15.1    2,955.0     191.0     22.2   12.9      -    17
              18    BCI                         CL       DP    31,869.2    35.2    22,117.4    32.4    18,440.7    33.1    2,426.9     294.2     64.5   24.2    2.1    19
              19    BTG PACTUAL                 BR       DP    31,177.5    89.0     2,676.0   144.6     5,575.3    63.2    3,714.9     276.9     48.0   14.9    0.5    24
              20    BANCOLOMBIA                 CO       DP    30,698.3    35.6   21,370.22    37.8   18,183.34    25.6   4,425.34    390.40     25.0   17.6    2.1    20
              21    CITIBANK BRASIL             BR       FO    30,589.9    18.5     5,707.7    45.5    11,151.0    36.9    2,695.8     659.0    787.2   48.9    4.3    18
              22    CRÉDITO PERÚ                PE       DP    23,666.6    27.0    13,516.6    27.2    15,402.7    21.0    2,038.7     248.3     21.3   24.4    1.1    21
              23    DE BOGOTÁ                   CO       DP    23,018.6    38.6   13,846.21    35.1   14,386.96    22.6   4,319.60    283.73     40.4   13.1    1.9    23
              24    INBURSA                     MX       DP    22,605.3    30.7    12,595.4    -4.2    10,713.0    -1.1    4,121.4     176.6     68.4    8.6    4.2    22
              25    BANRISUL                    BR       S     22,363.0    28.0    10,822.6    41.1    12,759.9    32.7    2,663.5     206.7     82.2   15.5    1.7     -
              26    SCOTIABANK INVERLAT         MX       FO    18,000.5    36.4     9,163.3    20.0    10,424.6    18.6    2,345.1     121.0     19.5   10.3    3.0    27
              27    DAVIVIENDA                  CO       DP    17,638.9    31.5   13,122.72    33.8   11,177.56    25.5   2,146.22    168.08     31.0   15.7    3.2    26
              28    CORPBANCA CHILE             CL       DP    16,899.7    31.0    12,221.3    26.2     9,611.3    26.4    1,103.7     129.5     27.6   23.5    1.9    28
              29    BBVA CHILE                  CL       FO    16,063.9    18.5    11,635.6    27.0     9,000.7    13.1    1,104.9      93.0     12.9   16.8    2.1    25
              30    DO NORDESTE                 BR       S     15,813.3    43.1     6,298.1    26.3     5,619.6    47.0    1,528.7     150.9    421.8   19.7    2.9    30
              31    BNP PARIBAS                 BR       FO    15,517.6    50.2       214.9    -4.5     3,010.0    -1.6      685.9      41.3    -33.2   12.0    5.3    32
              32    DE VENEZUELA SANTANDER      VE       FO    15,421.4    46.6     6,233.0    50.7    13,825.2    54.0    1,140.4     160.5        -   28.1    1.2    31
              33    DEUTSCHE BANK BRASIL        BR       FO    14,971.5    74.7       447.2    18.5     2,043.5   111.9      642.0      10.4    -58.2    3.2    0.2    43
              34    CONTINENTAL BBVA            PE       FO    14,440.5    30.3     9,663.6    27.2     9,678.8    26.1    1,121.0     191.6     16.9   34.2    0.2    29
              35    DEUTSCHE BANK MÉXICO        MX       FO    14,357.4   365.8        47.8     7.0       158.0       -      206.1       3.2    -65.0    3.1    0.0   108
              36    VOLKSWAGEN                  BR       FO    13,858.2    34.9    10,923.7    44.0     3,562.4     2.2    1,280.4      83.4     27.2   13.0    0.6    33
              37    BBVA COLOMBIA               CO       FO    13,026.3    29.5    9,320.90    37.5    9,150.04    30.2   1,282.05    128.70      6.5   20.1    2.2    34
              38    BANESCO                     VE       DP    12,939.2    30.3     7,388.8    29.2    11,197.0    29.5    1,136.0     142.1     51.4   25.0    1.4    35
              39    PROVINCIAL                  VE       FO    12,898.8    32.7     6,734.1    47.1    10,617.0    35.4    1,460.2     274.0     39.5   37.5    1.6    36
              40    BICENTENARIO                VE       S     12,600.7    64.7     1,916.0    29.3     7,802.8    45.8      569.5      75.2    886.5   26.4   13.1    47
              41    MERCANTIL                   VE       DP    12,477.8    33.7     7,334.8    49.1    11,006.5    36.5    1,141.3     181.0     76.1   31.7    0.9    39
              42    SCOTIABANK CHILE            CL       FO    11,666.8    21.5     8,706.2    19.3     5,141.9    18.6    1,167.2      85.5     84.3   14.7    6.1    38
              43    ING BANK                    MX       FO    11,616.9    52.9       348.4    -6.4       439.4     0.8      679.3      -3.8   -137.9   -1.1    0.0    49
              44    REP. ORIENTAL DEL URUGUAY   UY       S     11,322.1    23.6     8,757.9    26.0    10,114.6    23.3    1,207.5      85.7      7.7   14.2    0.2    40
              45    DE OCCIDENTE COLOMBIA       CO       DP    11,096.5    24.4    7,388.83    30.6    6,759.34    22.6   1,506.21    120.03     11.4   15.9    2.9    41
              46    INDUSTRIAL E COMERCIAL      BR       DP    10,793.3    41.8     6,609.5    30.1     5,960.0    46.5    1,297.5      62.4    -12.5    9.6    1.9    48
              47    HSBC PANAMÁ                 PA       FO    10,755.9    11.2     7,002.0    15.7     8,476.9     9.0    1,584.2      49.3     45.2    6.2      -    37
              48    JP MORGAN                   BR       FO    10,347.9    55.3       342.5   255.7       525.9   104.9      927.5      30.4     57.6    6.6    0.0    54
              49    SCOTIABANK PERÚ             PE       FO    10,338.0    25.7     5,922.9    24.5     6,786.6    19.7    1,290.5     127.9      8.8   19.8    1.2    45
              50    PROVINCIA                   AR       S     10,003.9    14.7     3,153.6    23.1     8,781.7    23.4      570.8      43.9     40.5   15.4      -    42


            52 AMÉRICAECONOMÍA / 2012 - 2013


BANCOS GI.indd 52                                                                                                                                                           17/8/12 16:51:51
ESPECIAL
                    LATIN AMERICA´S 250 BIGGEST BANKS                                                                                                            BANCOS


                                                                                                )
                                                                   FO ON S$ UNE


                                                                                               %
                                                                                              1


                                                                                            1(
                                                                                             1


                                                                                          01
                                                                                 U J
                                                            AS RIA OF U UNE


                                                                                         01


                                                                                           )

                                                                                        S1
                                                            11 RIA S$ 011


                                                                                          S
                                                            MI POS /10 EDIT


                                                                                        %
                                                            PO A OF IN


                                                            MI OFI S$ E 2


                                                                                     F IT
                                                                             S$ E 2
                                                                    ED % L


                                                                                    1(

                                                                                   AN
                                                                  T S N S$
                                                                CR /10 ( TOTA
                                                                VA NS IN J


                                                                 VA ONS OLIO


                                                                VA F U NE 2
                                                                PR OF U JUN
                                                                                    )


                                                                                 RO
                                                                          F U UN
                                                                DE 11 CR
                                                               LL IT (%


                                                                                 Y1


                                                                                LO
                                                                  ION ITY )
                                                            MI ET EQ 10 (%


                                                            RE ) IN P
                                                                      S O IN J
                                                                      LL T S


                                                                      LL T F
                                                               11 IT P )


                                                                      S O JU


                                                                             UIT
                                                                      LIO IN


                                                                      S IN


                                                                            ING
                                                                      11 IN


                                                                      S 1 IN
                                                                             IP

                                                                   MI SSE


                                                                   MI OR


                                                                  ION IN


                                                                          EQ
                                                                          SH


                                                                  SIT N


                                                                   (% N


                                                            RK FORM
                                                                  ION S


                                                                N 1/
                                                               SE T IO


                                                              PO TIO


                                                              /10 TIO
                                                                        IO


                                                               RT TI


                                                               LL T S
                                                               LL U
                                                               11 A
                                                            R


                                                                       ON
                                                           Y


                                                                        I
                                                         NE
                                                       TR


                                                            20 TAL


                                                            DE RIA
                                                                     RI


                                                                     R
                                                                   RN
                                                       OW
                                                     UN


                                                                 PE
                                                                TO
                                 NK


                                                                VA
               11


                                                               10
                                                               TU

                                                               N-
                                                   CO
                               BA


                                                            20


                                                            NO
             RK


               51   SANTANDER RÍO             AR      FO    9,986.6    30.3    5,238.9    26.7    6,832.2    31.8     836.3     90.4      -23.6    21.6      -    46
               52   SICREDI                   BR      DP    9,024.0    48.5    3,476.0    51.3    4,221.4    36.3     272.5     15.5       69.7    11.3    0.0    59
               53   GENERAL                   PA      DP    8,656.2     4.5    5,398.2     5.2    7,019.8     7.2     868.7     87.3        1.5    20.1      -    44
               54   AGRARIO                   CO      S     8,444.8    19.8       N,D,       -   5,325.30    16.0    699.82   123.52        9.6    35.3      -    52
               55   MACRO                     AR      DP    8,090.3    14.1    3,843.0    29.6    5,435.3    15.9   1,074.4     62.8      -33.5    11.7      -    51
               56   GALICIA                   AR      DP    7,969.2    21.9    4,240.9    36.2    5,799.6    28.9     689.7     57.3      115.0    16.6      -    55
               57   BANCOOB                   BR      DP    7,805.1    57.2    2,432.8    50.6    5,078.7    82.6     212.0     11.5       59.3    10.9    0.0    73
               58   BBVA, FRANCÉS             AR      FO    7,764.3    15.4    3,937.5    37.7    5,875.2    16.5     743.1     47.6      -34.6    12.8      -    53
               59   BMG                       BR      DP    7,751.2    29.3    5,502.3    39.5    4,075.3    50.7   1,363.4     13.9      -91.5     2.0    2.9    62
               60   ITAÚ CHILE                CL      FO    7,672.8    34.5    6,273.1    42.7    4,994.2    32.1     826.1     67.2       61.6    16.3    1.1    66
               61   POPULAR COLOMBIA          CO      DP    7,660.1    23.2   5,340.78    40.3   5,202.96    20.7    998.04   108.20       11.6    21.7    2.3    58
               62   IXE                       MX      DP    7,628.6    48.4    2,645.5    32.1    2,699.3    25.9     417.2     -0.6      -84.0    -0.3    1.0    69
               63   NACIÓN PERÚ               PE      S     7,415.6     1.9    1,700.5    26.7    5,719.6     1.2     599.6    116.2      138.7    38.8    0.4    50
               64   DEL BAJIO                 MX      DP    7,217.8    15.6    5,236.2     9.2    4,266.6    19.2     925.5     35.9        2.2     7.8    3.2    57
               65   SECURITY                  CL      DP    7,191.4    24.1    4,633.5    31.0    4,274.9    25.3     446.4     39.9       14.9    17.9    1.4    65
               66   FIBRA                     BR      DP    7,095.8    25.6    3,150.4    29.9    3,887.5    29.6     571.1      7.7       44.6     2.7    1.2     -
               67   BANK OF AMERICA           MX      FO    7,067.5    96.6      183.6   146.7      307.8    67.3     357.7     43.7      124.9    24.4    0.0    99
               68   INTERBANK                 PE      DP    7,026.5    15.8    4,490.2    24.9    4,610.0     6.2     580.9     90.7       13.7    31.2    1.1    60
               69   DAYCOVAL                  BR      DP    7,024.1    45.3    3,685.6    62.7    2,684.4    73.5   1,174.6     59.2       49.4    10.1    1.6    76
               70   SOCIETE GENERALE          BR      FO    7,004.5    47.7      104.3   -61.1      803.5   -24.5     500.6   -202.4   -2,418.4   -80.9    0.0    79
               71   NACIONAL C. RICA          CR      S     6,949.4     9.3    4,026.6    16.5    4,865.6     6.8     734.4     27.8       -2.6     7.6    3.9    56
               72   INTERACCIONES             MX      DP    6,804.8    12.9    3,774.6    12.6    2,879.1    12.6     394.5     39.9       33.1    20.2    0.8    61
               73   PANAMERICANO              BR      DP    6,765.5    19.0    1,888.3   -37.0    2,246.4   -29.4     959.4     24.4      154.2     5.1   21.0    67
               74   NACIONAL PANAMÁ           PA      DP    6,739.2    13.0    2,812.6    26.1    5,830.9    14.6     553.7     48.1       -1.7    17.4      -    63
               75   OCCIDENTAL DE DESCUENTO   VE      DP    6,688.1    13.5    3,292.9    23.9    5,210.6    25.8     587.0     74.3       34.8    25.3    4.9    64
               76   MERCANTIL DO BRASIL       BR      DP    6,545.8    31.7    3,371.8    40.7    3,998.5    46.5     442.7     27.5      -45.0    12.4    4.7    71
               77   CRUZEIRO DO SUL           BR      DP    6,515.2    41.3    1,081.4    46.4    2,743.3    22.8     749.2     45.0       85.3    12.0    3.3    81
               78   BICE                      CL      DP    6,327.8    29.6    4,560.2    27.4    3,795.3    23.4     505.3     50.2       59.1    19.9    0.8    75
               79   AFIRME                    MX      DP    6,293.5    97.8      810.4    14.3    1,153.5    17.2     221.0      7.8      -22.0     7.1    5.0   107
               80   PICHINCHA                 EC      DP    6,245.5    21.7    3,362.8    21.6    4,965.0    18.9     552.4     63.1      103.9    22.8    1.7    70
               81   J. SAFRA                  BR      DP    6,242.8   466.1    3,508.1   252.6    5,742.9   522.2     345.4      7.5       84.5     4.3    0.4   207
               82   RABOBANK BRASIL           BR      FO    6,241.0    38.0    1,667.9    22.7      283.5    15.7     447.3     31.2       40.4    14.0    1.2    82
               83   COLPATRIA                 CO      DP    6,240.3    30.1   5,106.69    34.9   4,344.53    36.7    562.46    63.17       57.0    22.5    4.2    78
               84   PINE                      BR      DP    6,105.8    39.0    2,342.9    31.0    2,036.8    27.7     569.2     26.5       19.5     9.3    0.9    86
               85   HELM BANK                 CO      FO    6,091.9    69.3   4,622.79    77.2   3,907.55    57.4    634.79    34.98        8.4    11.0    2.1    98
               86   DA AMAZONIA               BR      S     6,009.3    34.1    1,298.9    44.2    1,609.1    35.4   1,259.7     27.6        6.7     4.4    5.8    83
               87   ABC BRASIL                BR      DP    5,951.6    20.8    3,829.2    24.1    1,731.9     3.9     908.0     48.8       44.3    10.8    0.3    74
               88   AZTECA                    MX      DP    5,951.4    13.0    2,600.3    53.4    4,467.3    10.0     446.1     29.3       21.4    13.1    3.0    68
               89   HSBC ARGENTINA            AR      FO    5,926.4    23.5    2,887.8    29.0    4,087.5    18.6     587.0    104.8        0.3    35.7      -    77
               90   BLADEX                    PA      DP    5,870.9    32.8    4,781.8    55.2    2,123.4    38.0     701.3     42.4       91.3    12.1      -    85
               91   INDUSTRIAL GUATEMALA      GT      DP    5,771.5    22.2    2,719.8   232.8    4,323.1    16.5     412.9     57.5       26.3    27.9    0.7    80
               92   BANESTES                  BR      S     5,618.1     8.4      895.0       -    2,294.6       -     520.6     N,D,          -       -    5.3     -
               93   DE BRASILIA, BRB          BR      S     5,354.3    39.1    2,543.7    42.4    4,232.6    39.6     507.6     57.0       22.1    22.4    1.8    94
               94   DEL TESORO                VE      S     5,060.9    48.9    1,117.4    92.4    3,316.6    67.7     307.2     78.8      483.4    51.3    8.0   104
               95   FIAT                      BR      FO    5,057.6    67.3    4,079.2    75.7    3,809.5    57.6     678.2     54.1       35.6    16.0    0.8   110
               96   POPULAR DOMINICANO        DO      DP    5,017.5    12.2    3,123.9    15.7    3,425.8    11.7     396.2     55.6       12.3    28.1    0.7    84
               97   GNB SUDAMERIS             CO      FO    4,981.2    19.1   2,168.97    22.8    2,964.8    16.7    325.36    31.24      -10.3    19.2    1.6    88
               98   DE COSTA RICA             CR      S     4,949.0    15.2    2,999.1    24.5    3,618.3    18.3     576.2     23.4       -5.3     8.1    2.5    87
               99   DE RESERVAS               DO      DP    4,902.8    -1.2    3,026.9   -12.5    2,641.2     3.2     390.2     40.5       -6.3    20.8    2.0    72
              100   MERCEDES-BENZ             BR      FO    4,891.9    40.3    4,405.8    50.9       27.4   -45.0     685.6     38.3       98.0    11.2    0.3   100


                                                                                                                                2012 - 2013 / AMÉRICAECONOMÍA 53


BANCOS GI.indd 53                                                                                                                                                      17/8/12 16:51:56
Do you know how much will be spent
                 daily in cloud-based services?


              Tech investment in cloud-based
                services will triple, reaching


                                  US$   44 billion
                                                 in 2013
                                                     Source: IDC


INHOUSE engAETECNO 2 PAG.indd 2                           17/08/2012 15:12:26
Learn this and more
                                                            The first regional web portal
                                                            devoted to business-oriented
                                                            telecom and information technology
                                                            services in Latin America.


                          News, tutorials, events,
                surveys, communities, company
               directories and industry providers                      A valuable tool for CEOs,
                                                                       directors, managers and
                                                                       professionals who look for
                                                                       updated information on
                                                                       innovation and IT trends


                                                 www.aetecno.com
                                                     A product of


INHOUSE engAETECNO 2 PAG.indd 3                                                                     17/08/2012 15:14:23
BANKING
SPECIAL                 LATIN AMERICA´S 250 BIGGEST BANKS


                                                                                                  )
                                                                   FO ON S$ UNE


                                                                                                 %
                                                                                                1


                                                                                              1(
                                                                                               1


                                                                                            01
                                                                                   U J
                                                            AS A OF U UNE


                                                                                           01


                                                                                             )

                                                                                          S1
                                                            11 RIA S$ 2011


                                                                                            S
                                                            MI POS /10 EDIT


                                                                                          %
                                                            PO RIA OF IN


                                                            MI OFI US$ NE 2


                                                                                       F IT
                                                                               S$ E 2
                                                            20 EDI %) L


                                                                                      1(

                                                                                     AN
                                                                  T S N S$
                                                                CR /10 ( TOTA
                                                                VA NS IN J


                                                                 VA ONS OLIO


                                                                                      )


                                                                                   RO
                                                                           F U UN
                                                                DE 11 CR
                                                               LL IT (%


                                                                                   Y1
                                                                PR OF JU


                                                                           F U NE


                                                                                  LO
                                                                  ION ITY )
                                                            MI ET EQ 10 (%


                                                            RE ) IN P
                                                                       S O IN J
                                                                      LL T S


                                                                      LL T F


                                                                       S O JU


                                                                               UIT
                                                                      LIO IN


                                                                       S IN


                                                                              ING
                                                                      11 IN


                                                                      S 1 IN
                                                                               IP

                                                                   MI SSE


                                                                   MI OR


                                                                  ION IN


                                                                           EQ
                                                                           SH


                                                                  SIT N


                                                                   (% N


                                                            RK FORM
                                                                  ION S


                                                                N 1/
                                                               11 T P
                                                               SE T IO


                                                              PO TIO


                                                              /10 TIO
                                                                         IO


                                                               RT TI


                                                               LL T S
                                                               LL U
                                                               11 A
                                                            R


                                                                       ON
                                                           Y


                                                                         I
                                                         NE
                                                       TR


                                                            20 TAL


                                                            DE RIA


                                                                     R
                                                                    RI


                                                                   RN
                                                       OW
                                                     UN


                                                                 PE
                                                                TO
                                NK


                                                                VA


                                                                VA
              11


                                                               10
                                                               TU

                                                               N-
                                                   CO
                              BA


                                                            NO
            RK


             101    BCSC                      CO       DP       4,823.2    20.1   2,827.88     9.5    3,923.8    16.5   536.05    56.72       32.6    21.2    4.9    91
             102    CIUDAD                    AR       DP       4,557.2     9.0    2,698.2    26.7    3,681.6    10.1     598.3    56.6        2.7    18.9      -    89
             103    SANTANDER URUGUAY         UY       FO       4,536.2    15.0    3,490.1    13.0    4,089.0    16.4     447.3    13.5      -57.9     6.0    0.1    92
             104    GMAC                      BR       FO       4,506.0    11.3    1,498.8    28.9    1,375.8    43.2     796.2    52.1       71.3    13.1    2.0    90
             105    BANREGIO                  MX       DP       4,487.2    47.1    1,776.9    31.7    1,592.6    27.2     276.3    25.9      140.5    18.8    1.8   109
             106    CITIBANK N.A ARGENTINA    AR       FO       4,351.7    12.5    2,044.5    23.0    2,559.5    16.0     604.5    29.5      -51.7     9.8      -    93
             107    EXTERIOR                  VE       DP       4,341.9    49.9    2,767.2    58.0    3,893.2    54.1     354.7    81.9       42.1    46.2    0.5   111
             108    CREDICOOP                 AR       DP       4,276.2    23.2    1,939.4    30.1    3,719.8    25.7     315.0    41.6       36.3    26.4      -   101
             109    G & T CONTINENTAL         GT       DP       4,183.8    12.7    1,938.1   220.5    3,157.4    14.4     333.9    43.8       64.3    26.3    1.6    97
             110    INDUSTRIAL DE VENEZUELA   VE       S        4,175.0    65.6      224.7    26.0    2,560.7    43.7     172.1     3.6      -74.0     4.1   43.4   123
             111    CRÉDITO DEL PERÚ PANAMÁ   PA       FO       4,076.1    52.2    3,823.7    48.1      169.1    87.3      73.1    16.6      385.2    45.4      -   118
             112    CITIBANK COLOMBIA         CO       FO       4,069.8     7.2   2,580.04    19.3   2,626.71    12.9    746.52   37.21       -2.1    10.0    3.4    95
             113    AV VILLAS                 CO       DP       3,975.6    16.5   2,605.63    14.0   3,168.69    24.3    486.37   42.03       23.2    17.3    3.2   103
             114    BARCLAYS BRASIL           BR       FO       3,923.5    93.2       N,D,       -      472.1   118.1     467.8    24.6      -32.8    10.5      -   139
             115    DEL DESARROLLO RURAL      GT       DP       3,906.7    21.6    2,383.6   419.9    3,263.9    26.2     460.1    55.3       32.7    24.0    0.9   106
             116    SANTANDER COLOMBIA        CO       FO       3,882.7    12.8   2,687.84    26.7   2,498.67    13.1    409.14   34.30       24.5    16.8    1.8   102
             117    BANCARIBE                 VE       DP       3,829.6    38.0    2,573.7    55.7    3,358.7    43.4     336.9    66.9       71.2    39.7    0.5   115
             118    BVA                       BR       DP       3,715.3    69.5    2,492.9   111.4    2,502.1    53.1     355.0    24.2      -13.3    13.6    0.4   133
             119    BANCOLOMBIA PANAMÁ        PA       FO       3,639.2    26.5    1,861.1    30.5    2,106.4    19.5     514.5   105.0       42.4    40.8      -   112
             120    PATAGONIA                 AR       DP       3,627.2    45.5    1,826.9    44.2    2,627.4    51.1     543.8    29.6      -17.5    10.9      -   125
             121    AGRICOLA                  SV       DP       3,583.5    -3.5    2,390.8     0.5   2,531.17    -4.1    560.34   61.20       61.7    21.8    3.2    96
             122    STANDAR BANK              AR       FO       3,555.9    28.3    1,746.2    23.5    2,606.4    32.3     269.9     6.4        2.6     4.8      -   116
             123    MIFEL                     MX       DP       3,519.7    34.4    1,137.2    -2.0    1,908.1    48.6     114.4     4.2      -13.6     7.3    4.2   120
             124    IBI BM                    BR       DP       3,519.4    28.4    1,308.1    23.2       52.6   -66.8   1,668.0    96.1      -38.0    11.5   39.3   117
             125    SOFISA                    BR       DP       3,471.4     6.4    1,045.3   -15.4    1,500.3    10.8     497.4     5.3      286.6     2.1    4.0   105
             126    BBM                       BR       DP       3,320.4    16.0      266.5    33.4      421.7    35.2     336.1    17.2      605.6    10.2    9.3   113
             127    POPULAR C. RICA           CR       DP       3,195.1    21.6    2,075.1    17.8    2,265.2    21.6     627.9    39.4      147.0    12.5    2.8   119
             128    CLASSICO                  BR       DP       3,190.6    23.3        0.4   -40.0        0.1   -82.0   2,524.6   -40.8     -553.4    -3.2    0.0   121
             129    FIDIS                     BR       DP       3,095.8    38.9    2,713.8    41.6    2,105.4    29.7     261.0    20.0      107.0    15.3    0.4   131
             130    CORP BANCA VENEZUELA      VE       FO       3,065.4    21.0    1,926.8    23.2    2,416.4    34.9     236.6    36.7      137.8    31.0    3.6   122
             131    GLOBAL BANK               PA       DP       3,045.5    21.1    2,419.7    42.6    2,247.4    22.6     237.5     3.8      -61.6     3.2      -   124
             132    DEUTSCHE BANK CHILE       CL       FO       2,979.1    27.5          -       -      685.9     0.1     201.2    20.2       -7.3    20.1      -   128
             133    JP MORGAN                 MX       FO       2,954.8    67.8       10.7    27.9       38.9   -34.1     363.7    -5.9     -183.1    -3.3    0.0   150
             134    LAGE DE LANDEN            BR       FO       2,889.4    36.9    2,442.7    31.9       32.9       -     306.4   -10.7     -289.1    -7.0    2.0   137
             135    GUAYAQUIL                 EC       DP       2,856.2    18.0    1,478.2    25.1    2,177.4    20.9     218.3    25.5       55.7    23.4    1.1   126
             136    INDUSVAL                  BR       DP       2,828.5    65.7      904.3    31.1      956.0    26.8     361.2   -37.6   -2,306.8   -20.8    5.3   153
             137    HIPOTECARIO               AR       DP       2,800.6     0.9    1,252.5    13.2    1,286.7    22.7     736.1    11.5        9.8     3.1      -   114
             138    PACÍFICO                  EC       DP       2,687.9    22.6    1,234.9    36.6    2,207.2    23.1     333.7    25.0          -    15.0    0.6   132
             139    COMERCIAL BHD             DO       DP       2,671.8    10.5    1,304.5     9.1    1,151.0     6.2     255.4    41.0       -1.3    32.1    2.0   127
             140    RURAL                     BR       DP       2,671.6    22.9    1,589.1    51.0    1,862.6    24.9     256.6    -7.1     -158.1    -5.6    0.0   134
             141    HSBC CHILE                CL       FO       2,569.3    24.1      504.2     7.8    1,248.8    15.1     192.2    -8.0     -589.6    -8.3      -   138
             142    INVEX                     MX       DP       2,546.7    39.5      643.0    19.0      753.3    38.3     206.9     7.2        9.2     7.0    2.0   146
             143    BBVA URUGUAY              UY       FO       2,542.1   167.9    2,078.9   152.8    2,353.1   167.8     189.0   -14.6   -2,401.7   -15.5    0.2   228
             144    BAC INTERNACIONAL         PA       FO       2,524.0    10.9    1,012.4     3.5    1,482.1    19.7     973.5   101.3       17.8    20.8      -   130
             145    NACIONAL DE CRÉDITO       VE       DP       2,478.2    38.1    1,260.5    45.7    2,198.9    46.4     233.0    19.7      301.4    16.9    3.2   148
             146    MORGAN ST. DEAN           BR       FO       2,420.1    39.8       N,D,       -      705.4     0.4     582.2    29.2      -18.1    10.0      -   151
             147    FALABELLA                 CL       DP       2,419.9    43.8    1,755.2    45.2    1,271.8    67.5     238.6    24.9       49.9    20.9    3.6   156
             148    ATLÁNTIDA                 HN       DP       2,402.0    23.9    1,255.6    10.7    1,562.8    21.2     218.8    13.7       -9.8    12.5    1.7   141
             149    MONEX                     MX       DP       2,394.8    45.7      261.4    65.6      268.9    54.9     196.4    28.4       28.1    28.9    1.5   157
             150    CNH CAPITAL               BR       FO       2,360.5    11.0    1,445.9    22.6      339.9   -38.4     626.2    47.5      277.3    15.2   14.6   136


            56 AMÉRICAECONOMÍA / 2012 - 2013


BANCOS GI.indd 56                                                                                                                                                         17/8/12 16:52:00
ESPECIAL
                    LATIN AMERICA´S 250 BIGGEST BANKS                                                                                                               BANCOS


                                                                                                )
                                                                                                E


                                                                                               %
                                                                   FO ON S$ UN


                                                                                              1


                                                                                            1(
                                                                                             1


                                                                                          01
                                                               RT TI F U N J
                                                               SE T IO U E


                                                                                         01


                                                                                           )

                                                                                        S1
                                                            11 RIA S$ 011


                                                                                          S
                                                            AS RIA S OF JUN


                                                            MI POS 0 (% IT


                                                                                        %
                                                            MI OFI S$ E 2


                                                                                     F IT
                                                                             S$ E 2
                                                                CR 0 (% TAL


                                                            PO ARIA NS O IO I


                                                                DE 11/1 RED


                                                                                    1(

                                                                                    AN
                                                                  T S N S$


                                                                VA F U NE 2
                                                                PR OF U JUN
                                                                                    )


                                                                                  RO
                                                                                  UN
                                                                VA ION S IN


                                                                                 Y1
                                                                 V IO FOL


                                                                                 LO
                                                                        /1 TO


                                                                  ION ITY )
                                                                                  C


                                                            MI ET EQ 10 (%


                                                            RE ) IN P
                                                                      S O IN J
                                                                                )


                                                                      S O JU


                                                                             UIT
                                                                      LIO IN


                                                                      S IN


                                                                            ING
                                                                      11 IN
                                                                      LL T


                                                                      LL T


                                                                      S 1 IN
                                                                             IP

                                                                   MI SSE


                                                                   MI OR


                                                                  ION IN
                                                                          FU


                                                                          EQ
                                                                          SH


                                                                  SIT N


                                                                   (% N


                                                            RK FORM
                                                                  ION S


                                                                N 1/
                                                               11 IT P


                                                              PO TIO


                                                              /10 TIO
                                                               LL IT


                                                               LL T S
                                                               LL U
                                                               11 A
                                                            R


                                                                       ON
                                                           Y

                                                         NE
                                                       TR


                                                            20 TAL


                                                            DE RIA
                                                                    ED


                                                                     R
                                                                   RN
                                                       OW
                                                     UN


                                                                 PE
                                                                TO
                                 NK


                                                                VA
               11


                                                               10
                                                               TU

                                                               N-
                                                   CO
                               BA


                                                            20


                                                            NO
             RK


             151    BAC SAN JOSÉ              CR      FO    2,312.2      13.9   1,693.9      17.1   1,600.2       3.3     256.3    22.9      158.0    17.9    0.6   140
             152    DE CÓRDOBA                AR      FO    2,210.1      34.4     943.8      28.8   1,863.1      35.1     101.7     6.1      154.3    11.9      -   158
             153    ITAÚ URUGUAY              UY      FO    2,204.8      27.5   1,587.1      40.9   2,081.1      28.7     123.8    -5.9     -156.8    -9.6    0.1   152
             154    HSBC FINANCE BM           BR      FO    2,155.4      40.6   1,028.7      54.2     987.4      52.1   1,055.9   131.3      145.6    24.9    0.5   167
             155    BBVA PANAMÁ               PA      FO    2,149.3   6,198.6   1,638.4   7,847.7   1,672.1   7,188.9     295.0    20.1       -3.5    13.6      -     -
             156    NVO. DE SANTA FE          AR      DP    2,091.4       8.3   1,107.4      31.9   1,484.5       3.0     235.1    24.5      -28.9    20.8      -   142
             157    AGRÍCOLA DE VENEZUELA     VE      DP    2,075.0      86.3     930.9      29.5     393.8      30.7     169.9     0.9       43.4     1.0   32.0   204
             158    CITIBANK EL SALVADOR      SV      FO    2,074.3     -10.8   1,114.1     -14.4   1,589.2      -1.6    331.65   10.52      500.2     6.3    6.1   129
             159    BANKPAR                   BR      DP    2,068.8      34.2     198.1      13.4     545.8      26.8     104.7    13.1       60.3    25.0   57.3   166
             160    BGN                       BR      DP    2,058.8      28.7   1,345.8      30.3   1,439.6      34.3     532.7     2.9      -87.5     1.1    1.3   161
             161    BARCLAYS MÉXICO           MX      FO    2,056.9      64.7       0.0         -       0.0         -     225.3    49.1          -    43.6      -   193
             162    PRODUBANCO                EC      DP    2,046.5      12.2     927.2      11.2   1,650.2       8.6     176.5    15.0          -    17.0    0.5   147
             163    INTERNACIONAL CHILE       CL      DP    2,039.9      57.1   1,419.7      63.8   1,539.2      62.8     113.2    10.0       63.7    17.7    1.1   188
             164    SCOTIABANK C. RICA        CR      FO    2,017.4      10.4   1,452.0       8.7   1,596.3       4.7     237.3     1.8      447.4     1.5    2.0   145
             165    DE OCCIDENTE HONDURAS     HN      DP    1,996.5      23.0     883.4       6.6   1,519.5      24.6     148.8    12.2        6.4    16.3    2.3   160
             166    FICOHSA                   HN      DP    1,993.7      18.3   1,113.5      14.8   1,120.3      25.8     173.6    13.2       22.8    15.2    0.3   155
             167    TOKYO-MITSUBISHI UFJ      BR      FO    1,971.7      91.1      97.9      91.2     287.5      26.0     664.6     0.7      -56.5     0.2    0.0   214
             168    BANESCO                   PA      FO    1,958.3      56.7     766.1      56.4   1,731.2      60.3     180.5    21.7       60.8    24.0      -   192
             169    MULTIBANK                 PA      DP    1,931.2      21.1   1,137.5      21.0   1,446.6      15.6     195.2     9.3      -14.1     9.5      -   163
             170    GOLDMANSACHSDOBRASILBM    BR      FO    1,889.2      91.3      N,D,         -     160.5     117.6     291.7   291.7      808.1   200.0      -   225
             171    HSBC EL SALVADOR          SV      FO    1,883.5       2.2   1,194.7       4.5   1,370.7       6.0    258.67    6.88        5.9     5.3    5.3   144
             172    SUPERVIELLE               AR      DP    1,881.7      43.7   1,130.6      60.3   1,459.3      50.0     164.2    11.5       23.0    14.0      -   185
             173    PARANA                    BR      DP    1,860.9      44.4   1,094.4      40.5     941.6      44.0     695.9   181.7      817.2    52.2    6.9   189
             174    VENEZOLANO DE CRÉDITO     VE      DP    1,847.9      36.4     721.0      50.6   1,591.2      40.1     210.3    33.4       84.0    31.8    0.3   180
             175    SCOTIABANK EL SALVADOR    SV      FO    1,813.9      -6.0   1,337.4      -5.4   1,250.9     -10.2    216.17    7.42      109.4     6.9    5.4   143
             176    BAC HONDURAS              HN      DP    1,800.3       1.3     905.6       2.9     938.1       3.6     163.6    11.7       23.2    14.3    0.7   149
             177    INTER. DE FINANZAS        PE      DP    1,798.9      17.7   1,157.1      19.5   1,224.5       9.3     126.3    10.7       13.1    16.9    0.6   168
             178    WESTLB                    BR      FO    1,789.4       9.0     212.7     -43.6     167.4     -28.7     322.7     6.7      207.2     4.1    2.0   159
             179    BANESE                    BR      S     1,749.9      29.4     818.3      69.0   1,322.9      16.2     127.6    24.5      143.9    38.4    1.1     -
             180    CSF                       BR      DP    1,746.1      24.4     313.1      15.9     150.8     -27.2     378.1    21.7      -37.5    11.5   74.0   175
             181    CACIQUE                   BR      DP    1,742.5       9.1   1,247.3      32.9   1,234.3      26.2      70.8    70.8   14,772.1   200.0    2.1   162
             182    MI BANCO                  PE      DP    1,741.5      23.1   1,311.2      18.2   1,190.4      34.5     147.0    17.9       -8.6    24.4    2.4   174
             183    DE LA PRODUCCIÓN          NI      DP    1,728.9      45.0     501.0       6.2   1,437.1      55.6     110.8     9.1       62.3    16.3    2.9   197
             184    MERCANTIL STA. CRUZ       BO      DP    1,714.1       1.3     999.8      28.1   1,519.6       1.6     128.1    10.8       20.0    16.9    0.2   154
             185    CAJA DE AHORROS           PA      S     1,713.4       7.6   1,209.6      10.9   1,390.0       8.0     205.9     2.9      -75.3     2.8      -   164
             186    TOYOTA                    BR      FO    1,710.6      22.7   1,133.0      40.1     615.7     -33.6     184.2    13.8      -20.4    15.0    0.4   177
             187    FONDO COMÚN               VE      DP    1,706.9      21.7     721.3       8.4   1,508.8      22.4     180.0     5.1      125.6     5.6    1.5   176
             188    BOLIVARIANO               EC      DP    1,692.2      16.1     835.8      22.8   1,410.5      14.4     135.6    11.9          -    17.6    0.4   170
             189    AGROMERCANTIL             GT      DP    1,658.7      22.7     943.8     303.6   1,371.2      25.2     133.9    11.3       10.3    16.8    2.9   181
             190    INTERNACIONAL ECUADOR     EC      DP    1,655.8      13.0     883.2      16.7   1,437.2      13.3     136.4    12.8          -    18.8    0.6   169
             191    THE BANK OF NOVA SCOTIA   PA      FO    1,625.0       2.9   1,365.6      11.8   1,565.8       3.9      17.6    19.1        7.4   217.1      -   165
             192    CITIBANK N.A. BRASIL      BR      FO    1,618.9      36.2      42.8     -47.0      N,D,         -     732.2    72.7      435.3    19.9    0.0   198
             193    NVO. COMERCIAL            UY      FO    1,614.9      18.2   1,230.9      29.8   1,415.0      18.2     199.8    -2.0     -225.3    -2.0    0.3   179
             194    BONSUCESSO                BR      DP    1,608.5      42.3     970.7      49.3   1,009.0      46.7     259.8    18.8      -43.8    14.5    2.2   203
             195    BANPARA                   BR      S     1,579.8      48.2     605.4      41.5   1,296.0      50.7     194.4    26.0       50.7    26.7    1.0     -
             196    IBM                       BR      FO    1,537.2      40.9     100.8     -19.1     827.6     121.2     163.0     6.1        8.3     7.5    3.1   208
             197    CITIBANK PERÚ             PE      FO    1,519.9      22.6     650.6       2.4   1,067.0      30.0     206.6    13.2       78.3    12.8    1.8   194
             198    INDUSTRIAL BRASIL         BR      DP    1,508.4      30.8     786.9      45.9     722.1      37.3     264.3     4.5       -3.9     3.4    2.1   202
             199    BOAVISTA INTERATLANTICO   BR      DP    1,505.5      28.5       2.3     173.7      N,D,         -   1,306.4    36.2       48.6     5.5   35.5   201
             200    ITAÚ ARGENTINA            AR      FO    1,504.0       5.3     918.7      19.3   1,068.2      10.4     141.2    -5.7      -62.9    -8.1      -   172


                                                                                                                                   2012 - 2013 / AMÉRICAECONOMÍA 57


BANCOS GI.indd 57                                                                                                                                                         17/8/12 16:52:05
BANKING
SPECIAL                  LATIN AMERICA´S 250 BIGGEST BANKS


                                                                                                  )
                                                                   FO ON S$ UNE


                                                                                                 %
                                                                                                1


                                                                                              1(
                                                                                               1


                                                                                            01
                                                                                   U J
                                                            AS A OF U UNE


                                                                                           01


                                                                                             )

                                                                                          S1
                                                            11 RIA S$ 2011


                                                                                            S
                                                            MI POS /10 EDIT


                                                                                          %
                                                            PO RIA OF IN


                                                            MI OFI US$ NE 2


                                                                                       F IT
                                                                               S$ E 2
                                                            20 EDI %) L


                                                                                      1(

                                                                                     AN
                                                                  T S N S$
                                                                CR /10 ( TOTA
                                                                VA NS IN J


                                                                 VA ONS OLIO


                                                                                      )


                                                                                   RO
                                                                           F U UN
                                                                DE 11 CR
                                                               LL IT (%


                                                                                   Y1
                                                                PR OF JU


                                                                           F U NE


                                                                                  LO
                                                                  ION ITY )
                                                            MI ET EQ 10 (%


                                                            RE ) IN P
                                                                       S O IN J
                                                                      LL T S


                                                                      LL T F


                                                                       S O JU


                                                                               UIT
                                                                      LIO IN


                                                                       S IN


                                                                              ING
                                                                      11 IN


                                                                      S 1 IN
                                                                               IP

                                                                   MI SSE


                                                                   MI OR


                                                                  ION IN


                                                                           EQ
                                                                           SH


                                                                  SIT N


                                                                   (% N


                                                            RK FORM
                                                                  ION S


                                                                N 1/
                                                               11 T P
                                                               SE T IO


                                                              PO TIO


                                                              /10 TIO
                                                                         IO


                                                               RT TI


                                                               LL T S
                                                               LL U
                                                               11 A
                                                            R


                                                                       ON
                                                           Y


                                                                         I
                                                         NE
                                                       TR


                                                            20 TAL


                                                            DE RIA


                                                                     R
                                                                    RI


                                                                   RN
                                                       OW
                                                     UN


                                                                 PE
                                                                TO
                                 NK


                                                                VA


                                                                VA
              11


                                                               10
                                                               TU

                                                               N-
                                                   CO
                               BA


                                                            NO
            RK


             201    ALIADO                    PA       DP       1,501.8    15.4     935.4    24.3   1,217.2    13.9    144.3     6.7      15.4     9.2      -   187
             202    NACIONAL DE BOLIVIA       BO       DP       1,471.0     3.1     863.1    28.0   1,207.7    -2.0    116.9    12.2      13.6    21.0    0.7   173
             203    BANIF                     BR       FO       1,458.9    36.7     679.8    30.1     754.1    45.5    114.6     1.3     -30.4     2.3    9.9   210
             204    CARONÍ                    VE       DP       1,455.8     9.5     403.4    -6.1   1,265.6     6.9    167.2     3.7     -65.3     4.5    3.7   184
             205    HSBC C. RICA              CR       FO       1,428.1     6.2     862.2    -3.1   1,088.4     2.7    153.7     2.6     -63.2     3.4    1.9   182
             206    FINANCIERO                PE       DP       1,423.4    28.3     937.9    21.8     947.1    30.6    126.4     5.5      -4.7     8.7    1.4   205
             207    AMERICAN EXPRESS          MX       FO       1,416.5    16.9     597.5    -2.0     578.4     7.1    301.9    34.3      73.2    22.7    4.9   195
             208    JOHN DEERE                BR       FO       1,401.7    41.8   1,317.6   430.0      27.1   -96.4    197.0    13.2     -16.7    13.4    0.7   223
             209    BISA                      BO       DP       1,390.1     4.3     618.7    24.0   1,145.9     6.0    140.7     7.3     -43.6    10.4    0.2   183
             210    RABOBANK CHILE            CL       FO       1,389.8    28.5     897.4    54.7     322.0   -25.6    123.6     0.3     106.3     0.5    1.3   209
             211    CITIBANK N.A. URUGUAY     UY       FO       1,322.4    83.7   1,074.5    65.6   1,248.0    90.1     74.4     5.3     -13.8    14.3    0.0     -
             212    BICSA                     PA       FO       1,313.9    39.2     880.9    31.6     724.6    26.9    134.5     7.5      11.8    11.2      -   229
             213    HSBC COLOMBIA             CO       FO       1,296.4    46.6     847.2    50.7     638.4    18.0    122.9   -17.9     -71.2   -29.2    4.0     -
             214    VOLVO                     BR       FO       1,288.4     6.3     984.0    11.9     122.3   -40.9    276.8    19.3     -29.8    14.0    1.3   196
             215    BANSI                     MX       DP       1,262.3    -1.3     518.2    17.3     406.9    10.3     95.8     4.1     -11.6     8.6    3.2   190
             216    MULTIVA                   MX       DP       1,260.2   -12.9     691.6    45.7     792.1    56.5    157.2     1.3     -57.3     1.7    3.3   171
             217    DEL PAÍS                  HN       DP       1,257.1    23.6     836.9    20.7     850.2    29.2    115.0    12.0      17.2    20.9    0.3   217
             218    CIBANCO                   MX       DP       1,231.7   105.2     191.7   581.9     675.3   211.6     65.8     2.9     -30.2     8.8    0.1     -
             219    HSBC BANK PERÚ            PE       FO       1,213.8    20.2     654.1     5.1     904.2    95.6    111.4    -9.3      -2.5   -16.7    2.8   218
             220    HONDA                     BR       FO       1,204.9    26.1   1,110.9    27.0     988.0    22.4    143.7    15.9      40.0    22.2    1.1   227
             221    HSBC HONDURAS             HN       FO       1,204.6    15.5     527.6    -1.8     715.6    12.4     95.6     0.6     -56.5     1.3    1.8   212
             222    TRIANGULO                 BR       DP       1,199.0    19.3     708.4    25.5     744.3    19.4    236.3    12.6      -1.5    10.7    7.0   219
             223    AGRÍCOLA DE CARTAGO       CR       DP       1,196.5    16.5     462.0    21.8   1,018.0    15.9     92.8     7.3      51.9    15.7    2.0     -
             224    FATOR                     BR       DP       1,184.0    70.9      75.4    50.7     303.8    62.8    269.8    -3.3    -129.4    -2.4    1.3     -
             225    BAC EL SALVADOR           SV       DP       1,183.7     0.5    782.67     1.3    936.32     6.9   130.13   10.03      41.4    15.4    2.7   200
             226    VE POR MÁS                MX       DP       1,169.0    17.1     736.9    11.6     642.8    15.1     98.1     4.2      80.8     8.5    1.6   220
             227    SCOTIABANK REP. DOM.      DO       FO       1,158.4     8.7     771.5    11.5     930.1     6.0    197.0    16.4       8.1    16.6    2.4   211
             228    REFORMADOR                GT       DP       1,151.3    19.0     650.6   300.0     912.6    14.4    105.6     7.5      10.8    14.3    3.2   226
             229    COMAFI                    AR       DP       1,147.0    12.8     589.7    23.0     868.6    22.3     93.9    16.7      -5.4    35.5      -   216
             230    SAN JUAN                  AR       DP       1,141.5    36.6     144.3    33.1     714.3    48.0    268.6    29.0     -26.0    21.6      -   237
             231    ES BANK                   PA       DP       1,125.3     9.8   1,109.0    10.7   1,056.9     9.2     65.0     7.6     150.2    23.4      -   215
             232    BANCENTRO                 NI       DP       1,121.5   -12.2     448.5    14.2     848.2   -16.8     98.7     7.4      32.3    14.9    1.7   191
             233    COMPARTAMOS               MX       DP       1,099.8    41.6     966.1    48.6     241.8    69.2    515.4    86.1      26.0    33.4    1.9   247
             234    CRÉDITO BOLIVIA           BO       FO       1,089.7    16.1     638.2    29.4     942.6    18.5     92.2     6.4     -19.3    13.8    0.4   230
             235    LEON                      DO       DP       1,077.8     3.4     610.6    -6.7     877.4     8.0     97.6     6.8     -24.3    13.8    1.8   213
             236    CREDIT SUISSE             MX       FO       1,077.3    21.6       0.0       -      66.1    -9.9    166.1     5.8     217.9     6.9      -   233
             237    BANCOOMEVA                CO       DP       1,074.3       -     999.6       -     482.3       -     82.5     3.4         -     8.3    4.8     -
             238    AHORRO FAMSA              MX       DP       1,051.7    25.7     824.2    27.0     817.1    30.8    162.7    22.0      22.2    27.1   14.3   236
             239    PSA FINANCE               BR       FO       1,035.0    10.6     906.5    28.6     613.8    -9.2    182.0     4.8      -0.8     5.3    4.4   231
             240    CREDICORP                 PA       FO       1,033.6     3.6     574.8     7.1     858.2     2.4    119.5     8.1      39.4    13.6      -   221
             241    CITIBANK N.A. GUATEMALA   GT       FO       1,023.9    15.9     455.6    -5.3     633.2    -4.9    129.2    14.9      54.7    23.1    7.8   234
             242    CITIBANK PANAMÁ           PA       FO       1,015.7   -26.2     676.0   -10.7     823.0   -28.3    136.8     2.8     -23.5     4.0      -   178
             243    CITIBANK VENEZUELA        VE       FO       1,015.5    -8.4     415.9    30.7     765.6    -1.0    171.1    18.8   1,240.3    22.0    2.4   206
             244    PAULISTA                  BR       DP       1,001.4    14.3     217.3    20.2     474.1    44.1     74.7     4.0     183.4    10.6    3.1   235
             245    BANCOPPEL                 MX       DP         992.6    63.3     311.4    98.9     854.1    63.6    115.6     0.3     103.1     0.5   20.8     -
             246    ING BANK                  BR       FO         984.8   -16.7     136.4    17.6     260.3    -9.0    340.5    17.8     112.2    10.5    3.1   199
             247    DE LOS TRABAJADORES       GT       DP         957.7    28.1     521.0   424.5     803.9    30.2     79.8     6.7      11.1    16.7    3.4   248
             248    AUSTRO                    EC       DP         951.4    19.8     559.7    23.2     812.1    18.8     76.5     8.2         -    21.4    2.8   244
             249    DISCOUNT                  UY       FO         947.5    19.3     315.9    27.3     868.6    19.4     78.9    -1.1    -117.4    -2.9    0.1   243
             250    HSBC BANK URUGUAY         UY       FO         925.4    34.8     705.6    32.8     875.0    35.2     50.4    -9.4    -323.5   -37.3    0.0     -


            58 AMÉRICAECONOMÍA / 2012 - 2013


BANCOS GI.indd 58                                                                                                                                                     17/8/12 16:52:10
BASE PAGINA COMPLETA.indd 1   16/08/2012 12:18:51
AméricaEconomía   THE GLOBAL ISSUE   2012 - 2013
                                                   LOMO_GLOBAL.pdf

Global issue 2012 2013

  • 1.
    500 BUSINESS THE THE LARGEST BEST COMPANIES SCHOOLS www.americaeconomia.com GLOBAL ISSUE Special reports on Latin America FOR THE GLOBAL MARKET The The and 2012 - 2013 US$ 5.- TAPA GLOBAL 201 2.indd 1 17/8/12 16:59:30
  • 2.
    9 Countries GET TO KNOW US +177,450 Direct Jobs in Latin America. ACTIONS CREATING VALUE OVER 120 YEARS LEVERAGING OUR GROWTH TO SATISFY OUR CONSUMERS, CREATING ECONOMIC AND SOCIAL VALUE, +215 37 SIMULTANEOUSLY. Million consumers served. Bottling plants in Latin America. +10,000 OXXO stores. +8 Million transactions per day at OXXO stores. FEMSA is a leading company that participates in the beverage industry through Coca-Cola FEMSA, the 20% largest bottler of Coca-Cola products in the world; in the retail industry through FEMSA Comercio, operating OXXO, the largest and fastest-growing chain of stores in Latin America, and in the beer industry, through its ownership of the second largest equity stake in Heineken, one of the world’s largest breweries with operations in over 70 countries. Economic interest in Heineken. Investor Relations: (52.81) 8328.6167 - investor@femsa.com.mx Corporate Communications: (52.81) 8328.6046 - comunicacion@femsa.com www.femsa.com @femsa /femsa BASE PAGINA COMPLETA.indd 1 16/08/2012 9:43:59
  • 3.
    BASE PAGINA COMPLETA.indd2 16/08/2012 9:43:59
  • 4.
    BASE PAGINA COMPLETA.indd3 16/08/2012 9:43:59
  • 5.
    CONTENIDO GLOBAL ISSUE Special reports on Latin America FOR THE GLOBAL MARKET 6 40 CHINA`S LABYRINTH SEND US YOUR TALENT Very few Latin American companies A growing number of global Business have succeeded in selling something Schools are focusing their attention beyond commodities. Why? to Latin American students. 10 44 AFTER THE BONANZA GO WEST, YOUNG MAN Latin America`s largest companies An increasing number of Latin showed a strong if slower growth in American companies are becoming 2011. full-fledged multilationals. 14 46 AMERICAECONOMIA´S 500 MEET THE MULTILATINA From Big Oil to mega retailers and How much do they sell, invest and telcos, meet Latin America`s biggest hire? Where? The new Latin global corporate players . players are a force to reckon. 34 48 THE NEW MBA IN THOU WE TRUST Latin America`s best Business Big global banks are suffering their Schools face a new challenge: how to worst times ever. Latin American innovate. banks are booming. For how long? COVER DESING: ÁLVARO ARAYA URQUIZA 36 52 THE B-SCHOOL’S WHO’S WHO LET THE GOOD TIMES ROLL The region`s best school ranked The region´s 250 largest banks by faculty, publications, global net- ranked by assets and other financial works and other relevant criteria. ratios. 2012 - 2013 / AMÉRICAECONOMÍA 3 CONTENIDO GI.indd 3 17/8/12 16:38:04
  • 6.
    MEMO PUBLISHER & EDITOR Elías Selman C. NEW CHALLENGES O EXECUTIVE EDITOR Carlos Tromben ver the last 25 years, but on their pension systems. Cities ART DIRECTOR especially from the late may experience an increase in drug- Álvaro Araya Urquiza nineteen nineties onwards, related violence (if authorities fail to DEPUTY EDITOR Latin America underwent some of tackle the status quo). Many regions Rodrigo Lara Serrano the most dramatic changes in its are facing severe water shortages. EDITORS history. Democracy was restored, This is the environment in Fernando Chevarría (Lima) Paula Pacheco (São Paulo) economies were opened up, and tariff which AméricaEconomía operates, Samuel Silva (Santiago) barriers lowered. Latin American providing its readers with insightful Gisela Raymond (Guayaquil) governments on the left and right information, analysis and news from REPORTERS deregulated a Latin American Ximena Bravo, David Cornejo y Tamara Muñoz (Santiago), Graziele Dal-Bo (São Paulo), María Cristina Prezet y Natalia Vera (Lima), markets, while perspective. David Santa Cruz (Mexico City), Jenny C. González (Bogota), introducing strict The www. 500 BUSINESS THE THE Gonzalo León (Buenos Aires), Hebe Schmidt (Madrid), Loreto Urbina rules on banking LARGEST BEST americaeconomia. (London), Montserrat Nicolás (Washington D.C.) COMPANIES S C H O O L S (a precaution that com news site and GLOBAL CONSEJEROS EDITORIALES has paid off today). AméricaEconomía’s Peter Hakim (Washington), Enrique García (Caracas) China was not on regional and local ISSUE PHOTOGRAPHY EDITOR anyone’s radar back stories offer the Miguel Candia DESIGNERS then, but it is now clearest window César Leyton y Pablo Reyes fueling one of the through which ILLUSTRATIONS most sustained to observe Latin Patricio Otniel Special reports on Latin America PROOF READER periods of economic FOR THE GLOBAL MARKET American business. Mario Pozo V. growth in Latin The The This Global Issue AMÉRICAECONOMÍA INTELLIGENCE America. is a compilation of (surveys and Special Pojects) Latin Americans and AméricaEconomía’s DIRECTOR Jaime Contreras Soria are now healthier, best-selling SENIOR RESEARCHER richer, but also products, rankings Andrés Almeida more critical of and news stories. FINANCE RESEARCHER Catherine Lacourt their political You will find the institutions, and region’s largest AMÉRICAECONOMÍA.COM EDITOR more demanding as consumers and companies, ranked by revenue and Lino Solís de Ovando citizens. Millions of Latin Americans other indicators, the best MBA JOURNALISTS Daniela Arce, Alejandra Araya, Patricio Díaz, Gastón Meza, Pablo are first-generation professionals; programs and business schools, Albarracín, Christopher Holloway, Jennifer Roig, Loreto Oda, David they are the major force behind both and the Multilatinas ranking, a Montolio. the region’s consumer boom and Who’s Who of Latin America’s most- DEVELOPMENT Leonardo Cabrera, Richard Suing, Óscar Quiroz, Carla Vilches. declining birth rates. globalized business groups and But this bonanza could end badly companies. GENERAL MANAGER Eduardo Albornoz if Latin America does not prepare for Go on. You won’t regret it. the future. The region’s commodity- COO Rodrigo Guaiquil C. driven boom is suffocating innovation, exposing its economies CFO Carlos Quevedo Barra to the dreaded Dutch disease, and leaving major environmental MARKETING CHIEF Consuelo Alcaíno liabilities for future generations to clean up. Twenty or thirty years ONLINE PRODUCT MANAGER from now, major Latin American Carol Kast countries will pass demographic Elías Selman C. OPERATIONS MANAGER thresholds which will put pressure Publisher & editor Matías Agurto CHAIRMAN Robert R. Paradise AMÉRICAECONOMÍA is published monthly by Nanbei Ltd. Printed in Gráfica Andes, postage paid. Periodical publication. Registry PP09-0011. Certificate of lawfulness Title Nº 4090. Certificate of content lawfulness Nº 3346. AMÉRICAECONOMÍA is a Nanbei Ltd. monthly publication. AMÉRICAECONOMÍA magazine (USPS #023106) is published monthly in Santiago, Chile by AMÉRICAECONOMÍA. AMÉRICAECONOMÍA is distributed in the United States by DL Distribution Group, 7301 SW 100 Ct, Miami, FL. 33173-4651 PH: (305) 595-5505. Periodicals Postage paid at Miami, Florida. POSTMASTER: send address changes to DL DISTRIBUTION GROUP 7301 Miami, FL 33173-4651 4 AMÉRICAECONOMÍA / 2012 - 2013 MEMO GI.indd 4 17/8/12 16:39:24
  • 7.
    Aviso Falso BASE PAGINACOMPLETA.indd 1 26/04/2012 12:21:15
  • 8.
    CHINA ACCESS R PATRICIO OTNIEL 6 AMÉRICAECONOMÍA / 2012 - 2013 CHINA GI.indd 6 17/8/12 16:39:55
  • 9.
    CHINA RESTRICTED Latin American companies have been unable to achieve success when they try to sell anything in China apart from raw materials. If they continue with their current strategies, perhaps they never will. Carlos Tromben A t first sight, Harbin is local firm Aviation Industry Corporation carmona family, which has become in not a typical Chinese of China (AVIC). However, as oil prices recent years a successful producer of city. Located in the rose, the jets become less competitive turbines for hydroelectric and wind en- northeast of the coun- and they decided to halt production. ergy projects. In the nineteen eighties, it try, its architecture and Embraer’s plan was to use the plant became a leading global producer of port street plan, marked with in frozen Harbin to build bigger, more cranes, the enormous structures which wide boulevards and sophisticated aircraft, like the ERJ-190, can load and unload containers in just Orthodox churches, bear which can carry up to 100 passengers. a few minutes. The firm opened offices witness to the thousands of expatriated However, it never obtained authoriza- in Hong Kong and Beijing in order to Russians who arrived before and after tion from the Chinese government to attack the Chinese market. the Bolshevik Revolution of 1917. But build it there. Without approval, the “Our first project in China was to its Siberian climate (which allows it to plant in Harbin was destined to fail and supply cranes to the Port of Shanghai,” hold one of the world’s most famous only intervention by Brazilian president says the company’s vice-president Sofia ice sculpture festivals) is not exactly the Dilma Rousseff during her official visit to Pescarmona. “We began building with right one to lift the spirits of the seven China last April resur- a Chinese subcon- Brazilian employees of airplane maker rected the possibility In Latin America, tractor and the added Embraer. Especially given that its fac- of definitive approval value parts we did in tory in the city has not been very active which has still not business and Mendoza.” since April 2011. Like other industrial firms from Latin been granted. Embraer’s diffi- friendship are However, the company was soon America which set up shop in China in culties in China are kept separate: in trouble with the a bid to participate in the expansion of no exception. The Chinese contractor this enormous market, Embraer’s Chi- Eastern giant has be- in China, doing which became a com- nese operations have been trapped in a labyrinth of regulations, permits and come one of Latin America’s biggest business means petitor and, in 1992, founded Shanghai political shenanigans which have kept it trading partners, with exchanging favors. Zhenhua Port Ma- a heartbeat away from definite closure annual trade hitting chinery (SZPM). “It for months. US$200 billion, and received huge subsi- It is an unusual situation for a company several companies dies from the Chinese which has become the pride of Brazilian from the region have taken the plunge state, they gave them a port, ten vessels, industry, building up a position in the of investing directly in China. But they and very cheap money, and it was prac- global market for regional jets - aircraft have little to show for their efforts. tically impossible for us and the rest with up to fifty seats, such as Embraer’s Many have even preferred to with- of the world’s suppliers to compete,” ERJ-150. In China, Embraer produced draw. They include Argentina’s IMPSA, recalls Pescarmona. Today, SZPM has these airplanes in association with the the industrial arm of the powerful Pes- more than 70% of the global market for 2012 - 2013 / AMÉRICAECONOMÍA 7 CHINA GI.indd 7 17/8/12 16:40:02
  • 10.
    CHINA port cranes, many of which are sold in Latin America. “Today the world sees the price of these cranes is rising,” says Pescarmona, speaking at the Multilatinas Forum, organized by AméricaEconomía. Her analysis is clear: “China’s vocation is to be an industrial producer of added value products which has also been our vocation for the last hundred years,” the Argentinean says. “Asia continues to be an interesting market, which we tackle from Malaysia, but not the domestic Chinese market.” The story has aspects in common with Dilma Rousseff that of Beijing Copper Tube, a corpora- tion created in 1987 between Chilean in Beijing: put- mining firm Codelco, Chilean copper ting in a word tube and cable fabricator Madeco and the for Embraer Chinese government to produce copper tube in a city which had previously only But putting this into practice is harder a clear example. “Embraer is a great produced lead pipe. The promising deal than it sounds. Despite an auspicious company thanks to its declared aim of was one of the steps which led Chile to name for the Chinese market, the Brazil- buying in the best parts and systems for become the first country in the world to ian bus maker Marcopolo has not been its airplanes,” says Richard Abulafia, recognize China as a market economy able to repeat in China the production vice-president of the Teal Group, an which helped its subsequent accession models which it has successfully trans- aerospace and defense industry consul- to the World Trade Organization. planted to South Africa, Egypt and, most tancy. “China, on the other hand, buys However, faced recently, India. parts and systems from anyone who is with the joint venture’s China’s “China is the on- prepared to hand over its technology, poor results, the Chil- ly one of our plants just like the former USSR used to do.” ean companies pulled vocation is to in which we do not IMPSA’s Sofia Pescarmona makes a out in 1991, selling their shares to the Chi- be an industrial make buses, we just produce parts and similar argument. “China will not let us produce in their country unless we nese government. producer with pieces,” says Rubens give up our knowledge, which it has For Osvaldo Rosa- de la Rosa, Marco- cost us a great deal to develop over les, director of foreign high added value, polo’s Brazilian chief the last hundred years. We prefer not trade at the United Nations’ Economic but it is a highly executive. “Why do we not have the same to,” she says. China experts explain that cultural Commission for Lat- nuanced market. authorizations as lo- differences lie behind many of the in America and the cal producers? Hav- problems faced by Latin American Caribbean, the pivot ing volume is a big firms which have tried to break into shift in international competitive advan- the country which refers to itself as the economic relations poses a huge chal- tage and China does not share it.” Middle Kingdom. That concept reduces lenge to Latin American governments the rest of the world to a periphery on and business. COMING AND GOING the outside trying to look in. “One possible stance is passive: let The problem is that the powerful model “They remember that there have China drag us along, which is what they of industrialization which China is only been 200 years in the history of are doing,” says Rosales. “Another is to try pursuing is very different from that mankind in which China and India were and participate in the Asian value chains which has produced numerous success not the main powers,” says ECLAC’s which are built around China.” stories in Latin America. Embraer is Rosales. 8 AMÉRICAECONOMÍA / 2012 - 2013 CHINA GI.indd 8 17/8/12 16:40:21
  • 11.
    CHINA The limits of Guanxi T he case of Pollo Campero is a classic case has opened up a bit, but the economy is still centralized did not see the upside of Guanxi. “By the way nego- of misunderstood Guanxi. The Guatemalan and controlled by the state.” tiations were going, we had the sensation that the fast-food chain, whose secret chicken recipe Regulations required Pallo Campero to operate for two only thing that they wanted was the chicken recipe is even sought by Kentucky Fried Chicken, has suc- years before it could sell franchises in China, which is so they could make it themselves.” cessfully opened four hundred of its restaurants. how the Guatemalans planned to drive growth. During Gutierrez continued in China for another two years Three hundred are in Latin America, while another those two years, the government evaluated the quality to secure approvals from the authorities that will let hundred are spread across the United States, Spain, of their business and its contribution to the community. him return when the company is better prepared to the Middle East, Indonesia, and India, making it one Meanwhile, Gutiérrez realized that the Chinese market tackle the market. of Latin America’s most globalized businesses. In was totally different from anything he had seen. Firstly, “Lots of people tell us that if we had stayed we would 2006, the firm was attracted by the opportunity the Chinese consumers demand more innovation than other have quickly recovered the investment, although Chinese market represented and so began work on consumers. “In order to maintain a permanent flow of it is not clear how many years of losses and how opening its first restaurant in Shanghai. It studied customers, we had to be changing the recipes and pro- much investment we would have needed to make locations, marketing and regulations before taking motions, not every month like before, but every week,” a return.” It took KFC more than ten years. Others, the plunge. The plan was to have between 300 and says Gutiérrez. “The same characteristic which sees the such as Burger King and Pizza Hut, never made it. 500 restaurants within five years. By the middle Chinese change mobile phones every three months meant In addition, staying in China would have forced of 2007, it had just four. Today the chain is not they are always asking for new recipes and products Campero to divert resources and talent which it present in China. at the restaurants where they dine. We were not fully is today using to expand in new markets such as “The state intervenes in the whole process: it owns prepared for that.” Europe and the United States, where it opened a large the ground so you have to pay rent, it interferes in the However, what led Gutierrez to finally abandon China Pollo Campero restaurant in the middle of Disney supplier structure and is permanently supervising the was the attitude of the Chinese businessmen to whom World, the successful tourism and entertainment development of the business,” says Pollo Campero he planned to sell the franchise. complex in Florida. CEO Juan Jose Gutierrez from Guatemala. “It was “They asked us for two years’ grace, paying nothing for “The most curious thing is that 38% of the clients to be expected: this is a Communist country which use of the brand and our recipes,” says Gutierrez who in that restaurant are Chinese.” To a culture which has seen Dutch, term describes the network of recipro- Like networking, guanxi is a more Portuguese and British merchants come cal favors and connections on whose binding system than its equivalents in and go, the West’s economic presence strength business in China depends. the West. “When you recommend some- looks like another passing fad. Accord- Guanxi predates the Communist Party one in China, you are not just passing ing to Michael David, senior consultant and its bureaucracy and begins with an on a number, but extending a bond and for Boston Consulting Group in Beijing, individual’s own family, expanding imposing on the recommended party a the multilatinas are novices in this game through school, further education, etc. duty not to fail; if they do, you must bear who have a lot to learn from other for- Guanxi does not mean networking as it responsibility,” explains Julie Kim. eign firms which have been in China is often understood in Latin America, but Many foreigners are perplexed by how for longer. “You have to commit to a rather an exchange of duties and rights, their Chinese colleagues operate. “The long-term vision as the learning curve a chain of favors. The giving is known deadlines are often different. I have heard is long,” he says. as Mianzi, and describes the attributes more than one Westerner complain of China’s cultural nuances and subtle- of an individual who could be useful to having gone to eight meetings or seven ties represent an initial challenge on a the network. The giving back is called karaoke sessions and still not being able scale which is difficult to underestimate. Renqing and is a kind of debt which to close the deal,” says Kim. “In Latin America, people say don’t mix can be cashed in the future but whose business with friendship. But in Asia, it is content and size is unknown. GUANXI IN ACTION totally different,” says Julie Kim, director Each time that two people meet for Chilean shipping firm Compañía of the Asia-Pacific Center of the Diego the first time, a significant part of the Sudamericana de Vapores and Mexi- Portales University in Santiago, Chile. conversation is dedicated to exploring can bakers Bimbo are two of the few “This is the crucial difference one has to and measuring the implications of each multilatinas which have managed to understand to do business there.” other’s Guanxi. For Michael David, “it develop operations in China, although This style and tradition can be ex- is not so different from other business middling in size. pressed in the key word Guanxi. Formed communities in the sense that one has Many companies from the region by the symbols Guan (meaning to mea- to develop relationships and trust. In have found success in China when sure, to seal, to involve) and Xi (to be, China, this is more important than a they have sought inputs for products connection, relation, to tie, to bind), the written agreement.” which will be sold in Latin America. 2012 - 2013 / AMÉRICAECONOMÍA 9 CHINA GI.indd 9 17/8/12 16:40:25
  • 12.
    CHINA But trying to enter with more elaborate in China in the 1950s under Mao. Some Mexican firms fell into this products and services can prove a head- Chilean businessman Andrónico trap. Cemex spent years announcing its ache. “In China, it is often unclear how Luksic, whose family controls Madeco, expansion into China but instead wa- one can make things work,” says BCG’s regrets the decision sell his business in gered on the US housing boom. Today Michael David. “It is a huge and very China. “It´s a shame; if we had stayed it is licking its wounds. In February, diverse country and it’s no use relying we´d have hit the jackpot”, he says. Lorenzo Zambrano announced that on the support of one well-connected Impatience is leading mining firm the cement giant now has permits and individual.” Vale and steelmaker Gerdau, both from a local partner. Leopoldo Cedillo, CEO Embraer is an interesting example Brazil, to drop some investments in China. of auto-parts maker Metalsa recently in this respect. Its Chinese operations Vale´s plans to become the world’s largest announced that the company will enter were headed by Guan Dongyuan, an mining company ran into a Chinese Wall, in China within five years. engineer with degrees from the Univer- when it tried, but failed, to open an iron Latin American impatience is com- sity of Sao Paulo and the China Europe ore distribution center in China. “They pounded by Chinese ignorance. “Latin International Business School. He was don’t say no, America lacks previously a representative of the min- but they take visibility,” ing company Vale in China. Will his a long time says David Guanxi prove as strong as than that of to respond,” who opened Jianwei Zhang, chairman of Canada’s says Jose Car- BCG’s Shang- Bombardier, Embraer’s eternal rival los Martins, hai office in in regional jets? An engineer from the Vale’s direc- 1992. “The University of Tianjin, Zhang was a tor of mar- region would municipal civil servant between 1975 keting, sales benefit greatly and 1982. He completed an MBA at the and strategy. from student University of Montreal and obtained a “Time passes exchanges doctorate in administration from the and the mo- with China same institution, before joining Bom- ment comes bardier. Bombardier recently signed a when you just give Pollo Campero and by send- ing more cultural and deal with Commercial Aircraft Corp of up.” wanted to open culinary products.” China (COMAC) to enter the market for Marcelo Claure, But this has not narrow-body aircraft with 100-149 seats, Brightstar´s Bolivian 500 restaurants been easy either. Pol- similar to those its Brazilian rival was not authorized to produce. The agree- founder, has failed to replicate its cellphone in China. Today it lo Campero, Latin America’s most in- ment surprised many analysts. “It is a distribution business in has none. ternational fast-food deal which does not make any sense the enormous Chinese chain, failed to break [for Bombardier],” says Teal Group’s market. “He lacks the the Chinese market, Abulafia. patience to deal with following the same However, some interpret the agree- the red-tape,” says a colleague. recipe which has brought it success from ment with Bombardier as pure Guanxi. David agrees that it is an error to think India to the United States. It opened its The Canadians´ real interest in China of China as a market which “is waiting first restaurant in Shanghai in 2007, but lies with its railroad division which has for you and your products.” Dozens of plans to open 500 restaurants within signed juicy contacts for metro systems foreigners and local firms are compet- five years did not proper. Today Pollo in Guanzhou and Shenzhen, a train line ing in an economy which is anything Campero has no restaurants in China for Beijing airport and for high velocity but Third World. (see box on previous page). trains. “Relations are crucial in China,” “China is not a backwater backward That’s bad news for Latin America’s says Bombardier CEO Pierre Beadoin in market,” he warns. “Many companies industrial ambition: unless we change a corporate video. “To achieve long-term made the mistake of delaying their strategy and become more patient, Latin success, one must have patience.” plans to enter China, believing that it America’s relationship with China will And the Canadians have been very was too early. Today they realize that continue to be based on exporting raw patient: Bombardier struck its first deal it is too late.” materials. ■ 10 AMÉRICAECONOMÍA / 2012 - 2013 CHINA GI.indd 10 17/8/12 16:40:30
  • 13.
    INTRODUCCIÓN PREPARING FOR THE DOUBLE DIP Latin America’s 500 biggest companies increased their sales, but at a slower rate than in the previous two years. The likelihood of hard times will be the big test after the bonanza. T he crisis which is terrifying struck Ireland the following year and predator, the financial markets first Europe sometimes reminds have continued to grow in drama and attacked the young defenseless bathers one of the soundtrack to the intensity since 2011 and still there is and then terrorized the entire beach, movie Jaws. The jabbing bass no sign of resolution while the coastguards (played by the chords which hit Greece in late 2009 Like Steven Spielberg’s terrible European Central Bank, the IMF and 2012 - 2013 / AMÉRICAECONOMÍA 11 500 INTRODUCCION GI.indd 11 17/8/12 16:41:35
  • 14.
    INTRODUCTION the governments involved) have been THE BILLIONAIRES´ CLUB unable to do anything to neutralize Nº OF COMPANIES WITH SALES ABOVE US$1 BILLION SOURCE: AMÉRICAECONOMÍA INTELLIGENCE the threat. Although the euro is living through 600 500 500 its darkest epoch so far, many econo- 437 456 mists (and not necessarily those known 500 419 for their pessimism) believe that the Old Continent still faces years of slow 334 400 302 growth. Add some disappointing key 262 indicators in the United States and you have a gloomy scenario to which 204 206 219 300 187 Latin American companies will have to learn to adapt. 200 IT’S BEGINNING TO HURT A BIT 100 The 500 companies on the Améri- caEconomía ranking enjoyed a very 0 profitable 2010, while 2011, without 2000 2001 2002 2003 2004 2005 2006 2007 2008 2009 2010 2011 being bad, showed signs of slowing sales in a number of key countries and sectors. For example, large mining companies, in 2011 of half that size (which is still some interesting facts. In Brazil, the which in 2010 saw their revenues jump good, but…), while decline of steelmak- by an astonishing 53%, saw an increase sectors linked to do- Sales slowed ing (Usiminas, Ger- mestic consumption, dau and Aperam) and The Top 500 Through Time such as construction sharply in Brazil the oil industry was and retail saw growth key: sales at Petrobras slow to a similar or and Mexico, and its distribution YEAR SALES VAR. MINIMUM greater extent. moderated in arm were stagnant 1991 324,069.8 3.9% 196.0 There are signifi- and, given the oil 1992 375,102.7 15.7% 166.5 cant variations from Chile, but grew in giant’s relative size, 1993 402,867.2 7.4% 162.6 country to country. this had an impact 1994 512,087.0 27.1% 193.5 These are related not Argentina, Peru on the overall figures 1995 1996 544,318.2 553,580.3 6.3% 1.7% 215.5 267.2 only to the economic and Colombia for South America’s cycle, but also to largest economy. 1997 645,180.0 16.5% 350.4 movements on the Figures on Mexico 1998 629,847.0 -2.4% 316.0 ranking and the addi- must be treated with 1999 624,527.4 -0.8% 278.5 2000 881,208.1 41.1% 357.7 tion and removal of caution, as the car 2001 855,427.7 -2.9% 331.7 some companies from the list. industry in general does not publish 2002 831,571.6 -2.8% 324.9 In 2011, there were some impor- results (Volkswagen is the only excep- 2003 938,208.0 12.8% 362.0 tant developments: for a start, sales tion), so it is underrepresented in the 2004 1,122,496.6 19.6% 464.3 slowed significantly in both Brazil figures. However, they fell as did key 2005 1,364,398.2 21.6% 526.2 and Mexico. In Chile, the slowdown sectors such as telecommunications 2006 1,581,618.0 15.9% 570.3 was moderate. Argentina saw slight (46.6%), cement (10%) and electric- 2007 1,955,734.7 23.7% 821.8 growth while Colombia and Peru re- ity. 2011 was a bad year for the local 2008 1,882,521.8 -3.7% 719.0 mained robust. subsidiary of Spain’s Iberdrola, less 2009 2,004,608.2 6.5% 901.6 bad for Cemex and mediocre for the 2010 2,338,493.4 16.7% 1052.9 WHAT’S HAPPENING? businesses of billionaire Carlos Slim. 2011 2,457,750.9 5.1% 1,109.5 A look inside each country throws up And it was definitely an awful year 12 AMÉRICAECONOMÍA / 2012 - 2013 500 INTRODUCCION GI.indd 12 17/8/12 16:41:40
  • 15.
    INTRODUCCIÓN The Top 500 by sector RK NUMBER OF COMPANIES TOTAL SALES (US$ MILLIONS) VAR % PARTIC. 2011 SECTOR 11/10 % 2011 05 06 07 08 09 10 11 2005 2006 2007 2008 2009 2010 2011 1 OIL & GAS 34 35 32 37 38 38 39 377,666.0 447,073.3 494,022.7 506,996.6 454,060.0 537,149.2 592,555.3 10.3 24.1 2 RETAIL 71 72 70 74 74 74 70 140,382.6 162,591.0 196,662.9 187,507.1 230,735.7 281,654.6 284,439.8 1.0 11.6 3 TELECOMMUNICATIONS 45 43 41 37 35 36 34 124,363.2 141,873.6 170,013.1 148,210.3 184,088.1 205,493.1 190,129.7 -7.5 7.7 4 ELECTRICITY 45 46 44 43 53 49 45 92,450.9 104,646.7 130,432.0 119,015.4 147,918.2 167,669.3 162,142.1 -3.3 6.6 5 AUTOMOBILES/AUTOPARTS 29 31 33 33 31 40 39 76,646.6 91,997.7 123,943.5 118,340.7 122,098.9 153,380.6 152,207.8 -0.8 6.2 6 MINING 27 36 33 32 31 35 44 64,959.4 103,226.0 126,094.4 107,332.4 97,383.1 149,119.5 185,294.6 24.3 7.5 7 STEEL & METALLURGY 42 36 40 36 24 27 27 90,537.8 94,909.0 147,002.5 138,910.3 94,523.9 127,444.3 136,376.3 7.0 5.5 8 CONGLOMERATES 25 29 14 15 17 15 20 86,221.7 108,558.0 92,377.7 88,093.6 110,111.5 123,439.6 144,094.5 16.7 5.9 9 AGRIBUSINESS 15 14 20 19 17 18 17 26,965.8 26,685.1 58,003.6 64,640.5 84,006.5 108,425.8 114,448.7 5.6 4.7 10 BEVERAGES & BREWING 18 19 15 15 17 16 16 49,835.4 58,308.4 63,686.9 54,849.0 73,723.4 79,009.8 80,831.0 2.3 3.3 11 FOODS 26 24 24 25 23 20 19 38,333.2 37,604.0 52,408.6 53,102.5 71,827.8 65,836.0 65,968.9 0.2 2.7 12 CONSTRUCTION 9 9 13 13 20 23 22 10,384.2 12,761.3 21,110.4 23,125.7 41,292.2 54,156.9 56,145.8 3.7 2.3 13 TRANSPORT & LOGISTICS 19 15 17 19 18 18 20 29,761.5 23,521.4 31,737.8 35,454.1 36,448.5 46,787.7 54,882.1 17.3 2.2 14 ELECTRONICS 14 11 20 20 21 19 17 22,359.2 18,937.8 42,521.0 44,675.7 50,614.8 45,000.0 40,054.4 -11.0 1.6 15 PETROCHEMICALS 36 13 14 14 12 8 7 57,268.7 43,633.7 57,552.8 59,191.1 54,573.4 30,948.3 34,697.9 12.1 1.4 16 CHEMICALS & PHARMACEUTCALS 36 17 20 18 21 15 17 57,268.7 16,502.6 29,687.9 27,610.5 33,289.3 29,706.1 33,775.7 13.7 1.4 17 CEMENT 7 8 7 6 6 6 6 23,214.1 27,952.5 33,963.3 28,096.7 28,738.3 26,271.8 25,644.0 -2.4 1.0 18 PULP & PAPER 11 12 9 10 7 9 8 14,500.8 16,750.8 18,576.4 17,035.6 16,618.9 22,760.6 21,765.4 -4.4 0.9 19 BASIC SERVICES 8 3 6 6 6 6 5 11,125.1 4,733.5 11,526.5 9,846.7 13,508.4 18,798.3 17,878.3 -4.9 0.7 20 MASS MEDIA 7 7 6 5 5 5 5 9,403.7 10,854.6 12,237.4 10,475.1 13,484.7 15,894.2 15,492.4 -2.5 0.6 21 HEALTH SERVICES 3 4 6 6 8 5 5 2,409.1 3,244.3 7,153.9 7,764.4 10,791.7 10,137.6 10,644.0 5.0 0.4 22 GENERAL SERVICES - 5 2 2 2 2 2 - 9,125.2 7,779.2 7,025.3 8,906.9 9,441.4 9,539.0 1.0 0.4 23 MANUFACTURING - 4 8 8 6 5 6 - 4,006.9 13,310.4 12,037.3 8,501.8 8,360.5 8,783.6 5.1 0.4 24 TEXTILES & FOOTWEAR 5 4 2 2 4 6 2 2,969.6 3,664.8 3,130.5 2,169.0 4,853.9 8,291.8 2,996.5 -63.9 0.1 25 AEROSPACE 1 1 1 1 1 1 1 3,902.0 3,912.0 5,636.2 5,026.4 6,209.9 5,630.0 5,255.4 -6.7 0.2 26 MACHINERY & EQUIPMENT 3 2 3 4 3 2 3 4,528.6 4,543.8 5,163.1 5,989.9 6,298.4 3,726.8 5,050.6 35.5 0.2 27 SOFTWARE & DATA SERVICES - - - - - 1 3 - - - - - 2,396.4 5,018.0 109.4 0.2 28 PRINTING - - - - - 1 1 - - - - - 1,563.1 1,639.1 4.9 0.1 TOTAL 500 500 500 500 500 500 500 1,364,398.2 1,581,618.0 1,955,734.7 1,882,521.8 2,004,608.2 2,338,493.4 2,457,750.9 5.1 100.0 for Movistar. But both beverages and panies on the ranking rose from 65 to its sales by 34%, vaulting past by retail had an excellent 2011. 73; the number of Colombian firms Mexico’s Pemex. The strength of the figures for Co- from 26 to 28; and the Peruvians from Among the biggest movers on the lombia and Peru are explained by a 22 to 30. Meanwhile, the number of ranking was Colombia’s Ecopetrol, hyperactive extractive industries sector Brazilian, Mexican and Argentinean which scaled four places, becoming one (oil in the case of Colombia and min- companies all fell. A sign of the times of the region’s ten biggest companies ing in Peru) and other sectors which we are living through. for the first time. Another is Chile’s depend on internal demand in two As is now traditional, the oil giants Copec, a holding with fingers in many countries which have been enjoying dominated the top of the ranking. Petro- pies, which increased its sales by 74% spectacular growth. bras held onto the number one spot, and climbed eighteen places, thanks to Looking at regions, the going has with revenues totaling US$130.171 audacious investments in Colombia, been good on South America’s Pacific billion, but was closely followed by and overtook state-owned Codelco as seaboard. The number of Chilean com- Venezuela’s PDVSA, which lifted the country’s biggest company. 2012 - 2013 / AMÉRICAECONOMÍA 13 500 INTRODUCCION GI.indd 13 17/8/12 16:41:45
  • 16.
    INTRODUCTION The Top 500 by country RK NUMBER OF COMPANIES TOTAL SALES (US$ MILLIONS) VAR % PARTIC. 2011 COUNTRY 11/10 % 2011 05 06 07 08 09 10 11 2005 2006 2007 2008 2009 2010 2011 1 BRAZIL 204 207 211 212 226 223 215 534,077.5 610,088.2 825,018.2 746,786.7 956,790.2 1,162,356.3 1,165,978.6 0.3 47.4 2 MEXICO 138 111 134 126 119 117 110 490,811.1 532,016.3 645,721.6 588,245.5 580,695.4 600,552.6 598,752.7 -0.3 24.4 3 CHILE 54 63 55 60 55 65 73 103,043.9 137,953.1 158,345.4 164,322.2 152,323.9 211,358.9 253,394.4 19.9 10.3 4 ARGENTINA 36 41 36 35 33 32 30 65,585.2 88,240.6 107,736.8 117,493.5 105,376.7 113,654.2 124,793.6 9.8 5.1 5 VENEZUELA 11 12 7 7 6 3 3 98,294.2 118,360.8 109,557.5 147,586.6 85,001.7 101,218.6 132,027.2 30.4 5.4 6 COLOMBIA 30 35 31 28 30 26 28 36,037.8 46,945.5 58,597.4 59,484.0 65,998.8 74,797.4 97,268.4 30.0 4.0 7 PERU 12 18 15 21 19 22 30 16,368.3 26,085.2 29,091.7 32,300.0 29,782.7 40,320.3 57,315.6 42.2 2.3 8 ECUADOR 5 3 3 3 3 3 2 8,210.6 8,684.0 9,444.4 13,182.6 10,525.2 12,057.7 3,091.3 -74.4 0.1 9 COSTA RICA 4 3 3 3 3 3 3 6,072.0 4,640.4 5,594.2 6,180.8 6,624.3 7,051.9 7,450.2 5.6 0.3 10 BOLIVIA - - - - 1 1 1 - - - - 4,000.0 4,400.0 5,102.0 16.0 0.2 11 URUGUAY 2 2 2 2 2 2 2 2,188.3 2,230.7 2,933.0 2,725.9 3,295.8 3,851.9 4,733.4 22.9 0.2 12 BRAZIL/PARAGUAY - - - - - 1 1 - - - - - 3,450.5 3,652.1 5.8 0.1 13 PANAMA 2 2 2 2 2 2 2 1,817.7 2,294.0 2,756.5 3,273.9 3,253.4 3,423.2 4,191.6 22.4 0.2 14 EL SALVADOR 1 1 1 1 1 - - 791.7 928.3 938.0 940.0 940.0 - - - - 15 GUATEMALA 1 2 - - - - - 1,100.0 3,151.0 - - - - - - - TOTAL 500 500 500 500 500 500 500 1,364,398.2 1,581,618.0 1,955,734.7 1,882,521.8 2,004,608.2 2,338,493.4 2,457,750.9 5.1 100.0 The biggest profits were seen in growth in the Asian giant will slow. decisions taken in Berlin, Brussels and the extractive industries, at companies Will Latin America, a link in the chain other European capitals. An earthquake such as Brazil’s Vale and Petrobras between China and the developed or just a tremor. A Great White or just and Colombia’s Ecopetrol, followed world, feel the repercussions? How a catfish. Whatever the future holds, América Móvil and Ambev. We may serious will they be? It will depend on it is best to be prepared. ■ be rich in oil and mineral resources. But we also drink a lot of beer and soft drinks and could not live without ADECADEOFGROWTH our cellphones. The Top 500 over the last ten years, in millons of US$ SOURCE: AMÉRICAECONOMÍA INTELLIGENCE Mexico’s Pemex and Cemex once TOTAL SALES OF COMPANY again were at the bottom of the results SALES Nº 500 3,000,000 1200 table. The state oil giant saw its profits fall 70% and reported a negative net worth of US$13.903 billion. Is it time 2,500,000 1000 to find a new financial and ownership structure? It is not good to lack capital 2,000,000 800 in times like these, even when your only shareholder is the state. As this edition went to print, Eu- 1,500,000 600 rope’s leaders have begun cut the chat, raising the possibilities that the con- 1,000,000 400 tinent will escape financial collapse. However, the immediate future will be marked by minimal growth in the 500,000 200 Eurozone and a prolonged recession in many important countries. 0 00 Chinese exports will be hit and 2001 2002 2003 2004 2005 2006 2007 2008 2009 2010 2011 14 AMÉRICAECONOMÍA / 2012 - 2013 500 INTRODUCCION GI.indd 14 17/8/12 16:41:50
  • 17.
    Aviso Falso BASE PAGINACOMPLETA.indd 1 26/04/2012 12:21:15
  • 18.
    LATIN AMERICA´S LARGESTCOMPANIES SALES SALES VARIATION IN NET PROFITS NET PROFITS VARIATION IN E RK RK COUN COMPANY SECTOR 2011 US$ 2010 US$ SALES 2011 2010 PROFITS 20 11 10 -TRY Millions Millions 11/10 (%) US$ Millions US$ Millions 11/010 (%) M 1 1 PETROBRAS BRA Oil & Gas 130,171.7 128,000.0 1.7 17,759.4 21,119.5 -15.9 3 2 3 PDVSA VEN Oil & Gas 124,754.0 94,929.0 31.4 4,496.0 3,202.0 40.4 3 2 PEMEX MEX Oil & Gas 111,734.6 103,814.2 7.6 -6,559.1 -3,843.3 -70.7 4 4 VALE BRA Mining 55,014.1 49,949.0 10.1 20,158.7 18,047.1 11.7 3 5 5 AMÉRICA MÓVIL MEX Telecommunications 47,700.1 49,220.7 -3.1 5,940.3 7,378.6 -19.5 1 6 6 PETROBRAS DISTRIBUIDORA BRA Oil & Gas 39,654.0 39,655.8 -0.0 675.0 750.0 -10.0 7 8 ODEBRECHT BRA Conglomerate 33,659.0 28,203.3 19.3 24.0 1,486.0 -98.4 8 12 ECOPETROL COL Oil & Gas 33,194.8 21,610.7 53.6 7,801.1 4,194.3 86.0 1 9 7 JBS FRIBOI BRA Agribusiness 32,944.2 33,042.7 -0.3 -40.4 -181.7 77.8 10 9 WAL MART DE MÉXICO Y CENTROAMÉRICA MEX Retail 27,309.8 27,195.8 0.4 1,595.5 1,583.1 0.8 11 10 ULTRAPAR BRA Oil & Gas 25,941.6 25,496.2 1.7 452.5 459.3 -1.5 12 14 CBD - GRUPO PÃO DE AÇÚCAR BRA Retail 24,839.8 19,260.4 29.0 382.9 433.6 -11.7 13 15 TECHINT ARG Steel & Metallurgy 24,105.0 19,092.0 26.3 N.A. N.A. - 14 11 IPIRANGA PRODUTOS DE PETRÓLEO BRA Oil & Gas 22,461.0 21,795.5 3.1 356.0 312.0 14.1 15 33 EMPRESAS COPEC CHI Conglomerate 21,132.0 12,149.8 73.9 932.7 1,013.8 -8.0 16 13 COMISIÓN FEDERAL DE ELECTRICIDAD MEX Electricity 20,931.1 20,601.3 1.6 -1,230.9 65.5 -1,978.8 17 16 GERDAU BRA Steel & Metallurgy 18,875.6 18,841.2 0.2 1,069.3 1,285.9 -16.8 18 21 BRASKEM BRA Petrochemicals 17,686.4 15,301.2 15.6 -280.0 1,137.5 -124.6 19 17 ELETROBRÁS BRA Electricity 17,625.2 17,893.8 -1.5 1,989.9 1,349.1 47.5 20 20 CODELCO CHI Mining 17,515.3 16,065.9 9.0 2,055.4 1,876.3 9.5 21 49 TELESP BRA Telecommunications 15,528.7 9,456.3 64.2 2,321.8 1,439.7 61.3 22 23 CARREFOUR BRA Retail 15,333.0 14,745.6 4.0 N.A. N.A. - 23 28 VOLKSWAGEN BRA Carmaking 15,038.8 13,594.4 10.6 N.A. N.A. - 24 19 TELEMAR BRA Telecommunications 14,877.4 17,694.4 -15.9 68.5 1,140.5 -94.0 25 26 FEMSA MEX Beverages & Brewing 14,557.7 13,741.5 5.9 1,085.0 3,259.3 -66.7 26 29 CENCOSUD CHI Retail 14,515.4 13,226.1 9.7 548.3 632.5 -13.3 27 22 AMBEV BRA Beverages & Brewing 14,461.4 15,144.2 -4.5 4,606.6 4,538.1 1.5 28 27 BRF FOODS BRA Foods 13,704.1 13,612.6 0.7 729.0 482.6 51.1 29 24 CEMEX MEX Cement 13,546.2 14,434.5 -6.2 -1,371.3 -1,337.4 -2.5 30 36 YPF ARG Oil & Gas 13,124.3 11,013.0 19.2 1,225.9 1,443.9 -15.1 31 35 GRUPO ALFA MEX Conglomerate 13,103.6 11,044.5 18.6 373.2 398.9 -6.4 32 18 GRUPO VOTORANTIM BRA Conglomerate 12,618.0 17,705.1 -28.7 683.0 1,684.0 -59.4 33 34 WAL MART BRA Retail 12,509.0 11,356.2 10.2 N.A. N.A. - 34 37 BUNGE ALIMENTOS (1) BRA Agribusiness 12,340.0 10,899.0 13.2 N.A. N.A. - 35 39 COSAN BRA Agribusiness 12,214.7 10,712.0 14.0 1,565.8 359.7 335.3 36 30 ENERSIS CHI Electricity 11,993.7 13,193.1 -9.1 720.0 1,038.1 -30.6 37 46 MARFRIG BRA Agribusiness 11,667.0 9,529.7 22.4 -397.7 84.1 -572.9 38 45 NORBERTO ODEBRECHT BRA Construction 11,478.0 9,728.1 18.0 490.0 652.0 -24.8 39 32 FIAT AUTOMÓVEIS BRA Carmaking 11,464.0 12,405.3 -7.6 744.0 862.0 -13.7 40 31 GENERAL MOTORS DE MÉXICO (1) MEX Carmaking 11,425.3 12,850.0 -11.1 N.A. N.A. - 41 98 VIAVAREJO BRA Retail 11,204.1 5,165.1 116.9 48.2 -37.9 227.2 42 43 COCA-COLA BRA Beverages & Brewing 11,000.0 10,000.0 10.0 N.A. N.A. - 43 54 GRUPO BAL (1) MEX Conglomerate 10,935.4 9,033.8 21.1 1,112.6 729.3 52.6 44 64 ENAP CHI Oil & Gas 10,834.8 8,179.9 32.5 -67.0 70.1 -195.6 45 38 VIVO BRA Telecommunications 10,327.0 10,866.6 -5.0 1,610.0 N.A. - 46 58 CARGILL BRA Agribusiness 10,065.0 8,646.9 16.4 119.0 51.0 133.3 47 68 TENARIS ARG Steel & Metallurgy 9,972.5 7,711.6 29.3 1,331.2 1,127.4 18.1 48 44 FORD MOTOR COMPANY (1) MEX Carmaking 9,714.9 9,797.9 -0.8 N.A. N.A. - 49 47 GENERAL MOTORS BRA Carmaking 9,635.0 9,513.0 1.3 N.A. N.A. - 50 48 GRUPO BIMBO MEX Foods 9,586.7 9,487.2 1.0 382.1 436.8 -12.5 16 AMÉRICAECONOMÍA / 2012 - 2013 RANKING 500 GI.indd 16 17/8/12 16:42:41
  • 19.
    Nº 3 Juan José Suárez Coppel, CEO of Pemex: T he Mexican oil giant tried, but failed, to take a stake in Repsol. EBITDA EBITDA VARIATION TOTAL NET EQUITY WORK- EXPORTS NET NET EXPORT. Listed on ROE ROA OWNER- RK 2011 US$ 2010 US$ IN EBITDA ASSETS 2011 2011 US$ FORCE 2011 US$ MARGIN EBITDA AS % STOCK WEBSITE (www.) (%) (%) SHIP 11 Millions Millions 11/10 (%) US$ Millions Millions 2011 Millions (%) (%) OF SALES EXCHANGE 33,035.6 36,283.6 -9.0 319,410.4 175,839.0 81,918 22,912.2 10.1 5.6 13.6 25.4 17.6 Yes S petrobras.com 1 N.A. N.A. - 182,154.0 73,883.0 80,000 122,451 6.1 2.5 3.6 - 98.2 No S pdvsa.com 2 N.A. 51,985.7 - 109,936.2 -13,903.4 150,884 50,378 - -6.0 -5.9 - 45.1 Yes S pemex.com 3 31,997.0 27,717.9 15.4 128,896.0 76,487.6 79,646 34,653.1 26.4 15.6 36.6 58.2 63.0 Yes P vale.com 4 17,836.2 19,708.6 -9.5 67,797.8 20,479.5 158,694 - 29.0 8.8 12.5 37.4 - Yes P americamovil.com 5 1,051.0 1,076.0 -2.3 9,086.0 5,383.0 4,505 1,217.9 12.5 7.4 1.7 2.7 3.1 No S br.com.br 6 3,793.0 3,319.0 14.3 51,124.0 9,592.0 159,036 6,983.2 0.3 0.0 0.1 11.3 20.7 No P odebrecht.com.br 7 15,206.5 N.A. - 46,585.9 27,609.5 N.A. 15,270 28.3 16.7 23.5 45.8 46.0 Yes S ecopetrol.com.co 8 1,637.7 2,108.3 -22.3 25,275.0 11,016.0 125,000 2,552.2 -0.4 -0.2 -0.1 5.0 7.7 Yes P friboi.com.br 9 2,677.4 2,706.1 -1.1 16,133.7 9,533.0 238,128 - 16.7 9.9 5.8 9.8 - Yes P* walmartmexico.com.mx 10 1,083.4 1,066.1 1.6 7,326.3 2,959.3 9,055 - 15.3 6.2 1.7 4.2 - Yes P ultra.com.br 11 1,516.1 1,225.2 23.7 18,002.5 4,065.1 149,000 - 9.4 2.1 1.5 6.1 - Yes P grupopaodeacucar.com.br 12 N.A. N.A. - 31,364.0 N.A. 57,359 - - - - - - No P techint.com 13 709.0 572.0 24.0 4,084.0 1,218.0 2,434 - 29.2 8.7 1.6 3.2 - No P ipiranga.com.br 14 N.A. N.A. - 20,094.9 9,813.1 20,195 1,732.8 9.5 4.6 4.4 - 8.2 Yes P empresascopec.cl 15 N.A. N.A. - 64,987.0 22,454.3 98,389 - -5.5 -1.9 -5.9 - - No S cfe.gob.mx 16 2,479.4 3,323.5 -25.4 26,645.6 13,326.3 42,820 1,251.2 8.0 4.0 5.7 13.1 6.6 Yes P gerdau.com.br 17 1,946.5 2,893.6 -32.7 19,913.7 5,190.3 34,638 6,500 -5.4 -1.4 -1.6 11.0 36.7 Yes P braskem.com.br 18 3,385.0 3,603.3 -6.1 86,972.2 40,965.7 30,562 - 4.9 2.3 11.3 19.2 - Yes S eletrobras.gov.br 19 8,813.0 7,435.0 18.5 20,834.9 6,065.0 18,211 16,213.7 33.9 9.9 11.7 50.3 92.6 No S codelco.cl 20 5,535.4 3,277.1 68.9 34,913.1 23,097.2 7,000 - 10.1 6.7 15.0 35.6 - Yes P* telesp.com.br 21 N.A. N.A. - N.A. N.A. 59,490 - - - - - - No P* carrefour.com.br 22 N.A. N.A. - N.A. N.A. 24,000 1,945.9 - - - - 12.9 No P* volkswagen.com.br 23 4,599.2 6,189.6 -25.7 42,542.4 10,901.2 13,224 - 0.6 0.2 0.5 30.9 - Yes P telemar.com.br 24 2,188.8 2,246.9 -2.6 19,695.4 9,577.3 177,470 7,294 11.3 5.5 7.5 15.0 50.1 Yes P femsa.com 25 N.A. N.A. - 14,391.4 5,512.3 131,505 - 9.9 3.8 3.8 - - Yes P cencosud.cl 26 7,018.2 6,956.1 0.9 24,597.2 13,653.5 46,500 - 33.7 18.7 31.9 48.5 - Yes P* ambev.com.br 27 1,539.3 1,395.4 10.3 15,984.4 7,501.0 118,859 2,319.7 9.7 4.6 5.3 11.2 16.9 Yes P brasilfoods.com 28 1,487.6 1,756.2 -15.3 39,311.3 13,695.3 44,104 10,816 -10.0 -3.5 -10.1 11.0 79.8 Yes P cemexmexico.com 29 3,247.5 3,677.8 -11.7 12,823.8 4,336.8 10,400 - 28.3 9.6 9.3 24.7 - Yes P* ypf.com.ar 30 1,414.9 1,259.1 12.4 9,934.4 2,563.7 56,978 6,847 14.6 3.8 2.8 10.8 52.3 Yes P alfa.com.mx 31 2,826.0 3,520.0 -19.7 34,066.0 14,915.0 75,400 5,810.0 4.6 2.0 5.4 22.4 46.0 No P votorantim.com.br 32 N.A. N.A. - N.A. N.A. 81,504 - - - - - - No P* walmartbrasil.com.br 33 N.A. N.A. - N.A. N.A. 6,500 6,539.1 - - - - 53.0 No P* bunge.com.br 34 3,081.4 1,105.5 178.7 12,178.8 4,784.1 37,614 950.2 32.7 12.9 12.8 25.2 7.8 Yes P cosan.com.br 35 3,809.3 4,623.1 -17.6 26,337.3 7,470.8 10,884 - 9.6 2.7 6.0 31.8 - Yes P* enersis.cl 36 945.6 905.3 4.5 12,700.4 3,056.7 84,535 929.2 -13.0 -3.1 -3.4 8.1 8.0 Yes P marfrig.com.br 37 1,227.0 962.0 27.5 10,841.0 2,592.0 124,356 335.7 18.9 4.5 4.3 10.7 2.9 No P odebrecht.com 38 N.A. N.A. - 6,991.0 1,031.0 15,805 1,653.3 72.2 10.6 6.5 - 14.4 No P* fiat.com.br 39 N.A. N.A. - 4,140.6 912.4 13,000 - - - - - - No P* gm.com.mx 40 538.1 221.7 142.7 6,224.0 1,405.6 N.A. - 3.4 0.8 0.4 4.8 - Yes P pontofrio.com.br 41 N.A. N.A. - N.A. N.A. 53,000 - - - - - - No P* coca-cola.com 42 N.A. N.A. - 14,777.5 5,522.0 42,161 - 20.1 7.5 10.2 - - No P bal.com.mx 43 138.0 402.0 -65.7 6,202.5 381.0 2,896 259.8 -17.6 -1.1 -0.6 1.3 2.4 No S enap.cl 44 N.A. N.A. - 10,352.0 4,632.0 11,286 - 34.8 15.6 15.6 - - Yes P* vivo.com.br 45 N.A. N.A. - 4,536.0 735.0 8,491 4,024.1 16.2 2.6 1.2 - 40.0 No P* cargill.com.br 46 2,449.1 2,080.4 17.7 14,863.6 10,506.2 22,000 - 12.7 9.0 13.3 24.6 - Yes P tenaris.com 47 N.A. N.A. - N.A. N.A. 7,999 - - - - - - No P* ford.com.mx 48 N.A. N.A. - N.A. N.A. 21,400 1,857.2 - - - - 19.3 No P* chevrolet.com.br 49 1,018.2 1,175.6 -13.4 10,144.2 3,467.6 127,000 5,229 11.0 3.8 4.0 10.6 54.5 Yes P grupobimbo.com.mx 50 P: Privately-owned S: State-owned P*: Foreign-owned 2012 - 2013 / AMÉRICAECONOMÍA 17 RANKING 500 GI.indd 17 17/8/12 16:42:48
  • 20.
    LATIN AMERICA´S LARGESTCOMPANIES SALES SALES VARIATION IN NET PROFITS NET PROFITS VARIATION IN E RK RK COUN COMPANY SECTOR 2011 US$ 2010 US$ SALES 2011 2010 PROFITS 20 11 10 -TRY Millions Millions 11/10 (%) US$ Millions US$ Millions 11/010 (%) M 51 53 EXTRA BRA Retail 9,342.0 8,323.0 12.2 N.A. N.A. - 52 59 VOLKSWAGEN DE MÉXICO (1) MEX Carmaking 9,339.8 8,605.4 8.5 142.7 63.9 123.3 53 62 GRUPO MÉXICO MEX Mining 9,296.4 8,320.1 11.7 2,098.8 1,775.6 18.2 54 55 FALABELLA CHI Retail 9,267.9 8,923.3 3.9 811.3 882.5 -8.1 55 41 GRUPO ARCELOR MITTAL BRA Steel & Metallurgy 9,218.0 10,181.7 -9.5 -92.0 772.0 -111.9 56 70 TERNIUM ARG Steel & Metallurgy 9,157.2 7,382.0 24.0 N.A. 779.5 - 57 56 TIM BRASIL BRA Telecommunications 9,108.6 8,676.9 5.0 683.0 1,327.4 -48.5 58 42 GRUPO CAMARGO CORRÊA BRA Conglomerate 8,968.0 10,169.2 -11.8 460.0 664.0 -30.7 59 61 COCA - COLA FEMSA MEX Beverages & Brewing 8,941.7 8,377.3 6.7 761.0 793.6 -4.1 60 57 CSN BRA Steel & Metallurgy 8,806.7 8,672.7 1.5 1,975.7 1,510.2 30.8 61 67 CEMIG BRA Electricity 8,430.7 7,720.2 9.2 1,287.7 1,355.2 -5.0 62 63 NISSAN MEXICANA (1) MEX Carmaking 8,079.0 8,302.3 -2.7 N.A. N.A. - 63 52 TELÉFONOS DE MÉXICO MEX Telecommunications 8,034.8 9,195.7 -12.6 1,045.5 1,245.8 -16.1 64 66 COPEC COMBUSTIBLES CHI Oil & Gas 7,969.7 7,775.4 2.5 N.A. N.A. - 65 137 CASAS BAHIA BRA Retail 7,671.0 3,885.8 97.4 95.0 -152.0 162.5 66 83 CHRYSLER (1) MEX Carmaking 7,528.2 6,316.0 19.2 N.A. N.A. - 67 51 ESCONDIDA CHI Mining 7,419.5 9,211.5 -19.5 2,775.2 4,338.2 -36.0 68 76 ORGANIZACIÓN TECHINT MÉXICO MEX Steel & Metallurgy 7,213.2 7,076.1 1.9 N.A. N.A. - 69 75 TELMEX INTERNACIONAL MEX Telecommunications 7,057.0 7,139.8 -1.2 267.9 399.1 -32.9 70 72 CORREIOS E TELÉGRAFOS BRA Servicios Generales 7,047.0 7,281.1 -3.2 470.0 436.0 7.8 71 69 ORGANIZACIÓN SORIANA MEX Retail 7,045.1 7,587.3 -7.1 219.4 265.5 -17.4 72 60 GRUPO ANDRADE GUTIERREZ BRA Conglomerate 7,025.0 8,483.8 -17.2 796.0 624.0 27.6 73 95 INDUSTRIAS PEÑOLES MEX Mining 6,944.9 5,202.7 33.5 914.5 520.3 75.8 74 79 TAM BRA Transport & Logistics 6,927.4 6,829.1 1.4 -178.6 382.6 -146.7 75 73 CPFL ENERGÍA BRA Electricity 6,804.6 7,216.3 -5.7 815.9 923.2 -11.6 76 77 CLARO TELECOM BRA Telecommunications 6,597.0 7,025.8 -6.1 -131.0 780.0 -116.8 77 78 GRUPO MODELO MEX Beverages & Brewing 6,539.0 6,884.3 -5.0 856.4 805.2 6.4 78 80 EMBRATEL BRA Telecommunications 6,521.6 6,740.5 -3.2 208.6 433.9 -51.9 79 104 ALPEK MEX Petrochemicals 6,500.5 4,954.7 31.2 307.7 203.0 51.6 80 81 UNILEVER BRA Conglomerate 6,470.0 6,723.2 -3.8 N.A. N.A. - 81 65 USIMINAS BRA Steel & Metallurgy 6,345.0 7,779.6 -18.4 124.3 943.4 -86.8 82 112 ANTOFAGASTA PLC CHI Mining 6,076.0 4,577.1 32.7 2,130.0 1,820.7 17.0 83 86 SAM´S CLUB MEX Retail 6,004.0 6,142.8 -2.3 N.A. N.A. - 84 103 COPERSUCAR BRA Agribusiness 5,987.0 4,967.1 20.5 54.0 189.0 -71.4 85 84 GLOBO COMUNICAÇÕES E PARTICIPAÇÕES BRA Mass Media 5,854.0 5,233.0 11.9 1,156.0 1,463.0 -21.0 86 119 GRUPO EPM COL Basic Services 5,853.9 4,320.1 35.5 766.7 726.3 5.6 87 118 LAN CHI Transport & Logistics 5,585.4 4,390.5 27.2 320.2 419.7 -23.7 88 88 LOJAS AMERICANAS BRA Retail 5,438.5 5,634.7 -3.5 181.5 185.8 -2.3 89 90 GRUPO SALINAS MEX Conglomerate 5,393.0 5,597.2 -3.6 N.A. N.A. - 90 101 OXXO (FEMSA COMERCIO) MEX Retail 5,313.6 5,034.9 5.5 337.4 420.5 -19.8 91 96 GRUPO CARSO MEX Conglomerate 5,303.8 5,198.2 2.0 328.4 546.0 -39.9 92 92 SABESP BRA Basic Services 5,299.9 5,540.2 -4.3 652.2 978.5 -33.3 93 89 EMBRAER BRA Ind. Aeroespacial 5,255.4 5,630.0 -6.7 83.3 344.3 -75.8 94 87 AES ELETROPAULO BRA Electricity 5,243.4 5,819.9 -9.9 838.1 808.8 3.6 95 94 NEOENERGIA BRA Electricity 5,208.9 5,371.5 -3.0 827.2 1,067.1 -22.5 96 93 SUDAMERICANA DE VAPORES CHI Transport & Logistics 5,151.9 5,452.3 -5.5 -1,249.8 170.8 -831.7 97 105 TERNIUM MÉXICO MEX Steel & Metallurgy 5,150.4 4,893.0 5.3 270.2 N.A. - 98 116 YPFB (1) BOL Oil & Gas 5,102.0 4,785.5 6.6 N.A. N.A. - 99 74 NESTLÉ BRA Foods 5,082.0 5,992.0 -15.2 N.A. N.A. - 100 106 WALMART CHILE CHI Retail 4,994.6 4,860.9 2.8 218.4 89.1 145.1 18 AMÉRICAECONOMÍA / 2012 - 2013 RANKING 500 GI.indd 18 17/8/12 16:42:55
  • 21.
    Nº 93 Federico Fleury Curado, CEO of Embraer: sealed an alliance with Boeing and relaunched its military arm. EBITDA EBITDA VARIATION TOTAL NET EQUITY WORK- EXPORTS NET NET EXPORT. Listed on ROE ROA OWNER- RK 2011 US$ 2010 US$ IN EBITDA ASSETS 2011 2011 US$ FORCE 2011 US$ MARGIN EBITDA AS % STOCK WEBSITE (www.) (%) (%) SHIP 11 Millions Millions 11/10 (%) US$ Millions Millions 2011 Millions (%) (%) OF SALES EXCHANGE N.A. N.A. - N.A. N.A. 30,000 - - - - - - No P extra.com.br 51 N.A. N.A. - 4,245.1 1,827.2 17,297 6,825 7.8 3.4 1.5 - 73.1 Yes P* vw.com.mx 52 4,648.5 3,881.6 19.8 16,683.3 8,358.0 26,990 5,756 25.1 12.6 22.6 50.0 61.9 Yes P gmexico.com.mx 53 N.A. N.A. - 14,889.1 5,214.2 84,565 2.4 15.6 5.4 8.8 - - Yes P falabella.cl 54 1,280.0 1,920.0 -33.3 16,859.0 7,675.0 22,000 1,975.6 -1.2 -0.5 -1.0 13.9 21.4 Yes P* arcelormittal.com.br 55 1,671.1 1,437.2 16.3 N.A. N.A. 24,000 - - - - 18.2 - No P ternium.com 56 2,472.1 2,516.9 -1.8 12,495.1 6,907.3 10,266 - 9.9 5.5 7.5 27.1 - No P* timbrasil.com.br 57 1,120.0 1,902.7 -41.1 18,750.0 5,500.0 58,400 - 8.4 2.5 5.1 12.5 - No P camargocorrea.com.br 58 1,625.5 1,597.6 1.7 10,869.8 7,004.0 78,979 - 10.9 7.0 8.5 18.2 - Yes P cocacolafemsa.com 59 3,574.6 3,483.7 2.6 24,986.5 4,257.3 20,000 1,002.2 46.4 7.9 22.4 40.6 11.4 Yes P csn.com.br 60 2,898.5 2,769.2 4.7 19,915.6 6,261.3 8,706 - 20.6 6.5 15.3 34.4 - Yes P* cemig.com.br 61 N.A. N.A. - N.A. N.A. 11,500 - - - - - - No P* nissan.com.mx 62 3,120.1 3,713.7 -16.0 11,526.1 3,497.3 53,000 - 29.9 9.1 13.0 38.8 - Yes P telmex.com.mx 63 N.A. N.A. - N.A. N.A. N.A. - - - - - - Yes P copec.cl 64 N.A. N.A. - 3,656.0 713.0 56,000 - 13.3 2.6 1.2 - - No P casasbahia.com.br 65 N.A. N.A. - N.A. N.A. 6,200 4,757 - - - - 63.2 No P* chryslerdemexico.com.mx 66 N.A. N.A. - 8,640.4 5,766.9 3,704 6,198.2 48.1 32.1 37.4 - 83.5 No P* mineraescondida.cl 67 N.A. N.A. - N.A. N.A. 17,663 - - - - - - No P* techint.com 68 1,795.3 2,179.9 -17.6 14,802.3 7,341.2 25,000 - 3.6 1.8 3.8 25.4 - Yes P telmexinternacional.com 69 676.0 733.0 -7.8 5,601.0 2,063.0 114,976 - 22.8 8.4 6.7 9.6 - No S correios.com.br 70 492.7 577.8 -14.7 5,311.6 2,718.9 84,911 - 8.1 4.1 3.1 7.0 - Yes P soriana.com 71 N.A. N.A. - 15,891.0 4,215.0 16,600 - 18.9 5.0 11.3 - - No P andradegutierrez.com.br 72 2,261.2 1,332.5 69.7 5,788.1 2,966.6 9,596 5,154 30.8 15.8 13.2 32.6 74.2 Yes P penoles.com.mx 73 932.0 1,028.3 -9.4 8,521.8 1,094.4 29,768 - -16.3 -2.1 -2.6 13.5 - Yes P tam.com.br 74 2,053.4 2,059.2 -0.3 14,614.1 3,767.5 N.A. - 21.7 5.6 12.0 30.2 - Yes P cpfl.com.br 75 N.A. N.A. - 12,251.0 5,327.0 9,485 - -2.5 -1.1 -2.0 - - No P* claro.com.br 76 1,913.3 1,983.3 -3.5 9,256.5 5,867.0 37,303 2,673 14.6 9.3 13.1 29.3 40.9 Yes P gmodelo.com 77 1,818.7 2,066.2 -12.0 11,768.2 5,576.6 N.A. - 3.7 1.8 3.2 27.9 - Yes P* embratel.com.br 78 N.A. N.A. - 4,083.9 1,105.4 4,514 3,575 27.8 7.5 4.7 - 55.0 No P alfa.com.mx 79 N.A. N.A. - N.A. N.A. 13,639 - - - - - - No P* unilever.com.br 80 826.2 1,777.2 -53.5 17,784.6 9,214.1 51,182 816.8 1.3 0.7 2.0 13.0 12.9 Yes P usiminas.com.br 81 3,660.0 2,771.9 32.0 11,705.2 N.A. 4,956 - - 18.2 35.1 60.2 - Yes P antofagasta.co.uk 82 N.A. N.A. - N.A. N.A. 26,688 - - - - - - No P* sams.com.mx 83 133.0 217.0 -38.7 1,511.0 109.0 510 2,180.6 49.5 3.6 0.9 2.2 36.4 No P copersucar.com.br 84 N.A. 1,500.6 - 2,779.0 3,406.0 12,000 - 33.9 41.6 19.7 - - No P globopar.com.br 85 1,823.9 1,484.7 22.8 17,182.9 10,043.1 N.A. - 7.6 4.5 13.1 31.2 - No S eeppm.com.co 86 N.A. N.A. - 7,648.7 1,445.3 21,838 394.9 22.2 4.2 5.7 - 7.1 Yes P lan.com 87 702.5 737.9 -4.8 5,091.2 368.1 15,596 - 49.3 3.6 3.3 12.9 - Yes P americanas.com.br 88 N.A. N.A. - N.A. N.A. 67,035 - - - - - - No P gruposalinas.com 89 N.A. N.A. - 1,935.7 N.A. 83,820 - - 17.4 6.3 - - No P oxxo.com 90 617.9 655.7 -5.8 5,185.9 2,507.2 68,623 962 13.1 6.3 6.2 11.7 18.1 Yes P gcarso.com.mx 91 1,665.0 1,935.2 -14.0 13,442.3 5,622.1 14,896 - 11.6 4.9 12.3 31.4 - Yes S sabesp.com.br 92 492.0 641.6 -23.3 8,858.3 3,007.4 15,989 4,209.2 2.8 0.9 1.6 9.4 80.1 Yes P embraer.com 93 1,518.2 1,384.3 9.7 5,739.4 2,137.6 5,668 - 39.2 14.6 16.0 29.0 - Yes P* aeseletropaulo.com.br 94 1,519.4 1,781.0 -14.7 11,533.6 5,886.7 5,137 - 14.1 7.2 15.9 29.2 - No P* neoenergia.com 95 -967.0 297.4 -425.2 3,179.5 585.5 11,769 56.0 -213.5 -39.3 -24.3 -18.8 1.1 Yes P csav.cl 96 N.A. N.A. - 4,660.4 1,685.0 9,832 - 16.0 5.8 5.2 - - No P* ternium.com.mx 97 N.A. N.A. - N.A. N.A. N.A. - - - - - - No S ypfb.gov.bo 98 N.A. N.A. - N.A. N.A. 19,500 364.2 - - - - 7.2 No P* nestle.com.br 99 490.8 302.3 62.4 3,787.0 1,227.9 40,218 - 17.8 5.8 4.4 9.8 - Yes P* dys.cl 100 P: Privately-owned S: State-owned P*: Foreign-owned 2012 - 2013 / AMÉRICAECONOMÍA 19 RANKING 500 GI.indd 19 17/8/12 16:43:04
  • 22.
    LATIN AMERICA´S LARGESTCOMPANIES SALES SALES VARIATION IN NET PROFITS NET PROFITS VARIATION IN E RK RK COUN COMPANY SECTOR 2011 US$ 2010 US$ SALES 2011 2010 PROFITS 20 11 10 -TRY Millions Millions 11/10 (%) US$ Millions US$ Millions 11/010 (%) M 101 153 PETROPERÚ PER Oil & Gas 4,947.0 3,711.1 33.3 152.8 106.5 43.4 102 100 OI MÓVEL BRA Telecommunications 4,928.7 5,112.2 -3.6 536.2 1,182.9 -54.7 103 111 AMIL BRA Health Services 4,802.7 4,582.5 4.8 93.4 76.2 22.6 104 97 GRUPO INDUSTRIAL LALA (1) MEX Foods 4,802.7 5,196.8 -7.6 N.A. N.A. - 105 123 CMPC PAPELES Y CARTONES CHI Pulp & Paper 4,796.5 4,219.2 13.7 492.1 637.5 -22.8 106 132 CARGILL (1) ARG Agribusiness 4,743.0 4,444.4 6.7 N.A. N.A. - 107 107 VOTORANTIM CIMENTOS BRA Cement 4,639.0 4,830.1 -4.0 483.0 1,466.0 -67.1 108 - CODELCO DIV. CHUQUICAMATA CHI Mining 4,628.6 5,285.2 -12.4 645.2 491.9 31.2 109 113 MAN LATIN AMERICA BRA Carmaking 4,616.0 4,528.8 1.9 N.A. N.A. - 110 99 ENDESA CHI Electricity 4,578.4 5,119.8 -10.6 857.0 1,139.2 -24.8 111 109 GRUPO TELEVISA MEX Mass Media 4,486.9 4,684.9 -4.2 564.0 659.5 -14.5 112 156 CONSTRUTORA NORBERTO ODEBRECHT BRA Construction 4,476.0 3,450.2 29.7 482.0 635.0 -24.1 113 120 CGE CHI Electricity 4,475.4 4,295.2 4.2 -27.2 128.3 -121.2 114 159 REFINERÍA LA PAMPILLA PER Oil & Gas 4,468.6 3,349.0 33.4 107.7 44.0 144.8 115 142 ALMACENES ÉXITO COL Retail 4,465.2 3,772.7 18.4 196.6 128.1 53.5 116 - KALUZ MEX Conglomerate 4,411.4 N.A. - 381.4 N.A. - 117 151 ORGANIZACIÓN TERPEL COL Oil & Gas 4,384.5 3,606.2 21.6 86.6 110.6 -21.7 118 140 ARAUCO CHI Pulp & Paper 4,374.5 3,788.4 15.5 620.8 700.7 -11.4 119 378 JOHNSON CONTROLS DE MÉXICO MEX Carmaking 4,357.5 1,461.5 198.1 N.A. N.A. - 120 147 TELECOM ARG Telecommunications 4,288.2 3,660.6 17.1 560.6 454.1 23.5 121 108 GERDAU AÇOS LONGOS BRA Steel & Metallurgy 4,245.0 4,721.5 -10.1 190.0 826.0 -77.0 122 139 RENAULT BRA Carmaking 4,238.0 3,791.9 11.8 115.0 124.0 -7.3 123 134 GRUPO COPPEL MEX Retail 4,206.3 4,033.6 4.3 532.5 463.4 14.9 124 122 EL PUERTO DE LIVERPOOL MEX Retail 4,204.9 4,231.9 -0.6 469.1 417.4 12.4 125 133 LOUIS DREYFUS COMMODITIES BRA Agribusiness 4,187.0 4,097.8 2.2 75.0 -18.0 516.7 126 131 REDE ENERGIA BRA Electricity 4,148.9 4,117.6 0.8 -366.8 -221.4 -65.7 127 126 ALESAT COMBUSTÍVEIS BRA Oil & Gas 4,146.0 4,175.2 -0.7 5.0 9.0 -44.4 128 129 COPEL BRA Electricity 4,145.5 4,141.8 0.1 617.2 592.9 4.1 129 141 GRUMA MEX Foods 4,133.0 3,773.4 9.5 377.9 43.9 760.8 130 121 GRUPO CHEDRAUI MEX Retail 4,121.6 4,121.3 0.0 108.8 115.6 -5.9 131 130 FURNAS BRA Electricity 4,121.0 4,118.4 0.1 138.0 338.0 -59.2 132 149 MALL PLAZA (1) CHI Retail 4,022.0 3,653.0 10.1 N.A. N.A. - 133 124 VRG - LINHAS AÉREAS BRA Transport & Logistics 4,020.0 4,189.3 -4.0 -276.0 155.0 -278.1 134 125 GOL BRA Transport & Logistics 4,019.2 4,188.8 -4.0 -400.6 128.6 -411.5 135 127 CERVECERÍA CUAUHTÉMOC – HEINEKEN MEX Beverages & Brewing 3,986.4 4,170.2 -4.4 N.A. N.A. - 136 115 WHIRLPOOL BRA Electronics 3,979.8 4,432.2 -10.2 196.5 372.3 -47.2 137 135 COLLAHUASI CHI Mining 3,837.1 3,928.9 -2.3 1,682.4 2,047.9 -17.8 138 110 PEPSICO DE MÉXICO MEX Beverages & Brewing 3,835.2 4,633.9 -17.2 N.A. N.A. - 139 - AG TELECOM PARTICIPAÇÕES BRA Telecommunications 3,833.0 3,580.0 - -137.0 128.0 - 140 596 HP BRASIL BRA Electronics 3,810.0 2,881.0 32.2 N.A. N.A. - 141 167 CANTV VEN Telecommunications 3,792.2 3,217.5 17.9 569.4 560.0 1.7 142 158 GENERAL ELECTRIC (1) MEX Electronics 3,778.7 3,386.1 11.6 74.8 393.7 -81.0 143 144 SAMARCO MINERAÇÃO BRA Mining 3,764.0 3,745.3 0.5 1,554.0 1,198.0 29.7 144 150 CARREFOUR ARG Retail 3,745.0 3,635.0 3.0 N.A. N.A. - 145 145 GRUPO ELEKTRA MEX Retail 3,729.6 3,537.7 5.4 2,153.4 37.5 5,642.4 146 136 LIGHT BRA Electricity 3,702.3 3,906.2 -5.2 165.6 345.2 -52.0 147 210 GENERAL ELECTRIC BRA Electronics 3,700.0 2,400.0 54.2 N.A. N.A. - 148 164 LOS PELAMBRES CHI Mining 3,676.6 3,348.3 9.8 1,809.5 1,686.0 7.3 149 172 PDG REALTY BRA Construction 3,666.4 3,138.8 16.8 375.5 473.9 -20.8 150 178 ARCOS DORADOS ARG Retail 3,657.6 3,018.1 21.2 115.8 106.3 8.9 20 AMÉRICAECONOMÍA / 2012 - 2013 RANKING 500 GI.indd 20 17/8/12 16:43:10
  • 23.
    Nº 134 Constantino de Oliveira Junior, CEO of Gol: how do you make a profit from a Brazilian airline? EBITDA EBITDA VARIATION TOTAL NET EQUITY WORK- EXPORTS NET NET EXPORT. Listed on ROE ROA OWNER- RK 2011 US$ 2010 US$ IN EBITDA ASSETS 2011 2011 US$ FORCE 2011 US$ MARGIN EBITDA AS % STOCK WEBSITE (www.) (%) (%) SHIP 11 Millions Millions 11/10 (%) US$ Millions Millions 2011 Millions (%) (%) OF SALES EXCHANGE 258.5 203.6 27.0 1,845.2 601.0 2,000 472.1 25.4 8.3 3.1 5.2 9.5 Yes S petroperu.com.pe 101 1,392.2 2,110.4 -34.0 16,880.3 5,645.0 N.A. - 9.5 3.2 10.9 28.2 - No P* telemar.com.br 102 250.0 221.2 13.0 2,874.7 804.5 N.A. - 11.6 3.2 1.9 5.2 - Yes P amil.com.br 103 N.A. N.A. - 2,140.5 1,047.8 35,006 - - - - - - No P lala.com.mx 104 1,077.6 1,188.2 -9.3 13,293.6 7,839.9 15,463 1,177.3 6.3 3.7 10.3 22.5 24.5 Yes P cmpc.cl 105 N.A. N.A. - N.A. N.A. 4,600 4,269 - - - - 90.0 No P* cargill.com.ar 106 1,397.0 1,508.0 -7.4 9,829.0 2,840.0 11,000 - 17.0 4.9 10.4 30.1 - No P votorantim-cimentos.com 107 N.A. N.A. - 4,055.5 N.A. 6,527 - - 15.9 13.9 - - No S codelco.cl 108 N.A. N.A. - 2,977.0 N.A. 1,141 375.5 - - - - 8.1 No P man-latinamerica.com 109 1,853.3 2,288.0 -19.0 12,583.9 4,906.5 2,241 - 17.5 6.8 18.7 40.5 - Yes P* endesa.cl 110 1,692.9 1,748.6 -3.2 11,117.4 3,703.9 26,045 667 15.2 5.1 12.6 37.7 14.9 Yes P televisa.com.mx 111 441.0 309.0 42.7 4,991.0 2,592.0 124,356 335.7 18.6 9.7 10.8 9.9 7.5 No P odebrecht.com 112 N.A. N.A. - 7,212.3 2,067.1 7,880 - -1.3 -0.4 -0.6 - - Yes P cge.cl 113 170.0 74.8 127.1 1,440.2 516.8 N.A. 789.6 20.8 7.5 2.4 3.8 17.7 Yes P* - 114 375.1 N.A. - 4,951.7 3,653.9 N.A. - 5.4 4.0 4.4 8.4 - Yes P exito.com 115 N.A. N.A. - 5,590.4 2,077.2 17,046 - 18.4 6.8 8.6 - - No S kaluz.com 116 161.7 160.2 1.0 1,545.7 833.4 1,396 - 10.4 5.6 2.0 3.7 - No P terpel.com 117 1,307.7 1,405.9 -7.0 12,457.7 7,030.2 5,716 1,732.8 8.8 5.0 14.2 29.9 39.6 No P arauco.cl 118 N.A. N.A. - 8,209.8 1,863.3 25,200 - - - - - - No P johnsoncontrols.com 119 1,300.7 1,135.9 14.5 3,431.7 1,802.3 18,300 - 31.1 16.3 13.1 30.3 - Yes P* telecom.com.ar 120 N.A. N.A. - 6,584.0 4,203.0 N.A. 298.1 4.5 2.9 4.5 - 7.0 No P gerdau.com.br 121 N.A. N.A. - 2,745.0 727.0 10,243 1,105.6 15.8 4.2 2.7 - 26.1 No P* renault.com.br 122 N.A. N.A. - 3,883.6 2,055.4 73,021 - 25.9 13.7 12.7 - - Yes P coppel.com.mx 123 753.6 716.4 5.2 5,235.5 3,102.0 38,612 - 15.1 9.0 11.2 17.9 - Yes P liverpool.com.mx 124 N.A. N.A. - 3,580.0 464.0 3,600 483.7 16.2 2.1 1.8 - 11.6 Yes P ldcom.com.br 125 747.6 731.1 2.3 6,896.2 332.5 7,716 - -110.3 -5.3 -8.8 18.0 - Yes P redenergia.com 126 N.A. 98.9 - 553.0 71.0 N.A. - 7.0 0.9 0.1 - - No P ale.com.br 127 1,019.5 945.4 7.8 10,193.9 6,304.9 9,545 - 9.8 6.1 14.9 24.6 - Yes S copel.com 128 353.8 292.0 21.2 3,193.6 963.0 21,318 - 39.2 11.8 9.1 8.6 - Yes P gruma.com 129 264.0 270.8 -2.5 2,661.5 1,227.8 36,052 - 8.9 4.1 2.6 6.4 - Yes P chedraui.com.mx 130 997.0 635.0 57.0 15,863.0 7,092.0 4,860 - 1.9 0.9 3.3 24.2 - No S furnas.com.br 131 N.A. N.A. - N.A. N.A. N.A. - - - - - - No P mallplaza.cl 132 N.A. N.A. - 5,181.0 1,105.0 18,800 - -25.0 -5.3 -6.9 - - No P vooegol.com.br 133 80.7 587.8 -86.3 5,680.3 1,176.0 20,525 - -34.1 -7.1 -10.0 2.0 - Yes P voegol.com.br 134 N.A. N.A. - N.A. N.A. 18,384 365 - - - - 9.2 No P cuamoc.com 135 275.0 534.0 -48.5 2,803.2 914.8 N.A. 620.5 21.5 7.0 4.9 6.9 15.6 Yes P* whirlpool.com.br 136 2,859.0 N.A. - 5,070.6 3,992.6 2,015 1,574.0 42.1 33.2 43.8 74.5 41.0 No P* collahuasi.cl 137 N.A. N.A. - N.A. N.A. 55,000 - - - - - - No P* pepsico.com 138 N.A. N.A. - 11,072.0 2,821.0 N.A. - -4.9 -1.2 -3.6 - - No P agsa.com.br 139 N.A. N.A. - N.A. N.A. 10,000 - - - - - - No P* hp.com.br 140 N.A. 797.8 - 4,899.4 1,853.6 N.A. - 30.7 11.6 15.0 - - Yes P cantv.com.ve 141 N.A. N.A. - 8,637.5 1,829.9 11,000 - 4.1 0.9 2.0 - - No P* ge.com.mx 142 2,262.0 1,994.0 13.4 3,839.0 963.0 2,359 - 161.4 40.5 41.3 60.1 - No P* samarco.com.br 143 N.A. N.A. - N.A. N.A. 13,900 - - - - - - No P* carrefour.com.ar 144 565.7 580.7 -2.6 12,726.8 4,789.0 52,064 559 45.0 16.9 57.7 15.2 15.0 Yes P grupoelektra.com.mx 145 657.4 957.2 -31.3 5,854.4 1,717.3 4,134 - 9.6 2.8 4.5 17.8 - Yes P* light.com.br 146 N.A. N.A. - N.A. N.A. 6,500 - - - - - - No P* ge.com.br 147 2,334.2 N.A. - 3,731.8 2,353.1 4,000 3,676.6 76.9 48.5 49.2 63.5 100.0 No P lospelambres.cl 148 563.3 525.5 7.2 9,197.7 3,422.4 N.A. - 11.0 4.1 10.2 15.4 - Yes P pdgrealty.com.br 149 N.A. 265.1 - 1,875.4 679.6 N.A. - 17.0 6.2 3.2 - - Yes P arcosdorados.net 150 P: Privately-owned S: State-owned P*: Foreign-owned 2012 - 2013 / AMÉRICAECONOMÍA 21 RANKING 500 GI.indd 21 17/8/12 16:43:18
  • 24.
    LATIN AMERICA´S LARGESTCOMPANIES SALES SALES VARIATION IN NET PROFITS NET PROFITS VARIATION IN E RK RK COUN COMPANY SECTOR 2011 US$ 2010 US$ SALES 2011 2010 PROFITS 20 11 10 -TRY Millions Millions 11/10 (%) US$ Millions US$ Millions 11/010 (%) M 151 155 ITAIPÚ BINACIONAL BR/PY Electricity 3,652.1 3,450.5 5.8 784.2 466.5 68.1 152 - REFAP BRA Oil & Gas 3,584.0 4,923.0 - -256.0 139.0 - 153 166 NET BRASIL BRA Telecommunications 3,569.6 3,244.3 10.0 198.9 184.3 7.9 154 191 AVIANCA – TACA COL Transport & Logistics 3,566.6 2,728.4 30.7 102.1 56.4 81.0 155 169 COMCEL COL Telecommunications 3,562.1 3,214.6 10.8 927.0 589.5 57.2 156 - CODELCO DIV. EL TENIENTE CHI Mining 3,534.7 3,215.6 9.9 742.2 541.5 37.1 157 - PEUGEOT CITROEN BRA Carmaking 3,520.0 3,295.0 - 79.0 114.0 - 158 593 ENDESA BRASIL BRA Electricity 3,508.0 N.A. - 641.0 578.0 10.9 159 176 TELEFÓNICA MÓVIL VENEZUELA VEN Telecommunications 3,481.0 3,072.1 13.3 N.A. N.A. - 160 173 PAN AMERICAN ENERGY (1) ARG Oil & Gas 3,470.0 3,100.0 11.9 N.A. N.A. - 161 154 JABIL CIRCUIT MEX Electronics 3,457.3 3,516.5 -1.7 N.A. N.A. - 162 212 NEXTEL BRA Telecommunications 3,441.2 2,591.3 32.8 N.A. N.A. - 163 184 MAGAZINE LUIZA BRA Retail 3,422.2 2,885.6 18.6 6.2 41.3 -85.0 164 179 MEXICHEM MEX Petrochemicals 3,392.0 2,953.3 14.9 194.4 316.8 -38.6 165 198 MINERA ANTAMINA PER Mining 3,384.3 2,663.9 27.0 N.A. 1,411.0 - 166 - CODELCO DIV. R. TOMIC CHI Mining 3,375.2 2,204.1 53.1 956.5 496.0 92.8 167 189 GRUPO CASA SABA MEX Retail 3,338.8 2,772.9 20.4 6.3 21.9 -71.2 168 152 PETROBRAS ENERGÍA ARG Oil & Gas 3,305.1 3,601.5 -8.2 163.0 152.1 7.2 169 183 CYRELA REALTY BRA Construction 3,266.2 2,934.9 11.3 265.6 360.3 -26.3 170 148 MABE MEX Electronics 3,264.7 3,655.5 -10.7 -125.1 -47.6 -162.6 171 160 NESTLÉ DE MÉXICO (1) MEX Foods 3,226.4 3,319.9 -2.8 N.A. N.A. - 172 161 HIPERMERCADOS LIDER CHI Retail 3,212.6 3,319.5 -3.2 N.A. N.A. - 173 251 EMBOTELLADORAS ARCA MEX Beverages & Brewing 3,211.8 2,191.2 46.6 323.4 213.1 51.8 174 182 NEMAK MEX Carmaking 3,204.8 2,946.7 8.8 76.4 75.1 1.7 175 170 SOUTHERN PERÚ COPPER CORP. PER Mining 3,179.6 3,153.5 0.8 1,078.1 1,200.4 -10.2 176 162 BASF BRA Chemicals & Pharma. 3,172.0 3,317.2 -4.4 177.0 -47.0 476.6 177 343 PACIFIC RUBIALES ENERGY COL Oil & Gas 3,152.4 1,617.4 94.9 516.9 211.8 144.0 178 233 ANCAP (1) URU Oil & Gas 3,151.7 2,327.8 35.4 -96.0 74.6 -228.7 179 114 COMERCIAL MEXICANA MEX Retail 3,138.6 3,378.9 -7.1 88.6 78.1 13.4 180 143 FIBRIA BRA Pulp & Paper 3,121.0 3,771.1 -17.2 -465.2 359.3 -229.5 181 117 FLEXTRONICS MANUFACTURING (1) MEX Carmaking 3,107.9 4,399.7 -29.4 199.5 N.A. - 182 205 MOLINOS RÍO DE LA PLATA ARG Agribusiness 3,106.7 2,629.5 18.1 64.2 93.8 -31.6 183 209 ARCOR ARG Foods 3,100.0 2,600.0 19.2 N.A. N.A. - 184 186 EMPRESAS ICA MEX Construction 3,066.4 2,831.3 8.3 106.1 73.6 44.2 185 180 VOLKSWAGEN (1) ARG Carmaking 3,030.0 2,950.0 2.7 N.A. N.A. - 186 168 CPFL - COMPANHIIA PAULISTA DE FORÇA E LUZ BRA Electricity 2,982.7 3,216.9 -7.3 327.0 417.6 -21.7 187 175 NATURA BRA Chemicals & Pharma. 2,980.8 3,082.9 -3.3 443.0 446.6 -0.8 188 165 CHESF – CIA. HIDROELÊTRICA DO SÃO FRANCISCO BRA Electricity 2,977.0 3,261.1 -8.7 828.0 1,161.0 -28.7 189 200 COAMO BRA Foods 2,960.0 2,658.0 11.4 197.0 153.0 28.8 190 163 SOUZA CRUZ BRA Agribusiness 2,958.8 3,312.3 -10.7 854.4 654.9 30.5 191 197 SIGMA MEX Foods 2,945.1 2,679.5 9.9 59.6 120.3 -50.5 192 211 ELETRONORTE BRA Electricity 2,934.0 2,594.7 13.1 31.0 82.0 -62.2 193 171 MAKRO BRA Retail 2,933.0 3,153.4 -7.0 -2.0 20.0 -110.0 194 194 ALTOS HORNOS DE MÉXICO MEX Steel & Metallurgy 2,928.0 2,700.2 8.4 140.0 71.6 95.5 195 188 INVERSIONES ARGOS COL Cement 2,921.2 2,773.3 5.3 77.6 199.1 -61.0 196 272 ACEITERA GENERAL DEHEZA (1) ARG Agribusiness 2,900.0 2,000.0 45.0 N.A. N.A. - 197 204 TELEFÓNICA DEL PERÚ PER Telecommunications 2,885.3 2,641.5 9.2 197.3 267.6 -26.3 198 177 ENERGIAS DO BRASIL BRA Electricity 2,879.7 3,021.4 -4.7 261.6 349.6 -25.2 199 213 EXXONMOBIL COL Oil & Gas 2,864.4 2,572.3 11.4 48.9 21.5 127.6 200 229 SIDERAR ARG Steel & Metallurgy 2,811.3 2,382.5 18.0 310.5 445.8 -30.3 22 AMÉRICAECONOMÍA / 2012 - 2013 RANKING 500 GI.indd 22 17/8/12 16:43:25
  • 25.
    Nº 187 Alessandro Carlucci. CEO of Natura: one of LatinAmerica´s best-known and respected brands. EBITDA EBITDA VARIATION TOTAL NET EQUITY WORK- EXPORTS NET NET EXPORT. Listed on ROE ROA OWNER- RK 2011 US$ 2010 US$ IN EBITDA ASSETS 2011 2011 US$ FORCE 2011 US$ MARGIN EBITDA AS % STOCK WEBSITE (www.) (%) (%) SHIP 11 Millions Millions 11/10 (%) US$ Millions Millions 2011 Millions (%) (%) OF SALES EXCHANGE N.A. N.A. - 18,854.9 100.0 3,186 - 784.2 4.2 21.5 - - No S itaipu.gov.py 151 40.0 386.0 - 3,651.0 611.0 923 - -41.9 -7.0 -7.1 1.1 - No P refap.com.br 152 1,035.2 935.8 10.6 4,741.9 2,232.6 N.A. - 8.9 4.2 5.6 29.0 - Yes P netcombo.com.br 153 453.8 344.0 32.0 3,795.3 909.5 N.A. - 11.2 2.7 2.9 12.7 - No P avianca.com.co 154 N.A. N.A. - 5,230.5 2,819.3 3,903 - 32.9 17.7 26.0 - - No P* comcel.com.co 155 N.A. N.A. - 3,784.2 N.A. 4,975 - - 19.6 21.0 - - No S codelco.cl 156 N.A. N.A. - 2,265.0 745.0 4,980 - 10.6 3.5 2.2 - - No P* peugeot.com.br 157 1,193.0 1,187.0 0.5 6,290.0 3,166.0 16,209 - 20.2 10.2 18.3 34.0 - No P* endesabrasil.com.br 158 N.A. N.A. - N.A. N.A. 7,000 - - - - - - No P* movistar.com.ve 159 N.A. N.A. - N.A. N.A. 10,900 - - - - - - No P* pan-energy.com 160 N.A. N.A. - N.A. N.A. 12,000 - - - - - - No P* jabil.com 161 N.A. 777.0 - N.A. N.A. 5,061 - - - - - - No P* nextel.com.br 162 160.3 192.0 -16.5 2,600.1 331.0 26,000 - 1.9 0.2 0.2 4.7 - No P magazineluiza.com.br 163 736.4 657.8 11.9 4,334.6 1,720.2 11,173 - 11.3 4.5 5.7 21.7 - Yes P mexichem.com.mx/ 164 N.A. N.A. - N.A. N.A. N.A. 3,384.0 - - - - 100.0 No P* antamina.com 165 N.A. N.A. - 2,014.6 N.A. 1,010 - - 47.5 28.3 - - No S codelco.cl 166 135.3 63.0 114.8 2,250.5 510.6 13,251 - 1.2 0.3 0.2 4.1 - Yes P casasaba.com 167 466.4 675.8 -31.0 5,131.9 2,400.7 1,250 - 6.8 3.2 4.9 14.1 - Yes P* petrobras.com.ar 168 407.2 485.1 -16.1 7,152.6 2,422.8 N.A. - 11.0 3.7 8.1 12.5 - Yes P brazilrealty.com.br 169 N.A. N.A. - 2,388.8 322.5 19,751 2,418 -38.8 -5.2 -3.8 - 74.1 No P mabe.com.mx 170 N.A. N.A. - N.A. N.A. 6,500 - - - - - - No P* nestle.com.mx 171 N.A. N.A. - N.A. N.A. N.A. - - - - - - No P lider.cl 172 543.2 408.0 33.1 4,331.6 2,609.0 38,172 - 12.4 7.5 10.1 16.9 - Yes P arcacontal.com 173 N.A. N.A. - 3,198.3 805.7 18,004 2,925 9.5 2.4 2.4 - 91.3 No P alfa.com.mx 174 1,670.0 2,034.0 -17.9 2,863.4 2,394.7 12,000 2,870.0 45.0 37.6 33.9 52.5 90.3 Yes P* southernperu.com 175 N.A. N.A. - 2,337.0 912.0 4,000 413.6 19.4 7.6 5.6 - 13.0 No P* basf.com.br 176 1,815.1 898.3 102.0 5,344.0 2,851.9 N.A. - 18.1 9.7 16.4 57.6 - No P pacificrubiales.com 177 N.A. N.A. - N.A. N.A. N.A. - - - -3.0 - - No S ancap.com.uy 178 246.9 219.0 12.7 3,159.8 1,140.2 40,565 - 7.8 2.8 2.8 7.9 - Yes P comerci.com.mx 179 1,205.8 1,646.7 -26.8 14,848.9 7,735.8 N.A. 2,183.0 -6.0 -3.1 -14.9 38.6 69.9 Yes P fibria.com.br 180 N.A. N.A. - 1,565.9 1,340.9 12,475 - 14.9 12.7 6.4 - - No P* flextronics.com 181 206.8 218.4 -5.3 1,397.6 317.2 4,500 - 20.2 4.6 2.1 6.7 - Yes P molinos.com.ar 182 N.A. N.A. - N.A. N.A. 25,500 380.0 - - - - 12.3 No P arcor.com.ar 183 355.9 323.7 9.9 7,090.0 1,205.1 40,003 - 8.8 1.5 3.5 11.6 - Yes P ica.com.mx 184 N.A. N.A. - N.A. N.A. 4,600 - - - - - - No P* volkswagen.com.ar 185 622.4 713.8 -12.8 3,071.6 478.7 N.A. - 68.3 10.6 11.0 20.9 - Yes P cpfl.com.br 186 759.7 754.3 0.7 2,022.1 666.5 6,700 - 66.5 21.9 14.9 25.5 - Yes P natura.com.br 187 1,432.0 1,732.0 -17.3 12,863.0 8,969.0 N.A. - 9.2 6.4 27.8 48.1 - No S chesf.gov.br 188 N.A. N.A. - 2,402.0 1,167.0 5,540 1,129.2 16.9 8.2 6.7 - 38.1 No P coamo.com.br 189 1,256.7 1,257.4 -0.1 2,267.8 1,108.5 N.A. 647.3 77.1 37.7 28.9 42.5 21.9 Yes P* souzacruz.com.br 190 N.A. N.A. - 2,023.3 555.2 29,226 397 10.7 2.9 2.0 - 13.5 Yes P gruposigma.com.mx 191 702.0 656.0 7.0 11,769.0 5,471.0 3,815 - 0.6 0.3 1.1 23.9 - No S eletronorte.gov.br 192 N.A. N.A. - 1,023.0 266.0 7,144 - -0.8 -0.2 -0.1 - - No P* makro.com.br 193 499.5 348.2 43.5 4,390.8 1,580.5 21,752 - 8.9 3.2 4.8 17.1 - Yes P ahmsa.com 194 822.4 833.5 -1.3 12,820.1 4,829.2 N.A. - 1.6 0.6 2.7 28.2 - No P argos.com.co 195 N.A. N.A. - N.A. N.A. 2,000 1,885 - - - - 65.0 No P agd.com.ar 196 1,012.7 905.5 11.8 4,122.5 1,319.6 7,000 - 15.0 4.8 6.8 35.1 - Yes P* telefonica.com.pe 197 817.8 912.7 -10.4 7,283.4 2,455.0 10,085 - 10.7 3.6 9.1 28.4 - Yes P energiasdobrasil.com.br 198 N.A. N.A. - 613.6 269.1 N.A. - 18.2 8.0 1.7 - - No P* exxon.com 199 448.2 425.0 5.5 3,328.0 2,290.8 7,500 - 13.6 9.3 11.0 15.9 - Yes P siderar.com.ar 200 P: Privately-owned S: State-owned P*: Foreign-owned 2012 - 2013 / AMÉRICAECONOMÍA 23 RANKING 500 GI.indd 23 17/8/12 16:43:33
  • 26.
    LATIN AMERICA´S LARGESTCOMPANIES SALES SALES VARIATION IN NET PROFITS NET PROFITS VARIATION IN E RK RK COUN COMPANY SECTOR 2011 US$ 2010 US$ SALES 2011 2010 PROFITS 20 11 10 -TRY Millions Millions 11/10 (%) US$ Millions US$ Millions 11/010 (%) M 201 274 CAP CHI Steel & Metallurgy 2,787.0 1,993.6 39.8 441.7 590.4 -25.2 202 201 SHELL CAPSA (1) ARG Oil & Gas 2,780.0 2,650.0 4.9 N.A. N.A. - 203 195 TRANSPETRO BRA Transport & Logistics 2,775.0 2,698.9 2.8 335.0 292.0 14.7 204 226 PÃO DE AÇÚCAR BRA Retail 2,774.0 2,485.0 11.6 N.A. N.A. - 205 203 WEG BRA Machinery 2,766.5 2,635.9 5.0 312.9 312.0 0.3 206 230 CLARO ARG Telecommunications 2,756.0 2,380.0 15.8 N.A. N.A. - 207 187 CCR RODOVIAS BRA Basic Services 2,737.1 2,795.1 -2.1 479.5 403.1 19.0 208 199 RECOPE (1) C.RI Oil & Gas 2,732.0 2,660.8 2.7 N.A. 125.3 - 209 208 GERDAU AÇOMINAS BRA Steel & Metallurgy 2,690.0 2,610.0 3.1 -43.0 -66.0 34.8 210 207 SODIMAC CHI Retail 2,684.3 2,618.5 2.5 165.3 167.7 -1.4 211 190 CNH BRA Carmaking 2,684.0 2,736.3 -1.9 85.0 196.0 -56.6 212 196 GRUPO SANBORNS MEX Retail 2,656.0 2,693.3 -1.4 209.8 259.1 -19.0 213 202 COELBA BRA Electricity 2,648.1 2,637.3 0.4 400.1 567.6 -29.5 214 206 TELEFÓNICA MOVIL ARGENTINA ARG Telecommunications 2,640.5 2,622.0 0.7 N.A. N.A. - 215 215 GASPETRO BRA Oil & Gas 2,620.0 2,561.3 2.3 480.0 728.0 -34.1 216 234 PEUGEOT - CITROËN (1) ARG Carmaking 2,589.0 2,320.0 11.6 N.A. N.A. - 217 227 MAGNA INTERNACIONAL MEX Carmaking 2,588.3 2,404.4 7.7 N.A. N.A. - 218 193 SUZANO PAPEL E CELULOSE BRA Pulp & Paper 2,584.5 2,709.1 -4.6 15.9 461.5 -96.6 219 239 GRUPO AEROMÉXICO (1) MEX Transport & Logistics 2,567.3 2,273.8 12.9 149.2 189.0 -21.1 220 219 BAVARIA COL Beverages & Brewing 2,565.6 2,486.9 3.2 513.4 411.8 24.7 221 214 GRUPO XIGNUX MEX Conglomerate 2,562.3 2,566.5 -0.2 25.0 46.0 -45.7 222 232 GENERAL MOTORS (1) ARG Carmaking 2,560.0 2,360.0 8.5 N.A. N.A. - 223 128 LA FONTE TELECOM BRA Telecommunications 2,555.4 4,144.6 -38.3 472.2 -47.8 1,087.9 224 238 GRUPO NUTRESA COL Foods 2,553.2 2,286.0 11.7 128.0 135.4 -5.4 225 231 MINERA CERRO VERDE PER Mining 2,520.1 2,369.0 6.4 1,078.4 1,074.4 0.4 226 269 ANGLO AMERICAN NORTE CHI Mining 2,515.1 2,009.8 25.1 463.1 546.9 -15.3 227 261 HERINGER FERTILIZANTES BRA Chemicals & Pharma. 2,507.7 2,113.5 18.7 34.1 37.1 -8.1 228 223 NACIONAL DE DROGAS (1) MEX Chemicals & Pharma. 2,502.2 2,453.5 2.0 N.A. N.A. - 229 216 DEACERO (1) MEX Steel & Metallurgy 2,492.2 2,558.8 -2.6 N.A. N.A. - 230 257 AEROPUERTOS Y SERVICIOS AUXILIARES MEX Servicios Generales 2,492.0 2,160.2 15.4 67.4 -59.7 212.9 231 236 FORD (1) ARG Carmaking 2,476.0 2,300.0 7.7 N.A. N.A. - 232 192 GRUPO OAS BRA Construction 2,473.0 2,409.0 2.7 28.0 -60.0 146.7 233 248 INTEL C.RI Electronics 2,450.0 2,200.0 11.4 N.A. N.A. - 234 240 ARCELOR MITTAL MEX Steel & Metallurgy 2,426.9 2,251.7 7.8 N.A. N.A. - 235 - RAIA DROGASIL BRA Retail 2,425.0 2,027.2 19.6 56.3 48.4 16.3 236 331 CONSORCIO MINERO CORMIN PER Mining 2,418.7 1,691.0 43.0 N.A. N.A. - 237 259 ANGLO AMERICAN SUR CHI Mining 2,361.6 2,122.5 11.3 797.9 1,820.5 -56.2 238 181 CONSTRUÇÕES E COMÉRCIO CAMARGO CORRÊA BRA Construction 2,361.0 2,947.9 -19.9 13.0 9.0 44.4 239 270 AUTORIDAD DEL CANAL DE PANAMÁ PAN Transport & Logistics 2,360.7 2,008.4 17.5 1,251.6 981.7 27.5 240 235 ENTEL CHI Telecommunications 2,360.3 2,313.5 2.0 346.7 369.3 -6.1 241 282 BUNGE FERTILIZANTES BRA Chemicals & Pharma. 2,332.0 1,940.9 20.1 -71.0 -61.0 -16.4 242 250 INDUSTRIAS CH MEX Steel & Metallurgy 2,323.7 2,195.4 5.8 218.0 42.5 412.9 243 296 CONTINENTAL TIRE DE MÉXICO MEX Carmaking 2,323.0 1,854.3 25.3 N.A. N.A. - 244 217 PROCTER & GAMBLE DE MÉXICO (1) MEX Chemicals & Pharma. 2,319.0 2,542.6 -8.8 N.A. N.A. - 245 253 AVON BRA Chemicals & Pharma. 2,316.3 2,182.8 6.1 N.A. N.A. - 246 592 CONSTRUTORA ANDRADE GURIERREZ BRA Construction 2,313.0 2,269.0 1.9 211.0 194.0 8.8 247 221 TRACTEBEL BRA Electricity 2,306.7 2,460.9 -6.3 771.7 727.2 6.1 248 247 BAYER BRA Chemicals & Pharma. 2,289.0 2,204.0 3.9 52.0 -35.0 248.6 249 336 ASSAI BRA Retail 2,286.0 2,079.0 10.0 N.A. N.A. - 250 252 GRUPO ICE (1) C.RI Basic Services 2,268.2 2,191.1 3.5 -45.0 339.3 -113.3 24 AMÉRICAECONOMÍA / 2012 - 2013 RANKING 500 GI.indd 24 17/8/12 16:43:40
  • 27.
    Nº 224 Carlos Enrique Piedrahita, CEO of Grupo Nutresa: from Colombian chocolatemaker to regional food supplier. EBITDA EBITDA VARIATION TOTAL NET EQUITY WORK- EXPORTS NET NET EXPORT. Listed on ROE ROA OWNER- RK 2011 US$ 2010 US$ IN EBITDA ASSETS 2011 2011 US$ FORCE 2011 US$ MARGIN EBITDA AS % STOCK WEBSITE (www.) (%) (%) SHIP 11 Millions Millions 11/10 (%) US$ Millions Millions 2011 Millions (%) (%) OF SALES EXCHANGE N.A. N.A. - 4,771.0 1,724.1 5,211 - 25.6 9.3 15.8 - - Yes P cap.cl 201 N.A. N.A. - N.A. N.A. 4,100 - - - - - - No P* shell.com.ar 202 N.A. N.A. - 2,731.0 1,728.0 5,230 - 19.4 12.3 12.1 - - No S transpetro.com.br 203 N.A. N.A. - N.A. N.A. 15,000 - - - - - - No P paodeacucar.com.br 204 453.8 472.1 -3.9 4,854.4 2,025.9 N.A. 783.2 15.4 6.4 11.3 16.4 28.3 Yes P weg.net 205 N.A. N.A. - N.A. N.A. 2,100 - - - - - - No P claro.com.ar 206 1,445.7 1,212.8 19.2 6,851.1 1,708.8 N.A. - 28.1 7.0 17.5 52.8 - Yes P grupoccr.com.br 207 N.A. N.A. - N.A. N.A. N.A. - - - - - - No S recope.go.cr 208 N.A. N.A. - 4,282.0 2,308.0 N.A. 1,449.0 -1.9 -1.0 -1.6 - 53.9 Yes P gerdau.com.br/gerdauacominas 209 N.A. N.A. - 1,156.5 479.6 18,376 2.8 34.5 14.3 6.2 - 0.1 No P sodimac.cl 210 N.A. N.A. - 2,005.0 729.0 5,000 435.8 11.7 4.2 3.2 - 16.2 No P cnhbrasil.com.br 211 N.A. N.A. - 2,125.7 1,253.8 N.A. - 16.7 9.9 7.9 - - No P sanborns.com.mx 212 682.5 808.8 -15.6 3,272.1 1,225.0 2,533 - 32.7 12.2 15.1 25.8 - Yes P* coelba.com.br 213 N.A. N.A. - N.A. N.A. 4,200 - - - - - - No P* movistar.com.ar 214 N.A. 1,064.0 - 17,572.0 5,459.0 N.A. - 8.8 2.7 18.3 - - No P gaspetro.com.br 215 N.A. N.A. - N.A. N.A. 5,000 - - - - - - No P* peugeot.com.ar 216 N.A. N.A. - N.A. N.A. 18,000 - - - - - - No P* magna.com 217 696.3 1,006.7 -30.8 11,545.5 5,157.0 17,000 1,392.1 0.3 0.1 0.6 26.9 53.9 Yes P suzano.com.br 218 320.0 322.7 -0.8 1,557.7 366.4 12,865 - 40.7 9.6 5.8 12.5 - No P aeromexico.com 219 1,021.5 1,000.2 2.1 4,644.8 2,682.5 N.A. - 19.1 11.1 20.0 39.8 - No P* bavaria.com.co 220 N.A. N.A. - 1,791.2 663.0 19,328 1,350 3.8 1.4 1.0 - 52.7 Yes P xignux.com 221 N.A. N.A. - N.A. N.A. N.A. - - - - - - No P* gm.com.ar 222 1,301.1 1,383.7 -6.0 7,422.6 467.5 N.A. - 101.0 6.4 18.5 50.9 - Yes P* lafonte.com.br 223 286.8 275.9 4.0 4,004.0 3,268.7 26,284 43 3.9 3.2 5.0 11.2 1.7 No P gruponutresa.com 224 1,643.3 1,643.5 -0.0 3,196.6 2,677.6 N.A. 2,182.0 40.3 33.7 42.8 65.2 86.6 Yes P fcx.com 225 596.3 630.0 -5.3 879.3 349.5 634 1,897.5 132.5 52.7 18.4 23.7 75.4 No P* angloamerican.com 226 189.0 127.5 48.2 1,383.0 252.5 3,425 - 13.5 2.5 1.4 7.5 - Yes P heringer.com.br 227 N.A. N.A. - N.A. N.A. 5,500 - - - - - - No P nadro.com 228 N.A. N.A. - N.A. N.A. 7,000 - - - - - - No P deacero.com 229 N.A. N.A. - 1,002.3 514.4 2,500 - 13.1 6.7 2.7 - - No S asa.gob.mx 230 N.A. N.A. - N.A. N.A. 3,700 - - - - - - No P* ford.com.ar 231 204.0 87.0 134.5 3,790.0 368.0 52,869 - 7.6 0.7 1.1 8.2 - Yes P oas.com 232 N.A. N.A. - N.A. N.A. N.A. - - - - - - No P* intel.com 233 N.A. N.A. - N.A. N.A. 5,000 - - - - - - No P* arcelormittal.com 234 113.9 117.9 -3.4 1,689.8 1,174.0 16,278 - 4.8 3.3 2.3 4.7 - No P drogaraia.com.br 235 N.A. N.A. - N.A. N.A. N.A. 2,419.0 - - - - 100.0 No P trafigura.com 236 1,055.1 1,117.3 -5.6 6,396.9 3,926.9 1,992 1,624.1 20.3 12.5 33.8 44.7 68.8 No P* angloamerican.co.uk 237 N.A. N.A. - 1,076.0 1,366.0 23,642 - 1.0 1.2 0.6 - - No P camargocorrea.com.br 238 N.A. 1,407.1 - 7,805.0 6,275.0 10,000 - 19.9 16.0 53.0 - - No S pancanal.com 239 974.2 943.1 3.3 2,987.8 1,482.5 7,009 61.2 23.4 11.6 14.7 41.3 2.6 Yes P entel.cl 240 N.A. N.A. - 2,054.0 744.0 7,500 - -9.5 -3.5 -3.0 - - No P* bunge.com.br 241 294.7 198.1 48.8 2,674.3 1,740.9 5,348 - 12.5 8.2 9.4 12.7 - Yes P industriasch.com.mx 242 N.A. N.A. - N.A. N.A. 11,000 - - - - - - No P continentaltire.com.mx 243 N.A. N.A. - N.A. N.A. 6,523 - - - - - - No P* pg.com.mx 244 N.A. N.A. - N.A. N.A. 4,500 - - - - - - No P* avon.com.br 245 N.A. N.A. - 2,902.0 1,336.0 10,022 - 15.8 7.3 9.1 - - No P andradegutierrez.com.br 246 1,551.2 1,567.3 -1.0 6,595.2 2,904.4 N.A. - 26.6 11.7 33.5 67.2 - Yes P portal.tractebelenergia.com.br 247 N.A. N.A. - 575.0 869.0 4,000 - 6.0 9.0 2.3 - - No P* bayer.com.br 248 N.A. N.A. - N.A. N.A. 10,000 - - - - - - No P assaiatacadista.com.br 249 N.A. N.A. - 9,853.1 N.A. 18,500 - - -0.5 -2.0 - - No S grupoice.com 250 P: Privately-owned S: State-owned P*: Foreign-owned 2012 - 2013 / AMÉRICAECONOMÍA 25 RANKING 500 GI.indd 25 17/8/12 16:43:47
  • 28.
    LATIN AMERICA´S LARGESTCOMPANIES SALES SALES VARIATION IN NET PROFITS NET PROFITS VARIATION IN E RK RK COUN COMPANY SECTOR 2011 US$ 2010 US$ SALES 2011 2010 PROFITS 20 11 10 -TRY Millions Millions 11/10 (%) US$ Millions US$ Millions 11/010 (%) M 251 286 GRUPO CLARÍN ARG Mass Media 2,257.5 1,903.2 18.6 120.9 133.1 -9.2 252 224 B2W - CIA. GLOBAL DO VAREJO BRA Retail 2,256.2 2,444.8 -7.7 -47.5 20.2 -335.1 253 330 XSTRATA COPPER CHILE CHI Mining 2,248.5 1,700.8 32.2 N.A. N.A. - 254 470 COSTCO MÉXICO (1) MEX Retail 2,248.0 1,131.3 98.7 N.A. N.A. - 255 228 CIELO BRA Software & Data 2,243.7 2,396.2 -6.4 965.1 1,097.9 -12.1 256 218 GRUPO BOSCH BRA Carmaking 2,241.0 2,542.4 -11.9 N.A. N.A. - 257 225 CELESC BRA Electricity 2,234.5 2,422.7 -7.8 172.7 164.2 5.2 258 185 BRASKEM QPAR- EX QUATTOR PARTICIPAÇOES BRA Petrochemicals 2,224.0 2,832.2 -21.5 26.0 -337.0 107.7 259 245 SPAL BRA Beverages & Brewing 2,222.0 2,223.2 -0.1 213.0 187.0 13.9 260 243 RANDON PARTICIPAÇÕES BRA Carmaking 2,215.8 2,232.0 -0.7 143.5 149.7 -4.1 261 307 ISA COL Electricity 2,205.5 1,801.4 22.4 170.0 176.3 -3.6 262 394 FALABELLA PERÚ PER Retail 2,201.3 1,665.6 32.2 136.9 121.2 12.9 263 512 TAG BRA Transport & Logistics 2,189.0 1,012.0 116.3 209.0 426.0 -50.9 264 222 COMGAS BRA Oil & Gas 2,187.2 2,457.9 -11.0 125.9 348.1 -63.8 265 284 PARANAPANEMA BRA Mining 2,184.9 1,915.7 14.1 -25.4 28.5 -189.1 266 241 ELECTROLUX DO BRASIL BRA Electronics 2,156.0 2,237.8 -3.7 74.0 125.0 -40.8 267 313 SYNGENTA BRA Agribusiness 2,152.0 1,778.0 21.0 N.A. N.A. - 268 314 AGROSUPER (1) CHI Agribusiness 2,149.5 2,007.3 7.1 N.A. N.A. - 269 299 SQM CHI Mining 2,145.3 1,830.4 17.2 545.8 382.1 42.8 270 304 MRV BRA Construction 2,140.5 1,813.1 18.1 405.2 380.8 6.4 271 308 AES GENER CHI Electricity 2,130.3 1,802.0 18.2 326.1 169.8 92.0 272 298 SIGDO KOPPERS CHI Construction 2,127.8 1,832.4 16.1 285.6 112.9 153.0 273 280 SIEMENS BRASIL BRA Electronics 2,124.0 1,822.0 16.6 110.0 51.0 115.7 274 267 MINERVA BRA Agribusiness 2,120.1 2,045.5 3.6 24.2 12.5 93.6 275 295 MINERA YANACOCHA PER Mining 2,100.0 1,778.3 18.1 642.4 591.2 8.7 276 275 GRUPO SIMEC MEX Steel & Metallurgy 2,098.6 1,990.1 5.5 205.2 73.2 180.3 277 249 KLABIN BRA Pulp & Paper 2,073.3 2,198.6 -5.7 97.4 336.0 -71.0 278 255 PERNAMBUCANAS BRA Retail 2,057.0 2,164.9 -5.0 82.0 86.0 -4.7 279 237 CARBONES DEL CERREJÓN COL Mining 2,045.4 2,292.6 -10.8 508.4 524.2 -3.0 280 263 RIPLEY CORP. CHI Retail 2,037.1 2,082.8 -2.2 106.0 106.8 -0.7 281 273 TELEFÓNICA COLOMBIA COL Telecommunications 2,034.3 1,996.9 1.9 -354.5 -408.3 13.2 282 620 QUIÑENCO CHI Conglomerate 2,023.9 650.4 211.2 168.7 622.6 -72.9 283 316 NAMISA BRA Mining 2,008.0 1,763.0 13.9 1,105.0 1,042.0 6.0 284 256 NEXTEL DE MÉXICO MEX Telecommunications 2,006.3 2,161.8 -7.2 N.A. N.A. - 285 264 CARREFOUR COL Retail 1,999.1 2,076.6 -3.7 22.9 43.8 -47.8 286 271 INDUSTRIAS BACHOCO MEX Agribusiness 1,988.5 2,001.3 -0.6 11.3 160.6 -93.0 287 285 DRUMMOND COL Mining 1,987.9 1,905.6 4.3 184.2 101.1 82.3 288 277 BROOKFIELD BRA Construction 1,987.0 1,971.0 0.8 174.2 218.3 -20.2 289 258 CHILECTRA CHI Electricity 1,985.5 2,141.5 -7.3 212.5 322.3 -34.1 290 266 CONSTRUTORA OAS BRA Construction 1,981.0 2,068.8 -4.2 81.0 26.0 211.5 291 338 SAMSUNG ELECTRONICS MEX Electronics 1,980.4 1,657.1 19.5 7.2 N.A. - 292 323 ENAMI CHI Mining 1,966.9 1,721.1 14.3 -70.7 15.1 -568.2 293 381 FRESNILLO PLC MEX Mining 1,955.7 1,442.6 35.6 926.4 767.0 20.8 294 433 MINERA SPENCE CHI Mining 1,954.2 1,515.8 28.9 694.4 547.5 26.8 295 254 PANPHARMA BRA Retail 1,927.0 2,175.7 -11.4 46.0 60.0 -23.3 296 220 MOVISTAR MEX Telecommunications 1,926.4 2,486.2 -22.5 N.A. N.A. - 297 260 KIMBERLY CLARK DE MÉXICO MEX Pulp & Paper 1,916.6 2,121.2 -9.6 261.0 341.9 -23.7 298 300 GRUPO KUO MEX Conglomerate 1,916.3 1,824.1 5.1 9.3 41.0 -77.3 299 320 SUPERMERCADOS JUMBO CHI Retail 1,916.0 1,743.3 9.9 N.A. N.A. - 300 294 TOYOTA (1) ARG Carmaking 1,910.0 1,870.0 2.1 N.A. N.A. - 26 AMÉRICAECONOMÍA / 2012 - 2013 RANKING 500 GI.indd 26 17/8/12 16:43:53
  • 29.
    Nº 251 Héctor Magnetto, CEO de Grupo Clarín: the media group in the sights of the Argentinean government. EBITDA EBITDA VARIATION TOTAL NET EQUITY WORK- EXPORTS NET NET EXPORT. Listed on ROE ROA OWNER- RK 2011 US$ 2010 US$ IN EBITDA ASSETS 2011 2011 US$ FORCE 2011 US$ MARGIN EBITDA AS % STOCK WEBSITE (www.) (%) (%) SHIP 11 Millions Millions 11/10 (%) US$ Millions Millions 2011 Millions (%) (%) OF SALES EXCHANGE 601.5 586.5 2.6 2,473.5 864.6 10,000 - 14.0 4.9 5.4 26.6 - No P grupoclarin.com.ar 251 164.9 280.0 -41.1 2,180.4 607.1 N.A. - -7.8 -2.2 -2.1 7.3 - Yes P b2winc.com 252 N.A. N.A. - N.A. N.A. N.A. 2,248.5 - - - - 100.0 No P* - 253 N.A. N.A. - N.A. N.A. 9,550 - - - - - - No P costco.com.mx 254 1,273.3 1,538.8 -17.3 2,708.8 751.5 N.A. - 128.4 35.6 43.0 56.8 - Yes P cielo.com.br 255 N.A. N.A. - N.A. N.A. 9,962 563.7 - - - - 25.2 No P* bosch.com.br 256 316.9 257.9 22.9 2,860.2 1,159.3 N.A. - 14.9 6.0 7.7 14.2 - Yes S celesc.com.br 257 N.A. N.A. - 2,511.0 1,451.0 N.A. - 1.8 1.0 1.2 - - No P quattor.com.br 258 N.A. N.A. - 1,423.0 1,020.0 N.A. - 20.9 15.0 9.6 - - No P spalbrasil.com 259 291.7 319.5 -8.7 2,141.2 722.0 N.A. - 19.9 6.7 6.5 13.2 - Yes P randon.com.br 260 1,528.4 1,295.3 18.0 13,458.8 3,243.5 3,242 - 5.2 1.3 7.7 69.3 - No S - 261 279.8 253.4 10.4 2,014.2 692.3 14,500 - 19.8 6.8 6.2 12.7 - Yes P* falabella.com.pe 262 1,690.0 574.0 194.4 14,788.0 3,590.0 N.A. - 5.8 1.4 9.5 77.2 - Yes P tag.com.br 263 382.6 709.4 -46.1 2,296.4 664.5 4,721 - 18.9 5.5 5.8 17.5 - Yes P* comgas.com.br 264 21.6 63.4 -65.9 2,013.2 885.9 3,745 - -2.9 -1.3 -1.2 1.0 - Yes P paranapanema.com.br 265 N.A. N.A. - 1,204.0 416.0 7,690 - 17.8 6.1 3.4 - - No P* electrolux.com.br 266 N.A. N.A. - N.A. N.A. 1,354 189.1 - - - - 8.8 No P syngenta.com 267 N.A. N.A. - N.A. N.A. 15,915 - - - - - - No P agrosuper.cl 268 949.4 654.5 45.1 3,871.6 1,812.8 4,902 568.3 30.1 14.1 25.4 44.3 26.5 Yes P sqm.cl 269 486.1 410.2 18.5 4,883.6 1,824.8 N.A. - 22.2 8.3 18.9 22.7 - Yes P mrv.com.br 270 711.7 383.3 85.7 5,829.3 2,528.7 1,176 - 12.9 5.6 15.3 33.4 - Yes P* gener.cl 271 515.6 307.9 67.5 3,121.4 984.6 16,725 2.8 29.0 9.1 13.4 24.2 0.1 Yes P sigdokoppers.cl 272 N.A. N.A. - 1,799.0 536.0 10,170 - 20.5 6.1 5.2 - - No P* siemens.com.br 273 N.A. N.A. - 1,865.4 383.7 N.A. 1,043.1 6.3 1.3 1.1 - 49.2 Yes P minerva.ind.br 274 N.A. 1,113.4 - 3,787.2 2,943.0 N.A. 2,100.0 21.8 17.0 30.6 - 100.0 Yes P* yanacocha.com.pe 275 249.4 161.7 54.2 2,241.9 1,584.0 4,686 - 13.0 9.2 9.8 11.9 - Yes P gsimec.com.mx 276 716.7 829.5 -13.6 6,792.6 2,643.3 14,430 450.4 3.7 1.4 4.7 34.6 21.7 Yes P* klabin.com.br 277 N.A. N.A. - 1,865.0 334.0 16,170 - 24.6 4.4 4.0 - - No P pernambucanas.com.br 278 958.9 950.0 0.9 1,629.5 1,037.9 7,034 1,880 49.0 31.2 24.9 46.9 91.9 No P cerrejoncoal.com 279 N.A. N.A. - 3,163.1 1,407.3 13,929 - 7.5 3.4 5.2 - - Yes P ripley.cl 280 617.2 521.8 18.3 3,916.5 1,035.7 N.A. - -34.2 -9.1 -17.4 30.3 - No P* telefonica.co 281 73.2 26.8 173.1 46,505.5 2,991.5 16,985 - 5.6 0.4 8.3 3.6 - Yes P quinenco.cl 282 N.A. N.A. - 7,297.0 6,461.0 500 - 17.1 15.1 55.0 - - Yes P - 283 N.A. N.A. - N.A. N.A. 7,065 - - - - - - No P* nextel.com.mx 284 130.0 141.6 -8.2 2,020.5 1,184.4 N.A. - 1.9 1.1 1.1 6.5 - No P* carrefour.com.co 285 47.8 247.8 -80.7 1,661.2 1,162.1 25,326 - 1.0 0.7 0.6 2.4 - Yes P bachoco.com.mx 286 535.8 372.3 43.9 2,588.7 2,215.4 N.A. 1,756 8.3 7.1 9.3 27.0 88.4 No P* drummondco.com 287 347.9 357.7 -2.7 4,823.9 1,608.8 6,001 - 10.8 3.6 8.8 17.5 - Yes P brascanresidential.com.br 288 278.5 291.2 -4.4 2,512.5 2,034.6 712 - 10.4 8.5 10.7 14.0 - Yes P* chilectra.cl 289 58.0 48.0 20.8 2,216.0 654.0 42,589 - 12.4 3.7 4.1 2.9 - Yes P oas.com 290 N.A. N.A. - 941.2 147.0 568 - 4.9 0.8 0.4 - - No P* samsung.com.mx 291 N.A. N.A. - 1,198.3 642.1 1,349 1,510.7 -11.0 -5.9 -3.6 - 76.8 No S enami.cl 292 N.A. N.A. - 2,857.8 2,148.2 3,051 - 43.1 32.4 47.4 - - No P penoles.com.mx 293 N.A. N.A. - 3,494.4 3,063.4 N.A. - 22.7 19.9 35.5 - - No P* spence.cl 294 N.A. N.A. - 863.0 487.0 N.A. - 9.4 5.3 2.4 - - No P* panpharma.com 295 N.A. N.A. - 6,258.9 705.9 3,102 - - - - - - No P* movistar.com.mx 296 511.0 609.5 -16.2 1,885.6 541.1 7,406 - 48.2 13.8 13.6 26.7 - Yes P* kimberly-clark.com.mx 297 151.8 147.2 3.1 1,629.5 416.5 16,931 924 2.2 0.6 0.5 7.9 48.2 Yes P kuo.com.mx 298 N.A. N.A. - N.A. N.A. N.A. - - - - - - No P jumbo.cl 299 N.A. N.A. - N.A. N.A. 3,000 - - - - - - No P* toyota.com.ar 300 P: Privately-owned S: State-owned P*: Foreign-owned 2012 - 2013 / AMÉRICAECONOMÍA 27 RANKING 500 GI.indd 27 17/8/12 16:44:02
  • 30.
    LATIN AMERICA´S LARGESTCOMPANIES SALES SALES VARIATION IN NET PROFITS NET PROFITS VARIATION IN E RK RK COUN COMPANY SECTOR 2011 US$ 2010 US$ SALES 2011 2010 PROFITS 20 11 10 -TRY Millions Millions 11/10 (%) US$ Millions US$ Millions 11/010 (%) M 301 268 ELEKTRO BRA Electricity 1,900.0 2,021.9 -6.0 262.5 270.3 -2.9 302 603 MC DONALD`S BRA Retail 1,900.0 1,600.0 18.8 N.A. N.A. - 303 287 EMBOTELLADORA ANDINA CHI Beverages & Brewing 1,884.8 1,897.5 -0.7 186.1 221.2 -15.9 304 318 INFRAERO BRA Transport & Logistics 1,883.0 1,745.7 7.9 78.0 16.0 387.5 305 297 SHELL CHILE (1) CHI Oil & Gas 1,882.8 1,836.8 2.5 N.A. N.A. - 306 333 AURORA ALIMENTOS BRA Foods 1,875.0 1,686.9 11.2 74.0 92.0 -19.6 307 306 TELEFÓNICA MOVIL CHILE CHI Telecommunications 1,873.8 1,862.6 0.6 312.2 421.0 -25.8 308 309 ENTEL PCS CHI Telecommunications 1,871.6 1,806.7 3.6 268.8 262.0 2.6 309 352 CHEVRON PETROLEUM COL Oil & Gas 1,862.5 1,568.4 18.8 121.5 88.3 37.6 310 310 CCU CHI Beverages & Brewing 1,859.3 1,789.7 3.9 235.4 236.4 -0.4 311 358 CEMENTOS ARGOS COL Cement 1,852.1 692.6 167.4 186.8 145.2 28.6 312 322 SUPERMERCADOS UNIMARC CHI Retail 1,834.5 1,729.0 6.1 N.A. N.A. - 313 388 COPA AIRLINES PAN Transport & Logistics 1,830.9 1,414.8 29.4 310.4 241.0 28.8 314 - CODELCO DIV. ANDINA CHI Mining 1,826.5 1,362.0 34.1 373.6 225.3 65.8 315 361 GENERAL MOTORS COLMOTORES COL Carmaking 1,822.4 1,529.2 19.2 25.4 77.7 -67.3 316 340 SUPERMERCADOS SANTA ISABEL CHI Retail 1,814.4 1,651.9 9.8 N.A. N.A. - 317 302 TIENDAS ELEKTRA MEX Retail 1,812.1 1,817.1 -0.3 N.A. N.A. - 318 601 MOSAIC BRA Chemicals & Pharma. 1,810.0 1,092.3 65.7 N.A. N.A. - 319 312 MARCOPOLO BRA Carmaking 1,796.0 1,779.2 0.9 182.9 178.0 2.8 320 354 HOLDING ALIMENTARIO DEL PERÚ PER Foods 1,790.8 1,563.6 14.5 76.3 69.9 9.2 321 356 SOTREQ BRA Carmaking 1,790.0 1,559.4 14.8 107.0 73.0 46.6 322 380 GVT HOLDING BRA Telecommunications 1,788.0 1,448.5 23.4 144.0 194.0 -25.8 323 383 GASCO CHI Oil & Gas 1,785.3 1,434.7 24.4 63.9 108.2 -40.9 324 335 DUPONT BRA Chemicals & Pharma. 1,783.0 1,667.1 7.0 196.0 260.0 -24.6 325 265 HONDA DE MÉXICO MEX Carmaking 1,778.1 2,072.9 -14.2 N.A. N.A. - 326 288 HYPERMARCAS BRA Chemicals & Pharma. 1,772.4 1,896.4 -6.5 -29.1 157.2 -118.5 327 422 MINERA DEL PACÍFICO CHI Mining 1,770.3 1,270.8 39.3 700.1 902.3 -22.4 328 293 PROFARMA BRA Retail 1,768.3 1,880.2 -6.0 15.4 20.6 -25.2 329 431 COTIA BRA Retail 1,766.0 1,245.6 41.8 46.0 20.0 130.0 330 289 AMPLA BRA Electricity 1,765.8 1,893.4 -6.7 112.1 129.7 -13.6 331 - CBMM BRA Mining 1,765.0 1,548.0 14.0 657.0 610.0 7.7 332 615 WHITE MARTINS GASES INDUSTRIAIS BRA Petrochemicals 1,757.0 N.A. - 269.0 241.0 11.6 333 279 TOYOTA MOTOR SALES DE MÉXICO MEX Carmaking 1,742.2 1,959.6 -11.1 N.A. N.A. - 334 490 HOME DEPOT (1) MEX Retail 1,739.2 1,084.2 60.4 N.A. N.A. - 335 364 SALFACORP CHI Construction 1,728.7 1,512.4 14.3 30.6 47.2 -35.2 336 345 TELEFÓNICA DE ARGENTINA ARG Telecommunications 1,727.6 1,606.7 7.5 153.1 101.7 50.5 337 341 LOJAS RENNER BRA Retail 1,726.5 1,651.3 4.6 179.6 184.9 -2.9 338 370 AJE GROUP (1) PER Beverages & Brewing 1,719.3 1,495.0 15.0 N.A. N.A. - 339 281 COPASA BRA Basic Services 1,719.2 1,943.4 -11.5 247.6 402.0 -38.4 340 - CAPUFE MEX Transport & Logistics 1,708.0 N.A. - N.A. N.A. - 341 413 DOW BRASIL BRA Petrochemicals 1,698.0 1,323.4 28.3 -361.0 -104.0 -247.1 342 339 ALL AMÉRICA LATINA BRA Transport & Logistics 1,691.7 1,652.6 2.4 130.6 147.6 -11.5 343 372 SUPERMERCADOS LA FAVORITA ECU Retail 1,688.3 1,486.1 13.6 125.5 111.4 12.6 344 326 GRUPO SCHINCARIOL BRA Beverages & Brewing 1,684.0 1,713.6 -1.7 -41.0 26.0 -257.7 345 301 GRUPO ABRIL BRA Mass Media 1,680.0 1,817.4 -7.6 99.0 87.0 13.8 346 244 IBERDROLA DE MÉXICO (1) MEX Electricity 1,679.9 2,227.0 -24.6 0.0 N.A. - 347 278 GERDAU COMERCIAL DE AÇOS BRA Retail 1,676.0 1,960.1 -14.5 31.0 0.5 6,100.0 348 327 CORPORATIVO FRAGUA MEX Retail 1,666.0 1,712.8 -2.7 60.8 59.2 2.7 349 435 GRUPO VILLACERO (1) MEX Steel & Metallurgy 1,665.0 1,230.4 35.3 N.A. N.A. - 350 246 CONSTRUTORA QUEIROZ GALVÃO BRA Construction 1,654.0 2,211.7 -25.2 27.0 143.0 -81.1 28 AMÉRICAECONOMÍA / 2012 - 2013 RANKING 500 GI.indd 28 17/8/12 16:44:09
  • 31.
    Nº 313 Pedro Heilborn, CEO OF Copa: the airline which dominates Panama´s logistics and transport hub. EBITDA EBITDA VARIATION TOTAL NET EQUITY WORK- EXPORTS NET NET EXPORT. Listed on ROE ROA OWNER- RK 2011 US$ 2010 US$ IN EBITDA ASSETS 2011 2011 US$ FORCE 2011 US$ MARGIN EBITDA AS % STOCK WEBSITE (www.) (%) (%) SHIP 11 Millions Millions 11/10 (%) US$ Millions Millions 2011 Millions (%) (%) OF SALES EXCHANGE 498.5 517.6 -3.7 1,822.6 729.6 3,879 - 36.0 14.4 13.8 26.2 - Yes P* elektro.com.br 301 N.A. N.A. - N.A. N.A. 48,000 - - - - - - No P* mcdonalds.com.br 302 N.A. N.A. - 1,438.3 809.2 6,471 - 23.0 12.9 9.9 - - Yes P koandina.com 303 382.0 248.0 54.0 7,928.0 604.0 13,802 - 12.9 1.0 4.1 20.3 - No S infraero.gov.br 304 N.A. N.A. - N.A. N.A. N.A. - - - - - - No P* shell.cl 305 N.A. N.A. - 1,065.0 215.0 15,645 599.4 34.4 6.9 3.9 - 32.0 No P aurora.com.br 306 766.2 844.3 -9.3 2,900.6 1,401.5 59 - 22.3 10.8 16.7 40.9 - No P* movistar.cl 307 761.0 704.8 8.0 1,760.8 686.3 1,943 9.9 39.2 15.3 14.4 40.7 0.5 No P entelpcs.cl 308 N.A. N.A. - 745.6 173.3 N.A. 34 70.1 16.3 6.5 - 1.8 No P* texaco.com 309 N.A. N.A. - 2,490.1 1,091.1 6,154 0.7 21.6 9.5 12.7 - - Yes P ccu.cl 310 344.1 276.4 24.5 8,471.9 5,865.0 N.A. 183 3.2 2.2 10.1 18.6 9.9 No P argos.com.co 311 N.A. N.A. - N.A. N.A. N.A. - - - - - - No P unimarc.cl 312 N.A. 324.0 - 3,065.8 1,389.5 5,000 - 22.3 10.1 17.0 - - Yes P copaair.com 313 N.A. N.A. - 3,550.3 N.A. 1,586 - - 10.5 20.5 - - No S codelco.cl 314 48.6 46.4 4.6 647.6 213.1 N.A. 211 11.9 3.9 1.4 2.7 11.6 No P* chevrolet.com.co 315 N.A. N.A. - N.A. N.A. N.A. - - - - - - No P santaisabel.cl 316 N.A. N.A. - N.A. N.A. N.A. - - - - - - No P elektra.com.mx 317 N.A. N.A. - N.A. N.A. 618 - - - - - - No P* mosaicco.com 318 247.4 239.0 3.5 1,802.5 619.5 N.A. 251.1 29.5 10.1 10.2 13.8 14.0 Yes P marcopolo.com.br 319 195.3 176.9 10.4 1,206.7 564.7 N.A. - 13.5 6.3 4.3 10.9 - Yes P grupogloria.com 320 N.A. N.A. - 882.0 272.0 3,500 - 39.3 12.1 6.0 - - No P sotreq.com.br 321 N.A. N.A. - 3,342.0 1,433.0 5,238 - 10.0 4.3 8.1 - - Yes P gvt.com.br 322 N.A. N.A. - 2,346.7 725.9 2,551 - 8.8 2.7 3.6 - - Yes P gasco.cl 323 N.A. N.A. - 1,879.0 977.0 3,500 - 20.1 10.4 11.0 - - No P* dupont.com.br 324 N.A. N.A. - N.A. N.A. 2,250 - - - - - - No P* honda.mx 325 284.9 396.9 -28.2 7,103.8 3,543.0 11,542 - -0.8 -0.4 -1.6 16.1 - Yes P hypermarkas.com.br 326 1,115.9 782.1 42.7 2,669.6 2,018.0 1,989 1,452.3 34.7 26.2 39.5 63.0 82.0 No P cmp.cl 327 38.8 44.5 -12.8 654.3 290.6 2,521 - 5.3 2.4 0.9 2.2 - Yes P profarma.com.br 328 N.A. N.A. - 650.0 102.0 200 - 45.1 7.1 2.6 - - Yes P cotia.com.br 329 406.5 380.4 6.9 2,483.5 872.0 8,038 - 12.9 4.5 6.3 23.0 - Yes P* ampla.com 330 N.A. N.A. - 2,236.0 694.0 1,460 1,884.7 94.7 29.4 37.2 0.0 - No P cbmm.com.br 331 584.0 506.0 15.4 2,669.0 1,367.0 4,211 67.9 19.7 10.1 15.3 33.2 3.9 No P whitemartins.com.br 332 N.A. N.A. - N.A. N.A. 1,000 - - - - - - No P* toyota.com.mx 333 N.A. N.A. - N.A. N.A. 11,000 - - - - - - No P* homedepot.com.mx 334 81.8 88.8 -7.9 1,499.5 509.6 30,676 - 6.0 2.0 1.8 4.7 - Yes P salfacorp.cl 335 495.8 462.8 7.1 1,708.3 810.2 2,200 - 18.9 9.0 8.9 28.7 - Yes P* telefonica.com.ar 336 304.0 288.2 5.5 1,590.5 615.7 13,340 - 29.2 11.3 10.4 17.6 - No P* sony.com.mx 337 N.A. N.A. - N.A. N.A. N.A. - - - - - - No P ajegroup.com 338 560.6 763.4 -26.6 4,407.4 2,416.9 N.A. - 10.2 5.6 14.4 32.6 - Yes S copasa.com.br 339 N.A. N.A. - N.A. N.A. 4,900 - - - - - - No P capufe.gob.mx 340 N.A. N.A. - 1,021.0 166.0 2,309 - -217.5 -35.4 -21.3 - - No P* dow.com 341 854.1 842.3 1.4 7,539.2 2,143.2 10,368 - 6.1 1.7 7.7 50.5 - Yes P all-logistica.com 342 N.A. N.A. - 1,163.3 814.9 6,600 - 15.4 10.8 7.4 - - Yes P supermaxi.com 343 142.0 231.0 -38.5 2,341.0 1,015.0 10,224 - -4.0 -1.8 -2.4 8.4 - No P schincariol.com.br 344 N.A. N.A. - 1,360.0 101.0 9,000 - 98.0 7.3 5.9 - - No P abril.com.br 345 N.A. N.A. - 2,509.9 2,105.0 450 - 0.0 0.0 0.0 - - No P* iberdrola.es 346 N.A. N.A. - 721.0 554.0 N.A. - 5.6 4.3 1.8 - - No P gerdau.com.br 347 101.7 98.8 2.9 714.9 387.4 19,653 - 15.7 8.5 3.6 6.1 - Yes P fragua.com.mx 348 N.A. N.A. - N.A. N.A. 3,125 - - - - - - No P villacero.com 349 N.A. N.A. - 1,370.0 1,018.0 16,862 - 2.7 2.0 1.6 - - No P queirozgalvao.com 350 P: Privately-owned S: State-owned P*: Foreign-owned 2012 - 2013 / AMÉRICAECONOMÍA 29 RANKING 500 GI.indd 29 17/8/12 16:44:17
  • 32.
    LATIN AMERICA´S LARGESTCOMPANIES SALES SALES VARIATION IN NET PROFITS NET PROFITS VARIATION IN E RK RK COUN COMPANY SECTOR 2011 US$ 2010 US$ SALES 2011 2010 PROFITS 20 11 10 -TRY Millions Millions 11/10 (%) US$ Millions US$ Millions 11/010 (%) M 351 403 PATAGONIA ARG Retail 1,648.2 1,355.4 21.6 39.3 29.2 34.6 352 355 CARVAJAL COL Printing 1,639.1 1,563.1 4.9 17.1 7.5 129.3 353 368 ROSSI RESIDENCIAL BRA Construction 1,637.8 1,497.9 9.3 181.1 209.9 -13.7 354 - IBM DE MÉXICO MEX Software & Data 1,637.5 N.A. - N.A. N.A. - 355 537 GOLDCORP MÉXICO MEX Mining 1,628.6 946.8 72.0 N.A. N.A. - 356 350 GRUPO ALGAR BRA Conglomerate 1,627.0 1,581.5 2.9 106.0 98.0 8.2 357 353 GUARARAPES - RIACHUELO BRA Textiles & Footwear 1,623.9 1,565.2 3.8 194.0 202.7 -4.3 358 489 COOXUPÉ BRA Foods 1,622.0 1,085.3 49.4 74.0 40.0 85.0 359 - GRUPO AGUIA BRANCA BRA Transport & Logistics 1,609.0 1,415.0 - 19.0 54.0 - 360 305 CELESTICA INC. MEX Electronics 1,608.3 1,803.5 -10.8 N.A. N.A. - 361 311 GRUPO MARTINS BRA Retail 1,604.0 1,785.4 -10.2 14.0 -6.0 333.3 362 374 OLÍMPICA COL Retail 1,588.2 1,483.8 7.0 45.0 38.1 18.2 363 384 CANDELARIA CHI Mining 1,588.0 1,434.1 10.7 623.0 562.3 10.8 364 406 MOVISTAR PERÚ PER Telecommunications 1,587.4 1,408.1 12.7 240.2 250.3 -4.0 365 342 DURATEX BRA Manufacturing 1,583.5 1,645.5 -3.8 199.5 280.2 -28.8 366 407 CMPC TISSUE CHI Pulp & Paper 1,582.9 1,344.6 17.7 -6.9 43.5 -115.9 367 362 UTE URU Electricity 1,581.7 1,524.1 3.8 145.7 430.3 -66.1 368 465 ALICORP PER Foods 1,578.5 1,340.1 17.8 120.8 100.0 20.8 369 319 CESP BRA Electricity 1,576.7 1,743.7 -9.6 57.9 55.8 3.8 370 382 CONTAX BRA Telecommunications 1,576.0 1,439.2 9.5 11.2 65.1 -82.8 371 547 GRANA Y MONTERO PER Conglomerate 1,574.4 923.2 70.5 124.4 94.0 32.4 372 - BELCORP PER Chemicals & Pharma. 1,572.2 1,281.0 - N.A. N.A. - 373 443 PAMPA ENERGÍA ARG Foods 1,568.2 1,213.7 29.2 -215.5 -11.6 -1,757.8 374 242 GAFISA BRA Construction 1,567.6 2,233.1 -29.8 -503.7 249.7 -301.7 375 347 HOMEX MEX Construction 1,566.8 1,591.3 -1.5 112.6 130.3 -13.6 376 337 CBA BRA Steel & Metallurgy 1,566.0 1,659.0 -5.6 -128.0 140.0 -191.4 377 291 GRUPO VITRO MEX Manufacturing 1,565.5 1,626.6 -3.8 27.6 -96.9 128.5 378 363 GRUPO CONDUMEX MEX Manufacturing 1,560.5 1,512.6 3.2 120.2 226.2 -46.8 379 482 BUENAVENTURA PER Mining 1,556.6 1,103.8 41.0 858.9 660.8 30.0 380 367 LOCALIZA BRA Transport & Logistics 1,555.7 1,498.7 3.8 155.5 153.6 1.2 381 325 CELPE BRA Electricity 1,553.5 1,716.5 -9.5 151.1 269.0 -43.8 382 376 M. DIAS BRANCO BRA Foods 1,551.9 1,466.8 5.8 195.4 211.0 -7.4 383 424 ZAFFARI E BOURBON BRA Retail 1,551.0 1,265.4 22.6 N.A. N.A. - 384 346 VALE FERTILIZANTES BRA Chemicals & Pharma. 1,549.0 1,606.5 -3.6 186.0 52.0 257.7 385 410 IOCHPE-MAXION BRA Carmaking 1,548.7 1,336.8 15.9 119.1 98.5 20.9 386 616 TIGRE - TUBOS E CONEXÕES BRA Manufacturing 1,546.7 1,470.0 5.2 N.A. N.A. - 387 404 CTEEP - COMPANHIA DE TRANSMISSÃO PAULISTA BRA Electricity 1,546.4 1,354.2 14.2 487.9 183.3 166.2 388 373 INTERCEMENT BRASIL – EX C. CORRÊA CIMENTO BRA Cement 1,538.0 1,485.2 3.6 163.0 120.0 35.8 389 332 ULTRAGAZ BRA Oil & Gas 1,534.0 1,690.3 -9.2 29.0 39.0 -25.6 390 349 ALUMBRERA ARG Mining 1,522.0 1,590.0 -4.3 N.A. N.A. - 391 357 CASAS GEO MEX Construction 1,517.3 1,551.0 -2.2 103.0 114.5 -10.0 392 411 GRUPO EMPRESARIAL ANGELES (1) MEX Health Services 1,511.9 1,336.1 13.2 N.A. N.A. - 393 397 SUKARNE MEX Foods 1,511.3 1,373.1 10.1 108.9 44.9 142.7 394 365 EMPRESAS BANMÉDICA CHI Health Services 1,509.9 1,508.7 0.1 83.1 94.5 -12.1 395 421 EMPRESAS NAVIERAS CHI Transport & Logistics 1,508.1 1,273.9 18.4 -23.1 43.8 -152.7 396 348 ALUNORTE BRA Steel & Metallurgy 1,508.0 1,591.2 -5.2 17.0 100.1 -83.0 397 386 CODENSA COL Electricity 1,507.5 1,429.0 5.5 231.1 246.3 -6.2 398 360 RIPLEY CHILE CHI Retail 1,507.3 1,544.1 -2.4 79.4 78.4 1.3 399 447 BARRICK MISQUICHILCA PER Mining 1,497.0 1,200.0 24.8 650.6 626.3 3.9 400 - SYNGENTA AGRO MEX Agribusiness 1,496.2 N.A. - N.A. N.A. - 30 AMÉRICAECONOMÍA / 2012 - 2013 RANKING 500 GI.indd 30 17/8/12 16:44:25
  • 33.
    Nº 374 Alicei Duilio Calciolari, CEO of Gafisa: record losses in the middle of Brazil´s property boom. EBITDA EBITDA VARIATION TOTAL NET EQUITY WORK- EXPORTS NET NET EXPORT. Listed on ROE ROA OWNER- RK 2011 US$ 2010 US$ IN EBITDA ASSETS 2011 2011 US$ FORCE 2011 US$ MARGIN EBITDA AS % STOCK WEBSITE (www.) (%) (%) SHIP 11 Millions Millions 11/10 (%) US$ Millions Millions 2011 Millions (%) (%) OF SALES EXCHANGE 73.4 55.8 31.5 469.8 198.1 11,000 - 19.8 8.4 2.4 4.5 - Yes P laanonima.com.ar 351 206.7 197.7 4.5 2,094.6 726.5 N.A. - 2.4 0.8 1.0 12.6 - No P carvajal.com 352 216.3 225.0 -3.9 3,971.8 1,484.4 N.A. - 12.2 4.6 11.1 13.2 - Yes P rossiresidencial.com.br 353 N.A. N.A. - N.A. N.A. N.A. - - - - - - No P ibm.com.mx 354 N.A. N.A. - 12,804.0 N.A. 5,310 - - - - - - No P* goldcorp.com 355 N.A. N.A. - 2,136.0 618.0 N.A. - 17.2 5.0 6.5 - - Yes P algar.com.br 356 321.5 338.5 -5.0 1,978.3 1,193.3 N.A. - 16.3 9.8 11.9 19.8 - Yes P lojasriachuelo.com.br 357 N.A. N.A. - 1,216.0 263.0 1,995 736.4 28.1 6.1 4.6 - 45.4 Yes P cooxupe.com.br 358 N.A. N.A. - 1,327.0 374.0 2,819 - 5.1 1.4 1.2 - - No P gab.com.br 359 N.A. N.A. - N.A. N.A. N.A. - - - - - - No P celestica.com 360 N.A. N.A. - 607.0 97.0 N.A. - 14.4 2.3 0.9 - - No P martins.com.br 361 111.9 67.1 66.9 915.1 435.0 N.A. - 10.3 4.9 2.8 7.0 - No P olimpica.com.co 362 832.1 722.3 15.2 1,681.6 1,309.5 1,500 1,357.4 47.6 37.0 39.2 52.4 85.5 No P* phelpsdodge.com 363 553.3 512.3 8.0 1,432.8 413.4 1,200 - 58.1 16.8 15.1 34.9 - Yes P* movistar.com.pe 364 536.7 652.8 -17.8 3,632.7 1,966.7 10,667 - 10.1 5.5 12.6 33.9 - Yes P duratex.com.br 365 172.5 161.8 6.6 2,328.3 804.7 6,965 25.0 -0.9 -0.3 -0.4 10.9 1.6 No P cmpctissue.cl 366 N.A. 808.8 - 6,083.0 4,984.9 N.A. - 2.9 2.4 9.2 - - No S ute.com.uy 367 204.7 187.2 9.4 1,143.2 683.7 4,500 192.4 17.7 10.6 7.7 13.0 12.2 Yes P* alicorp.com.pe 368 906.8 879.1 3.2 9,727.1 5,394.0 1,330 - 1.1 0.6 3.7 57.5 - Yes S cesp.com.br 369 140.0 178.3 -21.5 1,411.4 263.2 107,200 - 4.3 0.8 0.7 8.9 - Yes P contax.com.br 370 180.2 142.1 26.8 1,380.8 533.5 N.A. - 23.3 9.0 7.9 11.4 - Yes P gym.com.pe 371 N.A. N.A. - N.A. N.A. N.A. - - - - - - No P belcorp.biz 372 146.2 157.8 -7.4 2,650.3 546.0 N.A. - -39.5 -8.1 -13.7 9.3 - No P pampaenergia.com 373 -276.9 357.0 -177.6 5,068.0 1,411.9 N.A. - -35.7 -9.9 -32.1 -17.7 - Yes P gafisa.com.br 374 215.6 264.6 -18.5 2,966.3 967.0 11,737 - 11.6 3.8 7.2 13.8 - Yes P homex.com.mx 375 138.0 295.0 -53.2 5,346.0 3,135.0 5,650 228.3 -4.1 -2.4 -8.2 8.8 14.6 No P cba.ind.br 376 252.9 195.8 29.2 2,393.8 -6.0 16,797 - -460.0 1.2 1.8 16.2 - Yes P vitro.com.mx 377 N.A. N.A. - 1,473.9 923.7 15,000 - 13.0 8.2 7.7 - - No P condumex.com.mx 378 769.2 486.9 58.0 3,427.4 3,164.2 N.A. 851.7 27.1 25.1 55.2 49.4 54.7 Yes P* buenaventura.com.pe 379 437.8 404.1 8.3 2,137.5 597.4 4,533 - 26.0 7.3 10.0 28.1 - Yes P localiza.com 380 303.2 434.2 -30.2 2,163.1 856.9 1,657 - 17.6 7.0 9.7 19.5 - Yes P* celpe.com.br 381 256.6 279.9 -8.3 1,630.3 1,069.3 N.A. - 18.3 12.0 12.6 16.5 - Yes P mdiasbranco.com.br 382 N.A. N.A. - N.A. N.A. 9,203 - - - - - - No P zaffari.com.br 383 326.0 193.0 68.9 4,311.0 3,341.0 4,487 - 5.6 4.3 12.0 21.0 - Yes P valefertilizantes.com 384 219.2 187.4 17.0 1,328.8 489.7 N.A. - 24.3 9.0 7.7 14.2 - Yes P iochpe-maxion.com.br 385 N.A. N.A. - N.A. N.A. 7,000 - - - - - - No P tigre.com.br 386 775.5 687.9 12.7 4,483.2 2,420.0 1,458 - 20.2 10.9 31.6 50.1 - No P cteep.com.br 387 370.0 328.0 12.8 2,652.0 1,215.0 5,061 - 13.4 6.1 10.6 24.1 - No P cimentocaue.com.br 388 150.0 163.0 -8.0 642.0 237.0 4,129 - 12.2 4.5 1.9 9.8 - No P ultragaz.com.br 389 N.A. N.A. - N.A. N.A. N.A. - - - - - - No P* alumbrera.com.ar 390 277.1 273.4 1.4 2,746.4 640.8 25,361 - 16.1 3.8 6.8 18.3 - Yes P casasgeo.com 391 N.A. N.A. - 5,605.1 1,564.1 26,147 - - - - - - No P grupoempresarialangeles.com 392 N.A. N.A. - 686.0 366.6 6,400 - 29.7 15.9 7.2 - - No P sukarne.com.mx 393 166.1 172.6 -3.8 1,114.1 312.8 14,241 - 26.6 7.5 5.5 11.0 - Yes P empresasbanmedica.cl 394 N.A. N.A. - 785.2 199.1 2,192 - -11.6 -2.9 -1.5 - - Yes P empresasnavieras.com 395 186.0 240.0 -22.5 3,575.0 2,439.0 1,615 1,432.4 0.7 0.5 1.1 12.3 95.0 No P alunorte.net 396 493.1 504.3 -2.2 2,631.3 1,330.8 N.A. - 17.4 8.8 15.3 32.7 - No P* codensa.com.co 397 N.A. N.A. - 1,841.8 1,070.8 13,929 - 7.4 4.3 5.3 - - No P ripley.cl 398 1,074.6 896.3 19.9 2,255.4 1,543.5 N.A. 1,497.0 42.1 28.8 43.5 71.8 100.0 Yes P* barrick.com 399 N.A. N.A. - N.A. N.A. 2,500 - - - - - - No P syngenta.com.mx 400 P: Privately-owned S: State-owned P*: Foreign-owned 2012 - 2013 / AMÉRICAECONOMÍA 31 RANKING 500 GI.indd 31 17/8/12 16:44:32
  • 34.
    LATIN AMERICA´S LARGESTCOMPANIES SALES SALES VARIATION IN NET PROFITS NET PROFITS VARIATION IN E RK RK COUN COMPANY SECTOR 2011 US$ 2010 US$ SALES 2011 2010 PROFITS 20 11 10 -TRY Millions Millions 11/10 (%) US$ Millions US$ Millions 11/010 (%) M 401 359 V&M BRA Steel & Metallurgy 1,492.0 1,544.2 -3.4 318.0 309.0 2.9 402 - PAGUE MENOS BRA Retail 1,484.0 1,156.0 - 58.0 38.0 - 403 - VOTORANTIM ANDINA CHI Mining 1,482.8 811.1 82.8 102.1 499.8 -79.6 404 344 LIQUIGÁS BRA Retail 1,480.0 1,611.4 -8.2 56.0 71.0 -21.1 405 375 LEAR CORPORACIÓN MÉXICO MEX Carmaking 1,479.7 1,468.7 0.7 N.A. N.A. - 406 419 NUEVA EPS COL Health Services 1,474.6 1,277.4 15.4 7.9 10.9 -27.8 407 276 NOKIA BRA Electronics 1,465.0 1,986.0 -26.2 N.A. N.A. - 408 493 KENWORTH MEXICANA MEX Carmaking 1,458.9 1,069.9 36.4 N.A. 60.9 - 409 315 APERAM INOX – EX ARCELOR MITTAL INOX BRA Steel & Metallurgy 1,457.0 1,766.2 -17.5 -87.0 N.A. - 410 446 DROGASIL BRA Retail 1,455.1 1,203.5 20.9 36.6 53.4 -31.5 411 414 OHL BRASIL BRA Transport & Logistics 1,445.8 1,311.1 10.3 215.6 182.6 18.1 412 402 3M DO BRASIL BRA Petrochemicals 1,440.0 1,355.9 6.2 N.A. N.A. - 413 395 C. VALE BRA Agribusiness 1,429.0 1,384.1 3.2 27.0 18.0 50.0 414 328 FASA CHI Retail 1,426.1 1,711.7 -16.7 16.8 -4.8 450.0 415 499 FERREYROS PER Conglomerate 1,419.8 1,053.7 34.7 72.3 43.2 67.6 416 432 PREZUNIC SUPERMERCADOS BRA Retail 1,414.0 1,244.7 13.6 N.A. N.A. - 417 425 VIAKABLE MEX Electronics 1,412.2 1,251.6 12.8 N.A. N.A. - 418 398 PETROBRAS (1) CHI Oil & Gas 1,407.1 1,372.8 2.5 N.A. N.A. - 419 436 AMÉRICA MOVIL ECUADOR ECU Telecommunications 1,403.0 1,228.0 14.3 N.A. N.A. - 420 329 COELCE BRA Electricity 1,400.6 1,710.3 -18.1 251.2 283.2 -11.3 421 494 MINERA VALPARAÍSO CHI Conglomerate 1,395.0 1,069.8 30.4 202.0 233.9 -13.6 422 262 IFH PERÚ HOLDING PER Conglomerate 1,392.3 1,058.3 31.6 237.5 183.0 29.8 423 438 RENAULT ARGENTINA (1) ARG Carmaking 1,385.0 1,225.0 13.1 N.A. N.A. - 424 - NAVISTAR INTERNACIONAL MEX Carmaking 1,382.5 N.A. - N.A. N.A. - 425 408 ALPARGATAS BRA Textiles & Footwear 1,372.6 1,343.9 2.1 163.9 183.9 -10.9 426 409 TERPEL (1) CHI Oil & Gas 1,371.6 1,338.1 2.5 N.A. N.A. - 427 572 INFRAESTRUCTURA Y TRANSPORTES MÉXICO MEX Mining 1,368.3 N.A. - 192.1 N.A. - 428 471 GRUPO WONG PER Retail 1,364.7 1,099.3 24.1 61.3 39.0 57.2 429 391 GRUPO ACS MEX Construction 1,357.6 1,404.6 -3.3 N.A. N.A. - 430 617 PROCTER & GAMBLE BRA Chemicals & Pharma. 1,353.0 N.A. - -150.0 -141.0 -6.4 431 369 TELEFÓNICA CHILE CHI Telecommunications 1,348.1 1,495.3 -9.8 130.4 223.7 -41.7 432 377 CPFL PIRATININGA BRA Electricity 1,345.6 1,462.3 -8.0 164.4 181.1 -9.2 433 385 GRUPO OMNILIFE (1) MEX Health Services 1,344.9 1,432.9 -6.1 N.A. N.A. - 434 303 DELTA CONSTRUÇÕES BRA Construction 1,344.0 1,814.7 -25.9 17.0 117.0 -85.5 435 418 DROGARIA SÃO PAULO BRA Retail 1,337.0 1,286.3 3.9 19.0 11.0 72.7 436 508 COLBÚN CHI Electricity 1,332.8 1,024.2 30.1 5.2 112.3 -95.4 437 415 MOLYMET CHI Steel & Metallurgy 1,330.3 1,298.2 2.5 103.2 91.7 12.5 438 509 PETROMINERALES COL Oil & Gas 1,325.5 1,020.4 29.9 460.2 233.2 97.3 439 452 MINSUR PER Mining 1,322.3 1,196.0 10.6 294.8 377.1 -21.8 440 389 CMPC CELULOSA CHI Pulp & Paper 1,316.1 1,412.9 -6.9 260.5 322.3 -19.2 441 506 PERUANA DE COMBUSTIBLES (1) PER Oil & Gas 1,312.3 1,025.9 27.9 5.4 4.2 29.2 442 502 ERICSSON BRA Electronics 1,309.0 1,034.1 26.6 33.0 -6.0 650.0 443 437 PARIS CHI Retail 1,306.4 1,227.0 6.5 N.A. N.A. - 444 430 LOJAS MARISA BRA Retail 1,306.3 1,245.8 4.9 94.6 125.2 -24.4 445 464 ALCOA BRA Steel & Metallurgy 1,302.0 1,151.2 13.1 -66.0 -169.0 60.9 446 423 CELPA BRA Electricity 1,297.5 1,266.9 2.4 -208.5 -60.5 -244.6 447 416 ENERGISA BRA Electricity 1,293.6 1,293.0 0.0 113.0 116.8 -3.3 448 - PERÚ LNG PER Oil & Gas 1,287.8 288.2 346.8 26.7 -85.6 131.1 449 401 BANDEIRANTE ENERGIA BRA Electricity 1,285.1 1,355.9 -5.2 118.8 167.0 -28.9 450 427 OXITENO BRA Oil & Gas 1,284.0 1,250.3 2.7 N.A. N.A. - 32 AMÉRICAECONOMÍA / 2012 - 2013 RANKING 500 GI.indd 32 17/8/12 16:44:39
  • 35.
    Nº 428 Efraín Wong, CEO of Grupo Wong: The more Peru consumes, the more Wong´s profits rise. EBITDA EBITDA VARIATION TOTAL NET EQUITY WORK- EXPORTS NET NET EXPORT. Listed on ROE ROA OWNER- RK 2011 US$ 2010 US$ IN EBITDA ASSETS 2011 2011 US$ FORCE 2011 US$ MARGIN EBITDA AS % STOCK WEBSITE (www.) (%) (%) SHIP 11 Millions Millions 11/10 (%) US$ Millions Millions 2011 Millions (%) (%) OF SALES EXCHANGE N.A. N.A. - 2,833.0 1,955.0 6,352 - 16.3 11.2 21.3 - - Yes P vmtubes.com.br 401 123.0 77.0 - 536.0 131.0 13,000 - 44.3 10.8 3.9 8.3 - No P paguemenos.com.br 402 136.5 518.8 -73.7 4,847.8 3,263.9 N.A. - 3.1 2.1 6.9 9.2 - No P* - 403 82.0 130.0 -36.9 569.0 371.0 3,223 - 15.1 9.8 3.8 5.5 - No P liquigas.com.br 404 N.A. N.A. - N.A. N.A. 34,100 - - - - - - No P lear.com 405 N.A. N.A. - 534.6 51.4 N.A. - 15.3 1.5 0.5 - - No P nuevaeps.com.co 406 N.A. N.A. - N.A. N.A. 2,000 - - - - - - No P* nokia.com.br 407 N.A. N.A. - N.A. N.A. 2,737 - - - - - - No P* kenmex.com 408 137.0 206.0 -33.5 2,630.0 1,060.0 9,800 275.3 -8.2 -3.3 -6.0 9.4 18.9 No P arcelormittalinoxbrasil.com.br 409 72.1 86.1 -16.3 1,689.0 1,173.5 N.A. - 3.1 2.2 2.5 5.0 - Yes P drogasil.com.br 410 539.6 500.7 7.8 2,958.9 745.5 N.A. - 28.9 7.3 14.9 37.3 - Yes P* ohlbrasil.com.br 411 N.A. N.A. - N.A. N.A. 4,000 - - - - - - No P* 3m.com.br 412 N.A. N.A. - 1,107.0 399.0 5,631 212.0 6.8 2.4 1.9 - 14.8 No P cvale.com.br 413 64.1 42.1 52.3 700.0 111.8 9,393 - 15.0 2.4 1.2 4.5 - Yes P fasa.cl 414 158.3 125.8 25.8 1,245.9 395.2 N.A. 12.0 18.3 5.8 5.1 11.1 0.8 Yes P ferreyros.com.pe 415 N.A. N.A. - N.A. N.A. 7,957 - - - - - - No P v2.prezunic.com.br 416 N.A. N.A. - 764.8 269.7 3,552 - - - - - - No P viakable.com 417 N.A. N.A. - N.A. N.A. N.A. - - - - - - No P* petrobrastuchile.cl 418 N.A. N.A. - N.A. N.A. N.A. - - - - - - No P - 419 402.4 484.4 -16.9 1,787.5 784.2 N.A. - 32.0 14.1 17.9 28.7 - Yes P* coelce.com.br 420 N.A. N.A. - 9,371.3 6,908.6 271 - 2.9 2.2 14.5 - - No P minera.cl 421 N.A. N.A. - 11,022.4 1,451.7 N.A. - 16.4 2.2 17.1 - - Yes P ifhperu.com 422 N.A. N.A. - N.A. N.A. N.A. - - - - - - No P* renault.com.ar 423 N.A. N.A. - N.A. N.A. 2,000 - - - - - - No P internacionalcamiones.com 424 195.0 225.1 -13.4 1,302.1 787.8 N.A. - 20.8 12.6 11.9 14.2 - Yes P alpargatas.com.br 425 N.A. N.A. - N.A. N.A. N.A. - - - - - - No P* terpelchile.cl 426 N.A. N.A. - 2,284.7 1,507.9 9,915 - 12.7 8.4 14.0 - - No P gmexico.com.mx 427 123.2 76.4 61.2 1,369.9 644.7 N.A. - 9.5 4.5 4.5 9.0 - No P* cencosud.cl 428 N.A. N.A. - N.A. N.A. 1,100 - - - - - - No P grupoacs.com 429 N.A. N.A. - 3,073.0 1,600.0 2,862 - -9.4 -4.9 -11.1 - - No P pg.com 430 517.4 668.5 -22.6 2,539.6 1,226.6 5,454 - 10.6 5.1 9.7 38.4 - Yes P* telefonicachile.cl 431 314.4 327.1 -3.9 1,275.0 207.4 N.A. - 79.3 12.9 12.2 23.4 - Yes P cpfl.com.br 432 N.A. N.A. - N.A. N.A. N.A. - - - - - - No P omnilife.com.mx 433 N.A. 214.0 - 920.0 573.0 14,835 - 3.0 1.8 1.3 - - No P deltaconstrucao.com.br 434 N.A. N.A. - 421.0 119.0 7,460 - 16.0 4.5 1.4 - - Yes P drogariasaopaulo.com.br 435 175.8 260.3 -32.5 5,619.5 3,462.2 922 - 0.2 0.1 0.4 13.2 - Yes P colbun.cl 436 N.A. N.A. - 1,609.9 881.9 1,563 1,007.9 11.7 6.4 7.8 - 75.8 Yes P molymet.cl 437 832.2 619.7 34.3 2,077.4 974.9 N.A. - 47.2 22.2 34.7 62.8 - No P petrominerales.com 438 562.6 567.9 -0.9 1,886.6 1,764.4 N.A. 322.8 16.7 15.6 22.3 42.5 24.4 Yes P* minsur.com.pe 439 30.9 N.A. - 4,510.3 1,672.3 1,775 1,177.3 15.6 5.8 19.8 2.3 89.5 No P cmpc.cl 440 16.1 13.0 23.5 156.7 46.2 N.A. - 11.7 3.5 0.4 1.2 - No P pecsa.com 441 N.A. N.A. - 1,467.0 397.0 N.A. - 8.3 2.2 2.5 - - Yes P* ericsson.com/br/ 442 N.A. 80.0 - N.A. N.A. N.A. - - - - - - No P paris.cl 443 213.1 233.7 -8.8 1,296.8 457.3 N.A. - 20.7 7.3 7.2 16.3 - Yes P marisa.com.br 444 N.A. N.A. - 4,854.0 2,443.0 3,547 238.1 -2.7 -1.4 -5.1 - 18.3 No P* alcoa.com 445 116.8 196.4 -40.5 2,323.3 266.8 2,221 - -78.1 -9.0 -16.1 9.0 - Yes P gruporede.com.br 446 295.8 304.9 -3.0 2,270.2 695.3 5,561 - 16.3 5.0 8.7 22.9 - Yes P energisa.com.br 447 277.2 3.8 7,242.3 3,660.1 83.7 N.A. 1,284.0 31.9 0.7 2.1 21.5 99.7 No P huntoil.com 448 256.6 291.5 -12.0 1,374.1 421.9 1,098 - 28.2 8.6 9.2 20.0 - Yes P bandeirante.com.br 449 139.0 128.0 8.6 1,842.0 N.A. 1,595 - - - - 10.8 - No P ultrapar.com 450 P: Privately-owned S: State-owned P*: Foreign-owned 2012 - 2013 / AMÉRICAECONOMÍA 33 RANKING 500 GI.indd 33 17/8/12 16:44:46
  • 36.
    LATIN AMERICA´S LARGESTCOMPANIES SALES SALES VARIATION IN NET PROFITS NET PROFITS VARIATION IN E RK RK COUN COMPANY SECTOR 2011 US$ 2010 US$ SALES 2011 2010 PROFITS 20 11 10 -TRY Millions Millions 11/10 (%) US$ Millions US$ Millions 11/010 (%) M 451 440 JSL BRA Transport & Logistics 1,283.8 1,217.4 5.5 30.3 55.8 -45.7 452 474 PLUSPETROL PERÚ CORPORATION PER Oil & Gas 1,281.0 1,125.0 13.9 N.A. N.A. - 453 387 GRUPO IUSA (1) MEX Manufacturing 1,276.2 1,428.6 -10.7 N.A. N.A. - 454 451 METALSA MEX Carmaking 1,271.3 1,196.5 6.3 N.A. N.A. - 455 434 GRUPO PALACIO DE HIERRO MEX Retail 1,268.9 1,234.5 2.8 74.3 71.4 4.1 456 390 GRUPO GALVÃO BRA Construction 1,265.0 1,323.0 -4.4 -45.0 36.0 -225.0 457 428 DAIMLER MEX Carmaking 1,264.2 1,250.2 1.1 108.0 14.8 629.7 458 371 SANMINA - SCI SYSTEMS DE MÉXICO (1) MEX Electronics 1,257.3 1,493.2 -15.8 57.7 73.8 -21.8 459 477 EMPRESA ELECTRICA DEL NORTE GRANDE CHI Electricity 1,256.6 1,120.2 12.2 178.6 200.1 -10.7 460 511 MASISA CHI Manufacturing 1,251.2 1,017.3 23.0 68.9 72.4 -4.8 461 529 PRIMO SCHINCARIOL BRA Beverages & Brewing 1,248.0 964.6 29.4 -83.0 -26.0 -219.2 462 544 C.I. PRODECO COL Retail 1,247.2 927.6 34.5 117.3 84.6 38.6 463 466 CHRYSLER (1) ARG Carmaking 1,245.0 1,145.0 8.7 N.A. N.A. - 464 498 ALKOSTO COL Retail 1,242.0 1,056.2 17.6 42.1 39.4 7.0 465 527 VOLCAN PER Mining 1,240.4 973.3 27.4 370.3 278.1 33.1 466 399 MAGNESITA BRA Mining 1,236.2 1,366.2 -9.5 52.2 55.1 -5.3 467 400 CEG BRA Oil & Gas 1,228.3 1,358.6 -9.6 134.2 138.1 -2.8 468 417 CGE DISTRIBUCIÓN CHI Electricity 1,217.3 1,292.4 -5.8 -33.9 25.8 -231.4 469 476 ELECTRICARIBE COL Electricity 1,217.0 1,122.9 8.4 39.2 58.3 -32.8 470 - GRUPO SAGA BRA Retail 1,217.0 274.0 - 25.0 9.0 - 471 420 RIO GRANDE ENERGIA BRA Electricity 1,215.2 1,275.5 -4.7 128.4 144.6 -11.2 472 429 EDITORA ABRIL BRA Mass Media 1,214.0 1,247.5 -2.7 143.0 116.0 23.3 473 496 ALUAR ARG Steel & Metallurgy 1,212.6 1,065.4 13.8 126.5 163.7 -22.7 474 504 ULTRAFÉRTIL BRA Chemicals & Pharma. 1,208.0 1,029.5 17.3 65.0 -25.0 360.0 475 396 OHL MÉXICO MEX Transport & Logistics 1,203.7 1,377.2 -12.6 270.4 232.4 16.4 476 461 DANONE (1) MEX Foods 1,198.1 1,154.2 3.8 N.A. N.A. - 477 559 PROCESADORA SUDAMERICANA PER Steel & Metallurgy 1,197.0 987.8 21.2 N.A. N.A. - 478 439 UNILEVER DE MÉXICO (1) MEX Chemicals & Pharma. 1,195.1 1,217.8 -1.9 N.A. N.A. - 479 485 MAHLE METAL LEVE BRA Carmaking 1,192.4 1,094.3 9.0 100.6 49.7 102.4 480 484 SONY DE MÉXICO (1) MEX Electronics 1,192.1 1,103.6 8.0 N.A. N.A. - 481 - LBR LACTEOS BRASIL BRA Foods 1,180.0 N.A. - -162.0 N.A. - 482 412 CELGPAR BRA Electricity 1,178.9 1,326.6 -11.1 -353.1 -378.4 6.7 483 444 URBI DESARROLLOS URBANOS MEX Construction 1,170.7 1,212.7 -3.5 171.3 136.3 25.7 484 487 FINNING CHILE (1) CHI Machinery 1,167.8 1,090.9 7.0 N.A. N.A. - 485 475 TUPY BRA Carmaking 1,165.1 1,123.2 3.7 108.4 92.7 16.9 486 - KOMATSU CUMMINS CHILE CHI Conglomerate 1,164.2 1,026.7 13.4 98.6 90.8 8.6 487 - CISA TRADING BRA Retail 1,149.0 746.0 - 33.0 22.0 - 488 - CODELCO DIV. SALVADOR CHI Mining 1,148.3 1,163.7 -1.3 113.8 44.8 154.0 489 450 HOLCIM APASCO MEX Cement 1,147.5 1,198.7 -4.3 N.A. N.A. - 490 479 MINERA ZALDÍVAR CHI Mining 1,146.6 1,123.1 2.1 488.7 536.4 -8.9 491 551 AMÉRICA MÓVIL PERÚ – CLARO PER Telecommunications 1,141.6 1,001.4 14.0 N.A. N.A. - 492 453 GAS NATURAL FENOSA MÉXICO MEX Electricity 1,137.1 1,186.5 -4.2 85.8 99.0 -13.3 493 - SHOUGANG HIERRO PERÚ PER Mining 1,137.1 674.6 68.6 455.4 283.2 60.8 494 536 SONDA CHI Software & Data 1,136.8 951.1 19.5 77.9 71.6 8.8 495 - BIOMAX COL Oil & Gas 1,134.1 N.A. - 6.0 N.A. - 496 379 REPSOL COMERCIAL – RECOSAC PER Oil & Gas 1,123.6 921.0 22.0 21.4 20.1 6.5 497 - GRUPO THYSSENKRUPP MEX Machinery 1,116.3 N.A. - N.A. N.A. - 498 546 UCP BACKUS & JOHNSTON PER Beverages & Brewing 1,114.8 1,144.9 -2.6 271.0 186.4 45.4 499 469 NOVARTIS BRA Chemicals & Pharma. 1,114.0 1,132.7 -1.6 78.0 97.0 -19.6 500 392 POSITIVO INFORMATICA BRA Electronics 1,109.5 1,397.0 -20.6 -36.2 53.5 -167.7 34 AMÉRICAECONOMÍA / 2012 - 2013 RANKING 500 GI.indd 34 17/8/12 16:44:57
  • 37.
    Nº 494 Andrés Navarro, CEO of Sonda: the Chilean software and data firm made a timely wager on Brazil. EBITDA EBITDA VARIATION TOTAL NET EQUITY WORK- EXPORTS NET NET EXPORT. Listed on ROE ROA OWNER- RK 2011 US$ 2010 US$ IN EBITDA ASSETS 2011 2011 US$ FORCE 2011 US$ MARGIN EBITDA AS % STOCK WEBSITE (www.) (%) (%) SHIP 11 Millions Millions 11/10 (%) US$ Millions Millions 2011 Millions (%) (%) OF SALES EXCHANGE 229.8 198.1 16.0 2,049.7 449.6 N.A. - 6.7 1.5 2.4 17.9 - Yes P juliosimoeslogistica.com.br 451 N.A. N.A. - N.A. N.A. N.A. 1,281.0 - - - - 100.0 No P pluspetrol.net 452 N.A. N.A. - N.A. N.A. 7,358 - - - - - - No P grupo-iusa.com 453 N.A. N.A. - N.A. N.A. 6,300 - - - - - - No P metalsa.com.mx 454 168.3 173.9 -3.2 1,565.0 834.5 10,614 - 8.9 4.7 5.9 13.3 - Yes P elpalaciodehierro.com.mx 455 29.0 118.0 -75.4 1,283.0 229.0 N.A. - -19.7 -3.5 -3.6 2.3 - No P galvaoengenharia.com.br 456 N.A. N.A. - 2,055.2 493.8 5,192 - 21.9 5.3 8.5 - - No P* daimler.com.mx 457 N.A. N.A. - 583.4 273.6 8,930 - 21.1 9.9 4.6 - - No P* sanmina-sci.com 458 N.A. N.A. - 2,811.0 1,677.8 781 - 10.6 6.4 14.2 - - Yes P e-cl.cl 459 197.8 148.0 33.6 2,683.0 1,400.1 8,623 171.4 4.9 2.6 5.5 15.8 13.7 Yes P masisa.cl 460 N.A. N.A. - 2,009.0 673.0 5,470 - -12.3 -4.1 -6.7 - - Yes P schincariol.com.br 461 250.2 131.5 90.3 1,270.6 407.3 N.A. - 28.8 9.2 9.4 20.1 - No P prodeco.com.co 462 N.A. N.A. - N.A. N.A. 2,000 - - - - - - No P* chrysler.com.ar 463 69.9 60.1 16.3 970.0 473.0 N.A. - 8.9 4.3 3.4 5.6 - No P alkosto.com.co 464 641.5 499.7 28.4 1,885.9 1,333.3 N.A. 160.4 27.8 19.6 29.9 51.7 12.9 Yes P volcan.com.pe 465 210.4 277.1 -24.1 2,843.7 1,406.5 6,782 141.0 3.7 1.8 4.2 17.0 11.4 Yes P magnesita.com.br 466 281.4 300.7 -6.4 1,027.8 462.7 440 - 29.0 13.1 10.9 22.9 - Yes P ceg.com.br 467 N.A. N.A. - 1,208.6 524.5 788 - -6.5 -2.8 -2.8 - - Yes P cge.cl 468 120.3 158.3 -24.0 2,225.3 1,031.5 7,715 - 3.8 1.8 3.2 9.9 - No P eletricaribe.com 469 N.A. N.A. - 343.0 110.0 520 - 22.7 7.3 2.1 - - No P saganet.com.br 470 275.3 297.2 -7.4 1,511.7 708.1 N.A. - 18.1 8.5 10.6 22.7 - Yes P rge-rs.com.br 471 N.A. N.A. - 1,162.0 248.0 4,200 - 57.7 12.3 11.8 - - No P abril.com.br 472 298.1 349.5 -14.7 1,804.6 1,190.4 N.A. - 10.6 7.0 10.4 24.6 - No P aluar.com.ar 473 241.0 71.0 239.4 1,698.0 915.0 N.A. - 7.1 3.8 5.4 20.0 - Yes P valefertilizantes.com 474 543.5 398.7 36.3 4,496.5 2,006.4 1,231 - 13.5 6.0 22.5 45.2 - No P* ohlmexico.com.mx 475 N.A. N.A. - N.A. N.A. 15,000 - - - - - - No P* danone.com.mx 476 N.A. N.A. - N.A. N.A. N.A. 1,197.0 - - - - 100.0 No P psa.com.pe 477 N.A. N.A. - N.A. N.A. 5,476 - - - - - - No P* unilever.com.mx 478 198.4 145.8 36.1 1,412.4 708.2 11,229 430.6 14.2 7.1 8.4 16.6 36.1 Yes P metalleve.com.br 479 N.A. N.A. - N.A. N.A. 350 - - - - - - Yes P sony.com.mx 480 N.A. N.A. - 1,772.0 929.0 N.A. - -17.4 -9.1 -13.7 - - No P lbr-lacteosbrasil.com.br 481 N.A. N.A. - 2,622.1 -689.8 2,310 - - -13.5 -30.0 - - Yes S celg.com.br 482 238.0 263.3 -9.6 3,087.3 1,254.1 6,415 - 13.7 5.5 14.6 20.3 - Yes P urbi.com.mx 483 N.A. N.A. - N.A. N.A. 3,356 98.7 - - - - 8.5 No P* finning.cl 484 179.9 163.2 10.2 1,864.7 584.6 N.A. 568.1 18.5 5.8 9.3 15.4 48.8 Yes P tupy.com.br 485 214.1 179.0 19.6 N.A. N.A. 4,513 - - - 8.5 18.4 - No P* kcl.cl 486 N.A. N.A. - 449.0 85.0 250 - 38.8 7.3 2.9 - - No P cisatrading.com.br 487 N.A. N.A. - 899.4 N.A. 1,551 - - 12.7 9.9 - - No S codelco.cl 488 N.A. N.A. - N.A. N.A. 3,986 - - - - - - No P* apasco.com.mx 489 645.2 712.9 -9.5 1,170.9 886.3 848 1,131.1 55.1 41.7 42.6 56.3 98.6 No P* barrick.cl 490 N.A. N.A. - N.A. N.A. N.A. - - - - - - No P* claro.com.pe 491 N.A. N.A. - 2,981.2 1,391.6 1,005 - 6.2 2.9 7.5 - - No P gasnaturalmexico.com 492 782.1 491.0 59.3 1,427.0 966.8 N.A. 1,012.0 47.1 31.9 40.1 68.8 89.0 No P shougang.com.pe 493 158.6 137.8 15.1 1,112.5 588.0 12,500 - 13.2 7.0 6.9 14.0 - Yes P sonda.com 494 34.6 N.A. - 281.9 105.7 N.A. - 5.7 2.1 0.5 3.0 - No P biomax.co 495 N.A. N.A. - N.A. N.A. N.A. - - - 1.9 - - No P* repsol.com/pe_es 496 N.A. N.A. - N.A. N.A. 3,400 - - - - - - No P* thyssenkrupp.com 497 457.5 354.5 29.1 1,250.8 746.5 1,700 10.2 36.3 21.7 24.3 41.0 0.9 No P* backus.com.pe 498 N.A. N.A. - 652.0 247.0 1,810 - 31.6 12.0 7.0 - - No P novartis.com.br 499 -11.9 82.0 -114.5 835.9 330.1 4,049 - -11.0 -4.3 -3.3 - - Yes P positivo.com.br 500 P: Privately-owned S: State-owned P*: Foreign-owned 2012 - 2013 / AMÉRICAECONOMÍA 35 RANKING 500 GI.indd 35 17/8/12 16:45:05
  • 38.
    RÁNKING THE BEST BUSINESS SCHOOLS IN LATIN AMERICA INNOVATION IN OUR HEART – all helped INCAE to draw level with Mexico’s top-ranking business school. However, Incae will have to do even better if it wants to match Chile’s Adolfo Ibáñez University (UAI) which took first place for the second year running. This was largely thanks to more intensive research, which was reflected in the pub- lication of 114 new papers in journals in the ISI system (against just 88 in 2010), and to the hiring of nine full-time teachers with PhD in management fields. In other moves, some high-scoring business schools swapped places on the ranking. For example, Mexico’s Egade In this new edition of the ranking of the best business took fourth place, overtaking Brazil’s schools in Latin America, we have focused our Fundación Getúlio Vargas (FGV), analysis on a key quality for any ambitious company largely because the business school at Tecnológico de Monterrey eliminated which is often talked about but rarely implemented: several of the inefficiencies created when innovation. AméricaEconomía Intelligence, Daniela Arce and Tamara Muñoz it merged its campuses in Mexico City P and Monterrey. ositions on this ranking are pre- push the Central American business Egade also launched a campaign to cisely calculated year by year. school up a place, matching Mexico’s accredit itself before the three leading Each teacher and each paper ITAM on points. international accreditation agencies: counts, especially in the fight for The publication of 53 ISI papers during AACSB, Equis and AMBA. As these the top spots on the table. Latin America’s 2011, the signing of conventions with the bodies act like professional perfor- business schools fight tooth and claw to University of St Gallen and UCLA and mance boosters in the European and improve their offer and compete in the the improved standing in 2011 of San US markets, this initiative is reflected tough market to educate Latin America’s Jose and Managua in AméricaEconomía’s in its Internationalization score. leading executives. This year, the recent city ranking – which helped to boost the Another interesting scrap was fought efforts of Incae (2°) were sufficient to school’s Business Environment score between Colombia’s Uniandes and 36 AMÉRICAECONOMÍA / 2012 - 2013 MBA GI.indd 36 17/8/12 16:45:35
  • 39.
    place your bets Chile’s Catholic University. This year in which knowledge area do you want to specialize? source: 2012 mba survey, América Economía Intelligence the Bogota business school won sixth place employing a similar strategy to None the other schools: more full-time teach- Corporate Social 4% ers with PhDs, and more international Responsability 5% conventions and accreditations, which allowed it to beat its Chilean rival into General Management Operations and Strategy seventh position. 5% 23% This was a tough fight in which every point counted and where in- Human Resources novation represented a new area of 7% competition. Informacion dirty innovation Tecnology 7% “Without innovation, there is no busi- ness” is a mantra endlessly repeated in business schools. However, these good Economics Finance intentions rarely result into anything 9% 17% more than a few courses and programs so that directors and managers do not forget to include it in their power-point presentations. However, many now argue that to incorporate innovation Entrepreneurship Marketing 11% 12% into company strategy, managers have to roll up their sleeves and get down to the factory floor. gineering and the creation of a design arguments with CEOs, executives, and Manuel Suárez Barraza is a teacher school focused on creating new prod- the board, even though their area ac- at Egade, who learned his trade at ucts and services for the market,” says counts on average for half the budget” Toyota. He warns that when it comes Alfonso Gomez, dean of the business says Roy Zúñiga of Incaer. to innovation, Latin America has not school at UAI. “Today, companies’ activities tend to taken up the challenge with sufficient In Argentina, IAE is following a be dictated by what’s happening around force because the region’s business similar path, but starting from innova- them. The curious thing is that they do schools and major companies, which tion. “We dedicate 25% of our time to not realize the importance of homegrown largely work in industries created in research and every teacher has a budget innovation,” adds Jorge Pancorvo, the nineteenth century, are not focused for that,” explains Luis Dambra, direc- director of operations management at on operations. “If MBA students see tor of the program “Leading Innovation Peru’s University of Piura. this area like a poor relative, they are and Creativity.” These outlooks are finding echo in never going to achieve major innova- Or take the case of the Torcuato di companies. As leader of the industrial tions,” he says. Tella University. “What we are trying synergy community at the Colom- However, there is growing aware- to do is give our students the ability bian firm Nutresa and president of the ness among business schools about the to think independently,” says Nicolas company’s services subsidiary, Carlos importance of innovation. Following Stier, who has a doctorate in operations Gallega has been able to see close up some promising hi-tech start-ups, school research from the Massachusetts Insti- how employees work and understand heads have spotted a gap in many MBA tute of Technology (MIT). that innovation in operations is key to courses: they teach little about what is But to ensure that corporate innova- organizational success. needed to create Latin America’s answer tors are not afraid of getting their hands “Obviously there is lot to be done, to Mark Zuckerberg. dirty, many argue that the companies but we must use incentives and connect “That led to efforts to connect our must place more emphasis on operations. high incomes to innovative ideas which business school with the schools of en- “Operations managers are losing out in reduce costs.” n 2012 - 2013 / AMÉRICAECONOMÍA 37 MBA GI.indd 37 17/8/12 16:45:38
  • 40.
    RÁNKING THE BEST BUSINESS SCHOOLS IN LATIN AMERICA Ránking latinoamericano ACADEMIC STRENGTH KNOWLEDGE PRODUCTION AND DIFUSSION % OF N° OF N° OF N° OF % PART-TIME N° OF ISI N° OF TO RK RK COUN FULL-TIME 2012 PAPERS N° OF SCHOOL CITY FULL TIME PART-TIME TEACHERS PAPERS CASE INDEX 12 11 -TRY TEACHERS INDEX IN OTHER BOOKS TEACHERS TEACHERS WITH PH.D 2012 STUDIES AGRE WITH PH.D DATABASE 1 1 U. A. IBÁÑEZ CL Santiago 48 100.0 29 34.5 93.4 114 71 143 26 94.6 2 3 INCAE CR/NI Alajuela/Managua 40 95.0 0 - 93.2 53 87 176 26 94.2 2 2 ITAM MX Mexico City 54 88.9 9 77.8 96.1 52 17 10 14 90.1 4 4 EGADE BUSINESS SCHOOL MX Monterrey/Mexico 69 88.4 198 70.2 87.4 121 193 62 87 97.1 5 4 FGV - EAESP BR Sao Paulo 70 98.6 5 100.0 86.1 46 342 7 68 99.1 6 7 UNIANDES CO Bogota 39 84.6 7 71.4 100.0 33 29 26 48 76.4 7 6 PUC - CHILE CL Santiago 40 60.0 33 21.2 91.7 83 8 34 5 91.2 8 10 U. TORCUATO DI TELLA AR Buenos Aires 37 88.9 31 41.9 86.9 127 148 26 21 93.1 9 8 IAE - AUSTRAL AR Buenos Aires 48 70.8 30 13.3 88.4 13 50 108 25 65.3 10 9 U. DE CHILE (4) CL Santiago 113 85.8 50 50.0 88.2 213 98 20 20 100.0 11 11 FEA/FIA U. SÃO PAULO BR Sao Paulo 75 97.3 18 66.7 87.2 36 464 12 57 77.2 12 14 COPPEAD BR Rio de Janeiro 24 100.0 3 100.0 81.8 23 53 14 16 56.1 13 12 IESA VE Caracas 35 97.1 12 41.7 74.8 31 154 37 13 82.6 14 13 U. SAN ANDRÉS AR Buenos Aires 38 86.8 37 27.0 89.0 23 124 61 80 65.9 15 15 ESAN PE Lima 41 92.7 142 7.0 68.9 56 62 576 81 78.4 16 16 U.DEL DESARROLLO CL Santiago 36 69.4 54 31.5 77.1 40 22 19 25 51.1 17 18 U. D. PORTALES CL Santiago 39 66.7 24 33.3 68.3 62 40 29 26 77.2 18 17 UTFSM CL Santiago 26 80.8 27 51.9 74.3 24 34 9 6 36.3 19 23 FGV – EBAPE BR Rio de Janeiro 26 100.0 3 100.0 53.8 43 44 0 9 54.9 20 25 U. DEL PACÍFICO PE Lima 29 82.8 43 32.6 54.3 14 24 9 51 32.9 21 19 UDLAP MX Puebla 35 100.0 6 100.0 72.3 8 14 4 9 20.1 22 21 U. DE TALCA CL Talca 30 76.7 12 33.3 64.5 29 40 16 6 42.6 23 22 USACH CL Santiago 45 35.6 30 43.3 53.4 14 3 6 9 31.2 24 20 U. A. HURTADO CL Santiago 20 50.0 11 27.3 47.3 26 72 27 16 51.1 25 24 TEC. DE MONTERREY MX Guadalajara 47 68.1 37 56.8 53.5 14 10 5 15 30.2 26 34 ITESO MX Guadalajara 27 66.7 26 11.5 39.7 29 17 0 15 37.9 27 28 U. EXTERNADO COLOMBIA CO Bogota 30 90.0 7 100.0 44.8 13 55 45 32 31.3 28 32 U. DEL NORTE CO Barranquilla 29 58.6 17 41.2 47.0 5 22 4 34 20.5 29 26 U. DE PALERMO AR Buenos Aires 45 37.8 59 0.0 55.2 3 7 5 16 13.1 30 27 ORT UY Montevideo 26 53.8 67 20.9 36.3 10 25 28 18 19.2 31 30 IDE EC Guayaquil / Quito 15 73.3 15 6.7 33.2 1 6 116 14 15.0 32 31 ANÁHUAC - SUR MX Mexico City 13 84.6 22 100.0 40.5 3 39 0 13 19.9 33 33 U. ROSARIO CO Bogota 34 50.0 25 24.0 31.1 18 83 3 37 41.8 34 29 BSP BR Sao Paulo 25 40.0 60 50.0 46.9 6 20 1 40 24.1 35 - U. IBEROAMERICANA MX Mexico City 34 8.8 41 12.2 33.5 5 1 0 8 14.2 36 35 EAFIT CO Medellin 65 56.9 43 25.6 32.1 11 92 17 22 21.1 37 36 U. BELGRANO AR Buenos Aires 22 54.5 40 27.5 36.7 13 56 4 14 28.3 38 - U. DE GUADALAJARA MX Guadalajara 22 54.5 12 25.0 42.1 1 0 0 2 5.4 39 38 ESPAE-ESPOL EC Guayaquil 12 58.3 16 25.0 37.4 4 16 19 9 13.9 40 - UEES EC Guayaquil 16 31.3 12 33.3 33.2 2 9 23 10 16.9 41 39 IEDE CL Santiago 12 100.0 50 36.0 31.4 0 1 7 12 2.7 42 40 U. AMERICANA PY Asuncion 9 55.6 68 77.9 32.1 0 0 2 1 2.1 43 - UNA BR Belo Horizonte 29 79.3 33 3.0 28.7 5 7 1 10 14.2 44 42 U. CATÓLICA BOLIVIANA BO La Paz 7 71.4 15 26.7 28.1 0 0 4 5 1.5 45 41 U. SAN FRANCISCO EC Quito 11 63.6 13 23.1 24.3 3 1 2 5 8.7 (1) Has simultanous double degree programs (4) Faculty of Economics and Business together with Industrial Engineering (2) Shared with undergraduates (5) Only the EGADE Business School Monterrey has one. (3) Has an overseas campus IP - In Process 38 AMÉRICAECONOMÍA / 2012 - 2013 MBA GI.indd 38 17/8/12 16:47:21
  • 41.
    INTERNATIONALIZATION NETWORKING BUSINESS ENVIRONMENT ACCREDITATIONS N° OF N° OF DOUBLE TOTAL N° GRADUATE AGREEMENTS DEGREE RECRUITMENT HELP ALUMNI OF AACSB EQUIS AMBA INDEX SUCCESS INDEX INDEX TOTAL INDEX WITH TOP 15 AGREEMENTS W/ DESK ASSOCIATION AGREEMENTS INDEX SCHOOLS TOP 80 SCHOOLS 78 2 5 (1) Yes No Yes 94.1 Yes Yes (3) 74.1 98.2 92.0 94.6 75 3 4 Yes Yes No 96.8 Yes Yes (3) 100.0 100.0 77.0 94.5 72 1 3 Yes Yes Yes 95.1 Yes Yes 98.6 96.3 90.0 94.5 122 3 5 Yes (5) Yes (5) Yes 100.0 Yes (2) Yes (3) 94.2 93.6 82.5 92.2 95 4 4 Yes Yes Yes 90.0 Yes Yes 99.0 96.4 100.0 92.0 203 3 2 Yes Yes Yes 87.6 Yes Yes (3) 84.1 96.4 85.0 92.0 140 4 2 Yes Yes No 85.4 Yes Yes (3) 88.2 93.2 92.0 91.0 106 3 2 No No Yes 74.3 Yes Yes 78.9 93.2 86.0 87.5 24 3 1 (1) Yes Yes Yes 80.9 Yes Yes (3) 80.0 99.2 86.0 84.7 50 0 4 (1) IP No Yes 68.9 Yes Yes (3) 71.2 71.2 92.0 84.5 21 2 0 No No Yes 68.4 Yes Yes 72.0 94.0 100.0 84.4 46 2 0 No Yes No 78.5 Yes Yes 95.5 98.5 87.0 79.8 59 1 2 Yes Yes Yes 87.3 Yes Yes (3) 63.2 87.2 55.0 79.7 41 2 0 No No Yes 59.9 Yes Yes 70.9 86.6 86.0 79.4 123 4 2 IP IP Yes 67.9 Yes Yes (3) 58.9 88.3 83.0 75.2 50 2 2 IP No Yes 66.8 Yes Yes 72.9 88.2 92.0 73.3 122 2 0 No No IP 50.1 Yes Yes (3) 54.2 67.4 92.0 68.4 92 0 0 No No Yes 61.1 Yes (2) Yes 77.2 80.1 92.0 66.8 39 0 0 IP IP No 33.3 Yes Yes 78.9 86.9 87.0 59.2 97 2 2 Yes No Yes 86.1 Yes (2) Yes 78.9 67.9 83.0 58.9 12 0 0 IP No IP 59.3 Yes (2) No 78.4 68.0 70.0 58.9 27 1 1 No No IP 38.0 Yes (2) Yes 52.0 56.6 73.5 55.0 99 0 0 No No No 58.0 Yes (2) Yes 61.2 68.6 92.0 54.6 16 0 1 No No IP 39.1 Yes (2) Yes (3) 61.9 67.5 92.0 53.1 51 1 2 No No No 50.2 Yes (2) Yes (3) 41.2 59.9 70.0 50.5 78 0 0 No No No 49.4 Yes (2) Yes 69.4 67.1 70.0 47.8 29 1 0 No No IP 41.9 Yes (2) Yes (3) 44.4 59.7 85.0 47.5 72 0 1 No IP IP 58.9 Yes (2) Yes (3) 60.3 71.5 60.0 47.1 10 0 0 No No IP 26.0 Yes Yes (3) 50.0 61.3 86.0 45.2 75 0 1 No No IP 53.7 Yes (2) Yes 68.9 70.1 80.0 44.4 22 1 1 No No IP 45.7 Yes Yes 88.9 91.2 60.0 44.4 17 1 0 No No No 41.0 Yes Yes 56.3 65.2 90.0 43.9 35 0 1 No IP No 60.1 Yes (2) Yes 37.4 47.6 85.0 43.6 17 1 0 No No IP 27.4 Yes (2) Yes 43.3 52.3 100.0 43.2 4 0 0 IP No No 28.9 Yes Yes 87.9 88.1 90.0 42.7 84 0 1 No No IP 60.3 Yes Yes 63.0 65.2 70.0 42.6 8 0 1 No No IP 35.6 Yes (2) Yes 64.2 62.1 86.0 42.4 11 0 0 No No No 31.1 Yes (2) No 80.1 80.4 70.0 42.2 11 0 0 IP No No 35.0 Yes Yes 70.0 59.4 60.0 37.9 30 0 0 No No No 32.2 Yes Yes 65.4 66.7 60.0 37.8 5 1 0 No No IP 34.1 Yes Yes 36.3 58.3 92.0 34.5 99 0 2 IP IP No 49.6 Yes (2) Yes 58.2 52.1 60.0 34.1 1 0 0 No No No 4.1 Yes Yes 41.1 42.3 73.0 27.0 1 1 0 No No No 19.0 No No 68.3 39.9 55.0 25.1 7 0 0 No No IP 9.3 Yes (2) Yes 37.9 39.9 60.0 23.8 2012 - 2013 / AMÉRICAECONOMÍA 39 MBA GI.indd 39 17/8/12 16:47:28
  • 42.
    RÁNKING THE BEST BUSINESS SCHOOLS IN LATIN AMERICA market to provide a huge quality of data. The result is a detailed analysis of 33 schools which provided sufficient information to answer the big questions on a range of issues which are critical when taking one of the biggest deci- sions in an executive’s career. While this ranking is not complete, as a number of leading and renowned business schools did not provide data, the three which have traditionally led the ranking did: Harvard, Stanford and London Business School, which again took the top three positions in the rank- ing, together with thirty of their leading competitors. They all competed in the ranking’s different fields, which seek to calibrate each business school’s academic and economic qualities, together with its networking potential and prestige within Latin America. In the heavyweight category, Harvard is the undisputed champion, given that – among other indicators – 98% of the MISSION schools’ teachers are employed full-time, have PhDs and carry out intensive research into management fields, which results in hundreds of papers published in journals which are indexed in the ISI database. On the opposite side of the classroom, LATIN AMERICA so to speak, Harvard is also on top with the highest criteria for selecting students. During the last academic year, its new intake consisted of 905 students with an Thirty-three leading business schools from around average GMAT score of 724. The next the world opened up their books to let us assess the highest was Stanford with 803 students quality of their academic products, their costs and with an average score of 730. The world’s most famous business how attractive they are to Latin American students. school is also the most famous in Latin AméricaEconomía Intelligence, Andrés Almeida America. That can be seen in its Prestige F indicators which helped Harvard score ancy travelling outside of Latin Because this year AméricaEconomía the highest mark in this field. In a survey America to study an MBA? If Intelligence decided to strengthen the of readers of AméricaEconomía – Latin the exchange rates and your methodology for its traditional ranking American executives on high incomes sense of adventure tempt you to of the world’s best business schools – practically all of them mentioned this say yes, or if it is something you have for Latin Americans, asking business school as one of the three best-regarded always dreamt about, then this article schools from around the world, which schools in the region. is for you. are interested in the Latin American This, in addition to its strong showing 40 AMÉRICAECONOMÍA / 2012 - 2013 MBA GI.indd 40 17/8/12 16:47:35
  • 43.
    on balance price/quality ratio, based on monthly cost of mba program (in US$) and final ranking index source: AméricaEconomía Intelligence US$ Ptje. RK 2012 12,000 90 80 10,000 70 8,000 60 50 6,000 40 4,000 30 20 2,000 10 - Harvard London Haas IE HEC Paris Kellogg IMD Tuck Desaultes Mannheim HEC Montréal Bath Cranfield Kenan- Flagler Owen MacDonough MacCombs Warwick Mendoza Miami University Simon Katz Weatherhead HHL-Leipzig Boston Grenoble Chapman Gisma Cox Iese Esic Esade Stanfrod Monthly cost Position in 2012 ranking in a number of international rankings, a month, studying at a counterpart in ies one’s MBA, but also the career gave it a significant advantage over its the United States cost an average of one pursues after graduation. To put it main rival: Stanford. US$4,628 a month. another way, the incomes of business Another interesting case is that of the school graduates depend on which wall Education costs Canadian schools which achieved a better they choose to hang their academic (and pays) relationship between quality, measured certificates. And these walls are often Of course, the academic quality and good by their position on the ranking, and the in Latin America. reputation of these business schools is monthly cost of their full-time MBA nothing new. And quality costs. So the programs. For example, HEC-Montréal L.A. stands for methodology for this ranking included (14th) costs US$ 2,583 a month and Latin America a cost/benefit dimension which sought achieved a final score on the ranking According to a Financial Times study to analyze the decision to study in this of 57.11 points, while Desautels, which from 2011, the overwhelming majority or that school as if it were an investment costs a little more (US$3,250), achieved of Latin Americans who complete an (which it is). So we added variables to a slightly higher score (59.33). MBA at one of the schools on its ranking the methodology which measure the total More interesting facts? Did you know of fifty leading business schools return and monthly cost of a full-time MBA, that graduates from these 33 schools to their home countries after graduat- living costs in the campus city, average earned an average salary of US$ 97,355, ing. For most of them, the region is still monthly salary upon graduation, the in- implying an average increase in income their principal labor market. crease in income between entering and of 77% between entering and graduating? That explains why each school’s graduating from a school, and scholar- Of course, averages can be misleading. Power Network in Latin America is ships and other financial help. The average salary of graduates from so important. The UK’s University of Bath (15th) the best schools can often double those The ranking analyzes this aspect achieved the highest marks. It’s no ac- of graduates from schools lower down by examining a series of variables cident that a European school won here. the table. which measure the networks of power While studying at a European business Statistical averages aside, salary which these schools have developed school costs an average of US$4,230 depends not only on where one stud- in the region. 2012 - 2013 / AMÉRICAECONOMÍA 41 MBA GI.indd 41 17/8/12 16:47:41
  • 44.
    RÁNKING THE BEST BUSINESS SCHOOLS IN LATIN AMERICA Internacional ranking Key Indicators 2011 RK Total Cost School University Country Nº of N° of Students D 2012 % of Full- N° of GMAT of Full-Time Full- Time for every ten Time con PhD Students * Average * MBA program Teachers candidates * (US$) 1 Harvard Business School Harvard United States 194 98.0 905 8.9 724 87,200 2 Stanford Graduate School of Business Stanford United States 112 96.0 803 8.5 730 114,600 3 London Business School - UK 98 99.0 404 N.A. 701 92,856 4 IESE Business School Navarra Spain 70 100.0 270 6.3 678 85,879 5 Haas School of Business California, Berkeley United States 77 100.0 236 5.6 715 106,792 6 IE Business School IE Spain 101 95.0 400 5.1 680 79,721 7 ESADE Business School - Spain 75 88.0 180 5.7 670 76,950 8 HEC Paris - France 115 99.0 233 6.5 690 62,570 9 Kellogg School of Management Northwestern United States 182 94.0 623 5.7 712 162,458 10 IMD - Switzerland 42 100.0 90 1.1 670 92,900 11 Tuck School of Business Dartmouth United States 44 100.0 267 5.4 718 56,555 12 Desautels Faculty of Management McGill Canada 80 96.0 58 6.1 661 65,000 13 Mannheim Business School Mannheim Germany 86 100.0 53 8.0 672 43,150 14 HEC Montréal Montréal Canada 66 75.8 80 7.5 637 31,000 15 School of Management - Bath Bath UK 79 91.0 59 5.5 640 35,400 16 Cranfield School of Management Cranfield UK 92 82.0 84 4.6 680 52,000 17 Kenan-Flagler Business School North Carolina, Chapel Hill United States 111 90.0 288 4.8 689 96,829 18 Owen Graduate School of Management Vanderbilt United States 39 100.0 162 N.A. 695 89,560 19 McDonough School of Business Georgetown United States 53 87.0 253 3.9 690 99,276 20 McCombs School of Business Texas, Austin United States 73 96.0 263 4.6 692 94,972 21 Warwick Business School Warwick UK 154 92.0 55 3.6 648 47,600 22 Esic - Spain 12 100.0 40 9.3 670 34,590 23 Mendoza College of Business Notre Dame United States 65 92.3 130 4.4 692 60,620 24 School of Business Administration- UM Miami United States 135 81.0 98 5.1 636 80,120 25 Simon Graduate School of Business Rochester United States 59 85.0 318 3.2 675 92,820 26 Katz Graduate School of Business Pittsburgh United States 48 94.0 108 4.8 612 56,192 27 Weatherhead School of Management Case Western Reserve United States 69 91.0 60 3.2 633 87,740 28 HHL - Leipzig Graduate School of Management - Germany 9 100.0 65 4.6 620 38,130 29 School of Management -Boston Boston United States 63 79.4 151 3.8 684 82,732 30 Grenoble Graduate School of Business Grenoble Ecole de Management France 22 78.0 44 8.8 N,A, 36,000 31 Chapman Graduate School of Business Florida International United States 19 100.0 85 5.1 555 39,000 32 Gisma Business School Leibniz, Hannover Germany 32 100.0 42 7.0 620 39,000 33 Cox School of Business Southern Methodist United States 88 100.0 126 1.8 641 91,616 * = Last recorded year • N.A. = Not Available/Not Applicable a network of contacts that crisscross the These include the number and propor- 90% of the students are foreigners, of region and link continents. To analyze tion of Latin Americans in the student whom 13% are Latin Americans. The the strength of these networks, the mea- body as a whole and the foreign student ranking also looks at the diversity of Latin sure takes into account the institutional body. On average, more than half of the American nationalities in the classroom links between these schools and their students at the thirty-three schools included in order to measure the breadth of each counterparts in Latin America, through in the ranking are foreigners, while 18% school’s Latin network. Here the list is academic conventions and exchanges, come from Latin America. One notable headed by IE and Esic, which included as well as the relations they maintain school is IE (6th), where 89% of its stu- first-year students from sixteen and with major companies from the region. dents are foreigners and, of these, 29% twelve countries, respectively. IESE (4th) offers an interesting case of are Latin Americans. Another interesting After graduation, these small Latin a school with strong links with some of case is London Business School, where American expat communities will become Latin America’s biggest companies, 42 AMÉRICAECONOMÍA / 2012 - 2013 MBA GI.indd 42 17/8/12 16:47:47
  • 45.
    Prestige Average Latin Ameri- Latin Americans Power of 2012 Duration of Full-Time Selec- website RK 2012 graduate % increase cans as % of as % of total Academic network Cost/ Index MBA program (in tivity of Prestige m salary in salary total number of number of fo- weight in Latin benefit months) students (US$) students regn students America 9 120,000 N.A. 3.5 10.4 100.0 100.0 43.2 46.2 100.0 83.26 hbs.edu 1 18 127,189 N.A. 6.5 20.8 76.8 98.0 54.7 45.5 84.3 76.06 gsb.stanford.edu 2 21 121,206 72.5 12.1 13.5 74.9 91.8 55.1 52.7 76.8 73.33 london.edu 3 19 121,361 N.A. 16.3 20.4 64.5 89.6 75.6 61.2 54.0 70.56 iese.edu 4 21 114,232 72.2 9.3 22.2 76.4 91.9 71.3 51.7 42.2 69.95 haas.berkeley.edu 5 13 N.A. N.A. 26.0 29.2 54.8 87.8 100.0 55.8 38.0 68.84 ie.edu 6 15 105,648 115.3 18.3 22.0 71.4 85.8 86.5 60.3 29.3 68.48 esade.edu 7 16 109,000 N.A. 10.7 12.7 66.4 91.1 56.9 75.4 21.7 62.60 hec.edu 8 22 111,928 52.0 6.6 18.4 72.5 91.5 56.5 39.9 31.0 62.51 kellogg.northwestern.edu 9 11 129,600 66.2 11.1 11.2 58.5 80.4 56.3 47.0 47.1 60.12 imd.org 10 21 115,143 61.7 5.2 14.1 55.5 89.7 33.1 72.2 46.0 59.34 tuck.edu 11 20 N.A. N.A. 6.9 9.1 79.0 83.6 52.7 67.6 6.8 59.33 mcgill.cadesautelsmba 12 12 121,000 100.0 13.2 17.9 83.6 83.8 17.7 92.3 14.7 57.55 mannheim-business-school.com 13 12 75,713 34.4 10.0 21.6 73.5 83.8 37.6 90.8 5.9 57.11 hec.ca 14 12 N.A. N.A. 6.8 7.1 67.0 80.9 32.4 100.0 17.9 57.03 bathmba.com 15 12 104,000 160.0 11.9 15.2 59.4 82.9 43.2 78.2 18.8 55.79 cranfieldMBA.info 16 21 99,628 53.4 2.4 8.1 73.4 86.0 37.1 48.9 12.6 54.71 kenan-flagler.unc.edu 17 21 91,653 N.A. 7.0 35.4 63.9 93.0 31.6 60.2 13.0 54.16 owen.vanderbilt.edu 18 21 97,297 84.9 5.5 12.7 54.9 84.7 50.6 50.7 20.2 54.14 msb.georgetown.edu 19 21 101,412 55.9 4.6 19.0 62.8 84.1 45.6 51.1 14.9 53.93 mccombs.utexas.edu 20 12 86,000 71.0 3.6 4.0 89.4 74.3 15.1 69.0 13.1 53.45 wbs.ac.uk 21 11 90,000 157.1 62.5 86.2 32.1 87.6 62.0 94.5 5.2 52.85 esic.edu 22 22 93,175 74.1 1.5 7.7 66.3 79.6 30.1 72.0 11.4 51.98 business.nd.edu 23 21 73,246 50.8 5.1 16.7 55.6 81.8 53.0 53.8 7.1 51.77 bus.miami.edu 24 22 75,686 N.A. 1.9 3.5 69.7 84.2 25.4 55.4 13.1 51.73 simon.rochester.edu 25 20 71,328 73.6 3.7 9.1 58.4 79.2 33.8 68.6 5.4 49.11 business.pitt.edu 26 20 77,440 99.5 1.7 2.9 62.5 78.3 22.7 57.8 11.3 47.79 weatherhead.case.edu 27 18 94,700 41.1 13.8 21.4 31.4 79.5 40.9 97.6 7.2 47.11 hhl.de 28 21 87,066 N.A. 4.6 13.0 55.1 77.8 24.7 55.6 14.0 46.53 management.bu.edu 29 12 100,320 69.5 31.8 31.8 65.0 30.6 55.5 94.7 7.5 45.97 grenoble-em.com 30 12 48,200 60.7 16.5 35.0 39.1 70.4 44.7 77.8 7.5 45.62 business.fiu.edu 31 11 73,000 62.2 7.1 9.7 48.9 77.4 12.1 86.6 11.8 45.02 gisma.com 32 22 84,465 58.8 3.2 17.4 56.1 74.8 24.0 55.0 6.1 44.23 coxgrad,com 33 including Itau, Taca and LAN. ers of MercadoLibre, Marcos Galperin who has been director of ESADE’s The study also measured the alumni and Hernan Kaza, who graduated from CEAL Center of European and Latin networks, to which current students Stanford in 1999, as well as Alejandro American Studies (7th) or Frank Hoff- can turn to upon graduation, not only Vollbrechthausen, president of Goldman man, who works at HHL-Leipzig (28th) in terms of their size and diversity, but Sachs Brazil, who graduated from Kellogg and is director of international relations also their success. The global business (9th) in 1995, to mention just three. at the Latin American Council of Busi- schools were asked to name their five We should also mention the teachers. ness Schools (Cladea). This is a key most successful Latin American gradu- The ranking also counts the number of factor if one assumes that their presence ates: many are founders, chief executives teachers, Latin American or otherwise, ensures that the content imparted in the and directors of leading global and Latin who maintain strong professional or classroom is relevant to Latin America American companies. These notable research links with the region. and that the region is considered worthy alumni include, for example, the found- Take, for example, Agustin Ulied, of study. ■ 2012 - 2013 / AMÉRICAECONOMÍA 43 MBA GI.indd 43 17/8/12 16:47:53
  • 46.
    RANKING LATIN AMERICA´S MOST GLOBALIZED COMPANIES from US$668.974 billion. Another example of a sustained in- ternational offense was Brazil’s WEG. Last November, it acquired Austria’s Watt Drive Antriebstechnik, an energy supply company with operations across Europe and industrial plants in Germany and Singapore. That same month it signed a deal with GE Energy to buy US-based EM (Electric Machinery), which builds motors and generators for the oil and gas industry. The deal means WEG now has operations in South Africa, Argentina, Austria, China, the United States, India, Mexico and Portugal. It is also present in sixteen other countries. Like Sigdo Koppers, its executives saw the crisis in Europe and the US as an excellent AGAINST WIND strategic opportunity to buy valuable assets at knockdown prices. Stories AND TIDE like those of Sigdo Koppers and WEG sum up a key moment in the history of Latin American business. This is a new phase of globalization where trade Despite the uncertainties of 2011, the multilatinas disputes between countries coexist with continued to expand. Although prudence was the order the need to maintain investment levels and gross capital formation in order to of the day, Latin America’s most globalized companies create jobs. did not swerve from their strategies to conquer When this article went to print, these markets beyond their borders. success stories did not include the immi- Andrés Almeida, AméricaEconomía Intelligence nent merger of LAN and TAM which has G been delayed for legal reasons, meaning reece was a drama bordering on ranking for the first time, in fifteenth that there are no reliable figures to esti- tragedy. The United States is no place. Through its acquisition of Mag- mate the real level of internationalization longer a speedy Mustang con- otteaux, the company is now present in at the new Latin American air giant (see vertible, but a beat-up pick-up 25 countries and eight different regions. note on page 44). sadly trundling down the lost highway. Previously, Sigdo Koppers was focused AméricaEconomía’s Multilatinas Meanwhile, China is threatening to curb on mine engineering in Chile and main- ranking measures a number of indicators its hitherto insatiable appetite for raw tained a minor presence in some other on internationalization. For example, materials. For the major trade blocs, 2011 countries in South America. which companies made the biggest was a year of worrying signs. Clearly the muiltilatinas have not proportion of their investments abroad? But, where some see risk, others see been intimidated by the Mayan proph- That list was led by Colombia’s ISA with opportunities. That was the case of Sigdo ecies for 2012. The sixty-five compa- an astounding 92%, followed by three Koppers, a Chilean company which last nies on the 2012 Ranking maintained Argentinean companies: Laboratorios year made the audacious move of acquir- their proportion of foreign investment Bagó, Tenaris and IMPSA. ing for US$790 million the Belgian firm at around 38%, similar to the level re- Meanwhile, there are other compa- Magotteaux, which has operations on five corded in last year’s ranking. And this nies which achieve equally high levels continents. This deal put Sigdo Koppers year they did even better, racking up of sales outside their domestic market, onto AméricaEconomía’s Multilatinas sales totaling US$710.228 billion, up such as Mexico’s Telmex, Venezuelan 44 AMÉRICAECONOMÍA / 2012 - 2013 MULTILATINAS GI.indd 44 17/8/12 16:48:45
  • 47.
    RANKING LATIN AMERICA´S MOST GLOBALIZED COMPANIES oil giant PDVSA or Chilean shipping PROTEIN AND BITS NUMBER OF MULTILATINAS AND AVERAGE SALES, BY SECTOR firm CSAV. But the real global employ- SOURCE: AMÉRICAECONOMÍA INTELLIGENCE ers are Telmex, Bolivia’s Brightstar and 90.0 10 Sales in billions of US$ $2011 Chilean software and IT firm Sonda 9 Nº of companies 80.0 9 which have the largest foreign work- 70.0 79.1 forces on the list. 8 60.0 59.4 7 THE PROTEIN EMPIRE 50.0 6 WEG and Sigdo Koppers are both 5 industrial companies. Others such as 40.0 5 Argentina’s Tenaris and Grupo Mexico 33.2 4 4 4 4 achieved high positions on the ranking 30.0 3 3 23.2 3 and had a strong presence in Europe 21.3 20.0 17.4 even before the crisis. 2 But this year a food company has taken 10.0 1 first place in the ranking, Brazil’s Grupo 1.9 JBS-Fribois, which just crept past cell- 0 Foods Retail Airlines Beverages Cement Technology Telecoms 0 phone supplier Brightstar in large part due to its larger growth potential and the MAPA MUNDI fact that it has the highest proportion of COMPANIES WITH THE GREATEST GEOGRAPHICAL COVERAGE IN 2011 SOURCE: AMÉRICAECONOMÍA INTELLIGENCE foreign sales of all the multilatinas. JBS 60 105.0 is an interesting case as it demonstrates Nº of countries 100.0 99.8 98.2 Nº of regions the risks and difficulties implied by rapid 50 Coverage Index 100.0 50 49 growth. JBS’s story is an impressive one. 94.5 40 36 92.4 95.0 From a small abattoir in Anapolis in Goias 34 state it became, in just over five decades, 39 29 30 30 89.6 89.4 90.0 27 87.6 the world’s largest supplier of protein. 86.3 8.,0 27 “The company took much larger posi- 20 26 85.0 tions over a short period of time,” says 8 8 8 9 9 10 80.0 7 7 7 7 Iberville D’Athay de Neto, an analyst at 5 Brazilian consultancy Scot Consultoría. 0 75.0 Brightstar Weg Cemex Brasil Vale Const. Bematech Dhb Petrobras Viña Their foreign forays include acquisitions (BO) (BR) (MX) Foods (BR) Norberto (BR) Comp. (BR) Concha y (BR) Odebrecht Automotivos Toro (CL) of the US firms Swift Foods and Pilgrim`s (BR) (BR) Pride. Today JBS produces abroad and has diversified from beef, its traditional José Yordan and Rebecha Sánchez Ibovespa as a whole. product, into pork and poultry. Sarmiento wrote a report for Deutsche This year the company is expected But JBS has paid a high price for be- Bank where they noted that “inves- to concentrate on realizing operational coming an icon of globalization among tors have historically not liked the synergies and improving its cash-flow. Brazilian companies. It owes more company” and that it suffers from “a To help in the task it has hired a heavy- than US$6 billion and it has struggled long list of concerns.” As well as its weight executive: Henrique Meirelles, to realize synergies between its recent high level of indebtedness and the low a former chairman of Brazil’s Central acquisitions. margins at some of its foreign units, Bank. His considerable experience in For example, analysts say the acqui- they point to the lack of corporate the financial sector should help manage- sition of US poultry producer Pilgrim’s governance mechanisms to explain ment to get a handle on its swollen debts has proved to be a headache for JBS JBS’s poor performance on the stock and develop the corporate governance after profitability slumped. Last year market. Since it first listed its shares of the quality required in a company of the company posted losses totaling in 2007, the company has quintupled this size and global reach. ■ US$345 million and got poor marks in size but its share price has risen by from the market. barely 5%, compared with 50% for the With Natalia Gómez in São Paulo 2012 - 2013 / AMÉRICAECONOMÍA 45 MULTILATINAS GI.indd 45 17/8/12 16:48:49
  • 48.
    RANKING LATIN AMERICA´S MOST GLOBALIZED COMPANIES KEY FIGURES 2011 RK RK HOME COMPANY SECTOR SALES VAR. IN SALES PROFITS N° 12 11 COUNTRY WORKFORCE US$ MILLIONS 11-10 % MM US$ U 1 2 GRUPO JBS - FRIBOI BR FOODS 32,944.0 -0.3 128,036 -345.4 2 1 BRIGHTSTAR (1) BO TELECOMMUNICATIONS 4,700.0 13.8 3,750 N.A. 3 5 LAN CL AIRLINES 5,718.2 30.3 21,838 320.2 4 3 CEMEX MX CEMENT 13,546.2 -6.2 46,500 -1,371.3 5 4 TENARIS AR STEEL 9,972.5 29.3 25,422 1,331.2 6 6 TELMEX MX TELECOMMUNICATIONS 7,057.0 -13.2 19,026 1,045.5 7 7 GRUPO ALFA MX AUTOPARTS/PETROCHEMICALS 13,053.1 18.2 56,978 373.2 8 9 VALE BR MINING 55,014.1 10.1 70,785 20,158.7 9 11 GERDAU BR STEEL 18,875.6 0.2 50,000 1,069.3 10 12 AJEGROUP (1) PE BEVERAGES 1,450.0 28.7 10,000 N.A. 11 8 IMPSA AR ELECTRICITY 1,066.9 35.2 3,108 N.A. 12 10 CONST. N. ODEBRECHT BR ENGINEERING 32,325.0 38.5 89,500 N.A. 13 13 GRUPO BIMBO MX FOODS 10,462.8 10.3 126,747 382.1 14 16 LABORATORIOS BAGÓ AR PHARMACEUTICALS 1,012.0 54.6 6,500 N.A. 15 - SIGDO KOPPERS (1) CL CONSTRUCTION & ENGINEERING 2,016.9 9.9 20,334 334.8 16 17 AMÉRICA MÓVIL MX TELECOMMUNICATIONS 47,689.6 -3.1 56,500 5,923.7 17 14 PETROBRAS BR OIL 130,171.7 1.7 80,492 17,759.4 18 - ISA (INTERCONEX ELEC) CO POWER TRANSMISSION 2,240.3 27.8 3,435 168.0 19 19 GRUPO CASA SABA (FASA) MX RETAIL 4,670.0 13.9 11,758 N.A. 20 20 MARFRIG BR FOODS 11,548.8 48.3 96,000 -243.9 21 15 AVIANCA – TACA CO/SV AIRLINES 3,279.4 9.3 6,950 N.A. 22 18 GRUPO NUTRESA CO FOODS 2,736.4 23.0 29,679 186.1 23 21 CSAV CL SHIPPING 5,151.9 -5.4 9,749 -1,249.8 24 24 INTEROCEÁNICA CL SHIPPING 879.9 7.1 3,251 -39.9 25 26 MEXICHEM MX PETROCHEMICALS 3,415.8 15.6 10,000 197.5 26 24 BRASIL FOODS BR FOODS 13,485.5 5.8 127,982 1,155.2 27 32 FIBRIA BR PULP 3,121.0 -17.2 16,956 -462.2 28 23 INTERCEMENT * BR CEMENT 1,325.3 N.A. 4,700 N.A. 29 22 CENCOSUD CL RETAIL 13,971.2 18.2 126,530 744.9 30 34 WEG BR MACHINERY 2,766.5 5.2 19,406 312.9 31 28 SONDA CL TECHNOLOGY 1,136.8 19.4 10,882 77.9 32 31 ARAUCO CL FORESTRY/PULP 4,451.4 17.5 35,704 620.8 33 29 GRUMA MX FOODS 4,104.4 9.1 21,318 377.9 34 27 VIÑA CONCHA Y TORO CL BEVERAGES 770.1 -3.6 2,848 93.2 35 33 CMPC CL FORESTRY 4,613.3 20.8 15,068 492.1 36 38 TAM BR AIRLINES 6,927.4 1.7 28,193 -178.6 37 40 GRUPO ARGOS CO CEMENT 779.2 -51.1 6,263 N.A. 38 41 GRUPO MODELO MX BEVERAGES 6,539.0 -5.0 36,566 856.4 39 35 VOTORANTIM CIM. (1) BR CEMENT 5,680.0 6.9 12,000 N.A. 40 36 POLLO CAMPERO GT FOODS 400.0 N.A. 7,000 N.A. 41 37 PDVSA (1) VE OIL 102,500.0 7.3 80,000 N.A. 42 30 EMBRAER BR AEROSPACE 5,140.6 -19.5 17,149 385.2 43 42 TIGRE (1) BR CONSTRUCTION 1,460.0 14.1 5,200 N.A. 44 39 FALABELLA CL RETAIL 9,044.0 11.8 70,841 811.3 45 45 P.I. MABE (1) MX DIAPERS 320.0 14.3 20,000 N.A. 46 44 METALFRIO BR WHITE GOODS 402.6 -14.4 1,600 3.9 47 46 ARCOR (1) AR FOODS 2,540.0 6.4 20,000 N.A. 48 43 SUZANO PAPEL E C. BR PULP 2,538.3 -6.3 4,352 52.1 49 48 GRUPO TELEVISA MX MASS MEDIA 4,486.9 -4.2 24,362 494.0 50 49 GRUPO ELEKTRA MX RETAIL 3,729.6 0.1 39,429 2,144.6 (1): Ventas Estimadas • N.D.: No Disponible 51 63 TOTVS BR TECHNOLOGY 681.9 0.6 5,507 90.0 52 51 CAMARGO CORREA BR CONSTRUCTION & ENGINEERING 9,610.0 -0.9 61,700 N.A. 53 50 FEMSA MX BEVERAGES 14,501.6 5.5 177,470 761.0 54 53 ANDRADE GUTIERREZ (1) BR CONSTRUCTION & ENGINEERING 8,400.0 -22.9 175,533 N.A. 55 64 DHB COMP. AUTOMOTIVOS BR AUTOPARTS 163.1 -3.9 1,151 16.8 56 55 COPA AIRLINES (1) PA AIRLINES 1,550.0 9.8 5,000 N.A. 57 54 ARTECOLA BR CHEMICALS 238.3 -36.9 1,831 N.A. 58 59 BEMATECH BR TECHNOLOGY 158.4 -20.6 1,144 -22.6 69 52 VITRO (1) MX GLASS 2,030.0 7.7 17,628 27.6 60 60 MARCOPOLO BR AUTOPARTS 1,804.6 1.4 17,231 182.9 61 58 NATURA BR COSMETICS 2,980.8 -3.3 7,037 443.0 62 61 GRUPO GLORIA PE FOODS 954.1 16.8 13,680 84.1 63 - RIPLEY CL RETAIL 1,821.0 -14.2 20,863 154.0 64 56 MADECO CL MANUFACTURING 428.2 26.4 2,416 19.2 65 62 LUPATECH BR ENGINEERING 327.3 -6.2 3,215 -92.9 46 AMÉRICAECONOMÍA / 2012 - 2013 MULTILATINAS GI.indd 46 17/8/12 16:48:55
  • 49.
    RANKING LATIN AMERICA´S MOST GLOBALIZED COMPANIES RANKING VARIABLES GLOBALIZATION N° OF CO- GEOGRAPHICAL % FOREIGN % FOREIGN % FOREIGN INTERNATIONAL WWW. Nº OF REGIONS INDEX 2012 UNTRIES COVERAGE INDEX SALES INVESTMENT WORKFORCE GROWTH POTENTIAL 22 8 79.2 89.2 66.5 61.7 98.1 80.3 JBS.COM.BR 50 8 100.0 60.3 77.1 84.0 75.0 80.1 BRIGHSTARCORP.COM 20 7 75.3 75.1 77.6 48.2 97.0 79.8 LAN.COM 36 8 98.2 75.6 68.7 65.8 82.0 79.0 CEMEX.COM 12 5 73.3 80.4 82.3 71.5 75.0 77.0 TENARIS.COM 9 3 61.2 95.9 51.0 89.9 85.0 71.6 TELMEXINTERNACIONAL.COM 17 6 83.8 45.0 72.1 27.0 75.0 68.1 ALFA.COM.MX 39 9 92.4 18.4 50.6 27.1 95.0 66.7 VALE.COM 14 6 71.3 38.9 60.9 48.0 83.0 66.1 GERDAU.COM.BR 16 4 74.9 78.0 68.4 74.0 48.0 65.1 AJEGROUP.COM 13 4 67.5 46.3 79.2 49.8 60.0 64.9 IMPSA.COM 34 7 89.6 34.6 57.0 48.6 70.0 64.3 ODEBRECHT.COM 19 6 73.7 54.4 61.1 52.7 68.0 64.2 GRUPOBIMBO.COM 18 4 69.9 23.1 86.4 67.5 45.0 62.5 BAGO.COM 25 8 84.5 43.5 70.4 25.0 55.0 61.4 SIGDOKOPPERS.CL 18 4 69.9 36.0 33.6 70.0 88.0 61.1 AMERICAMOVIL.COM 29 9 86.3 34.5 31.5 17.5 95.0 60.4 PETROBRAS.COM.BR 7 2 48.1 70.1 92.3 65.3 30.0 59.9 ISA.COM.CO 4 2 40.3 73.0 53.9 68.4 70.0 59.4 CASASABA.COM 23 7 83.5 60.1 32.1 41.7 75.0 59.0 MARFRIG.COM.BR 25 4 76.5 82.0 22.4 77.0 70.0 58.9 TACA.COM 11 4 60.7 30.5 72.8 20.9 65.0 58.6 GRUPONUTRESA.COM 6 5 60.0 93.4 38.0 63.0 55.0 55.6 CSAV.CL 4 4 56.6 79.2 59.0 54.0 40.0 54.3 CCNI.CL 16 6 66.7 76.0 30.6 70.0 56.0 53.9 MEXICHEM.COM.MX 27 5 94.5 40.0 16.3 16.4 81.0 53.7 BRASILFOODS.COM 8 4 69.8 58.0 28.5 4.0 82.0 53.3 FIBRIA.COM.BR 4 1 39.4 39.0 67.1 57.4 52.0 53.3 INTERCEMENT.COM 5 1 44.1 46.0 49.1 57.0 64.0 53.1 CENCOSUD.CL 49 8 99.8 33.7 19.5 14.9 72.0 52.3 WEG.COM.BR 9 3 56.4 55.3 42.7 79.5 48.0 52.0 SONDA.CL 11 6 68.1 88.0 23.7 23.6 66.0 51.7 ARAUCO.CL 16 7 77.8 65.7 18.7 63.3 58.0 51.5 GRUMA.COM 30 7 86.0 77.4 19.7 13.8 64.0 51.4 CONCHAYTORO.COM 9 2 57.1 75.8 30.5 29.5 67.0 51.2 CMPC.CL 13 3 79.0 31.3 9.2 8.3 95.0 51.0 TAM.COM.BR 7 3 50.9 51.0 32.7 38.9 70.0 50.0 ARGOS.CO 22 9 81.6 51.6 15.9 2.9 77.0 49.6 GMODELO.COM.MX 4 3 49.4 35.0 49.8 36.0 55.0 48.4 VOTORANTIM-CIMENTOS.COM 13 6 72.6 72.0 10.3 76.5 53.0 48.4 GLOBAL.CAMPERO.COM 10 5 70.0 95.2 5.3 4.7 75.0 48.1 PDVSA.COM 6 4 60.0 87.0 27.0 12.3 58.0 47.4 EMBRAER.COM.BR 10 2 61.4 22.4 44.0 25.0 56.0 47.0 TIGRE.COM.BR 4 1 39.7 31.0 40.3 40.2 65.0 46.7 FALABELLA.CL 21 6 73.1 46.1 36.7 24.1 42.0 45.3 GPOMABE.COM.MX 6 4 67.0 29.8 41.7 51.0 36.0 44.8 METALFRIO.COM.BR 16 6 74.8 16.3 27.6 28.7 56.0 44.5 ARCOR.COM.AR 9 5 75.0 58.0 10.4 6.0 63.0 43.4 SUZANO.COM.BR 8 3 52.5 16.8 22.4 10.5 77.0 43.0 TELEVISA.COM.MX 8 3 49.6 15.0 28.8 16.8 70.0 42.7 ELEKTRA.COM.MX 19 5 83.6 47.0 2.8 6.7 65.0 42.4 TOTVS.COM.BR 14 5 71.5 18.4 15.2 16.9 66.0 42.2 CAMARGOCORREA.COM.BR 9 3 52.7 41.1 18.3 35.6 61.0 42.0 FEMSA.COM 38 8 70.1 25.2 7.6 9.7 73.0 41.7 ANDRADEGUTIERREZ.COM.BR 26 7 87.6 25.7 3.6 1.6 64.0 40.5 DHB.COM.BR 7 6 62.9 25.3 18.2 22.7 55.0 39.3 COPAAIR.COM 6 2 48.9 21.6 30.1 16.3 52.0 39.3 ARTECOLA.COM.BR 27 7 89.4 13.6 15.2 9.1 44.0 37.9 BEMATECH.COM 11 5 70.9 48.5 16.0 17.0 48.0 37.7 VITRO.COM.MX 12 7 59.6 27.1 11.4 26.1 56.0 37.5 MARCOPOLO.COM.BR 10 3 65.7 7.2 7.7 21.7 62.0 36.9 NATURA.COM.BR 6 2 47.2 16.3 14.4 24.0 60.0 35.8 GRUPOGLORIA.COM 2 1 25.7 29.3 28.5 30.3 51.0 35.0 RIPLEY.CL 3 1 33.9 38.2 17.2 53.2 46.0 34.9 MADECO.CL 39 6 49.7 23.6 13.9 20.8 53.0 34.4 LUPATECH.COM.BR 2012 - 2013 / AMÉRICAECONOMÍA 47 MULTILATINAS GI.indd 47 17/8/12 16:49:01
  • 50.
    BANKING SPECIAL INTRODUCTION NO CRISIS HERE…YET Latin America’s banking sector is following a different path from the rest of the world’s financial industry thanks to growth in domestic markets. While the world’s biggest banks tumble, here they are achieving record results. But global turbulence could bring trouble in the months ahead. AméricaEconomía Intelligence V isiting Bogota, it is impossible in chaos, we see a future with lots of 60-65). While the world’s biggest bank- not to notice the Colpatria Tower. growth,” says one of the Colombian ing groups are fighting to remain liquid Measuring 196 meters high, it bankers participating in the battle for and avoid seeing their net worth shrink, is the tallest building in a city Colpatria. It is a view shared by the Latin America’s banks are exploiting the which has favored horizontal spread over majority of executives who work at the huge potential for long term growth in the towering skyscrapers. Even at night, its financial institutions included in this region’s financial sector. In fact, during colored lights make it a landmark in the latest edition of our ranking of Latin the first half of 2011, Latin America’s Colombian capital. America’s 250 biggest banks (see pages 250 biggest banks proved to be com- Today the building is also in the spotlight of Latin Amer- BANKING ASSETS America´s 250 biggest banks, by coun- Growth of assets held by Latin ica’s banking industry. The try, in millions of USD shareholders of the Colpatria SOURCE: AMÉRICAECONOMÍA INTELLIGENCE conglomerate, which has its OTHERS BRAZIL MEXICO CHILE COLOMBIA ARGENTINA VENEZUELA PERU PANAMA head offices in the tower, are 4,500,000 in the final stages of choosing a strategic partner to take a 4,000,000 stake in Colpatria Multibanca, Colombia’s eighth biggest bank 3,500,000 and the eighty-third largest in Latin America. A medium- 3,000,000 sized bank with assets valued 2,500,000 at US$6.24 billion, but which, according to media reports, 2,000,000 some of the biggest global banking groups active in Latin 1,500,000 America are keen to get their 1,000,000 hands on: from Spain’s BBVA to the UK’s HSBC, as well as 500,000 Itau and Banco do Brasil, both from Brazil. “Although the world is 2000 2001 2002 2003 2004 2005 2006 2007 2008 2009 2010 2011 48 AMÉRICAECONOMÍA / 2012 - 2013 BANCOS GI.indd 48 17/8/12 16:51:37
  • 51.
    ESPECIAL INTRODUCCIÓN BANCOS pletely detached from the global banking the New York branch of Deutsche Bank continuing to see vigorous growth in industry. While banks in Europe and the Securities, citing a recent internal report consumer credit, credit cards and mort- United States suffer from illiquidity and at the German bank. Annualized ROA gages,” says Sergio Fuentes, an S&P shrinking assets, banks in this part of the (return on assets) of Latin America’s 250 analyst who follows these countries world saw their assets grow by 33% to biggest banks averaged 1.77% in the year closely. Even Mexican banks, despite almost US$4 trillion, the highest figure to June 2011, while the return on equity their proximity to the United States, have on record. Half-yearly profits rose by an reached a stunning 16.6%. Amidst the continued to grow. The world’s biggest average of 30% to US$24.206 billion, flood of bad news about banking losses financial groups are continuing to make almost matching the profits achieved in from around the world, only eighteen of profits in Latin America that they cannot 2008, which were the highest in the his- Latin America’s 250 largest banks failed find elsewhere in the world. Take the tory of banking in Latin America. “Latin to make a profit. Just one of them, the UK’s HSBC as an example. Its Latin American banks are the most profitable Brazilian subsidiary of France’s Société American subsidiaries posted profits of in the world,” says Argentinean Gabriel Générale suffered a major loss. US$1.151 billion during the first half of Roitman, director of Global Markets at “Countries like Peru and Chile are 2011, an increase of 30% from the same RANKING LATIN AMERICA´S 25 BEST BANKS 1 01 )2 1 01 -10 % -10 1 0 11 01 1-1 S( .2 11 20 11 )2 LL AN S1 CY 01 AL 00 % ITY MI LO 00 ET IEN Y( F1 ) 2 OT BIL S$ F1 SS NG UIT (% / T TO FIC 1 SU ITA LA TO MI EQ TS TY OU EF ET OF OR TA OU SE UI X ON IN CY DE SS PR TO RF AS ET EQ ITY Y IEN % IN LA RN TR PE % % UID R. AL 11 10 NK TU UN FIC TA N- N R. R. VA FIN LIQ RE NO TO RK RK BA CO VA VA EF 1 2 ITAÚ BR 480,623.0 36.2 4.2 13.6 13.2 20.0 5.8 74.3 6.8 61.0 2 1 SANTANDER SANTIAGO CL 52,546.9 39.0 2.6 27.4 -9.5 70.0 7.7 100.0 - 60.8 3 4 BRADESCO BR 432,594.5 38.1 7.1 14.9 1.3 20.0 7.8 73.1 3.4 60.7 4 6 DE CHILE CL 43,133.9 33.9 1.0 28.2 -9.4 90.0 8.1 72.8 -0.7 58.0 5 3 CONTINENTAL BBVA PE 14,440.5 30.3 0.2 34.2 4.2 100.0 7.8 67.5 1.7 57.6 6 5 SANTANDER MX 67,748.2 38.3 2.4 15.2 -6.8 100.0 10.6 80.2 -4.3 54.4 7 7 INTERBANK PE 7,026.5 15.8 1.1 31.2 -3.6 100.0 8.3 61.8 0.3 53.4 8 9 SANTANDER BR 270,588.1 30.4 7.3 2.1 -44.4 30.0 15.2 80.3 -4.2 53.1 9 - CITIBANK BR 30,589.9 18.5 4.3 48.9 482.9 60.0 8.8 52.1 -3.3 52.9 10 12 CRÉDITO PE 23,666.6 27.0 1.1 24.4 -0.2 100.0 8.6 58.7 -0.2 51.3 11 8 SANTANDER UY 4,536.2 15.0 0.1 6.0 -59.5 80.0 9.9 79.3 -5.4 51.2 12 11 BBVA BANCOMER MX 95,914.9 10.7 3.2 21.1 -9.0 100.0 9.8 52.9 -5.0 51.1 13 13 SCOTIABANK PE 10,338.0 25.7 1.2 19.8 -8.7 100.0 12.5 57.6 -0.9 50.7 14 10 INDUSTRIAL E COMERCIAL BR 10,793.3 41.8 1.9 9.6 -29.9 20.0 12.0 89.1 -0.9 50.6 15 15 CORPBANCA CL 16,899.7 31.0 1.9 23.5 5.4 40.0 6.5 82.7 2.7 50.5 16 16 DE BOGOTÁ CO 23,018.6 38.6 1.9 13.1 -23.0 100.0 18.8 64.5 -0.5 50.4 17 19 BICE CL 6,327.8 29.6 0.8 19.9 22.6 90.0 8.0 62.1 -5.9 50.0 18 20 PICHINCHA EC 6,245.5 21.7 1.7 22.8 78.9 100.0 8.8 58.2 0.3 49.9 19 18 BCI CL 31,869.2 35.2 2.1 24.2 18.0 100.0 7.6 68.9 4.4 49.7 20 22 MERCANTIL DEL NORTE MX 50,475.6 12.7 2.4 14.3 -1.7 100.0 7.8 59.1 -0.2 44.6 21 21 BBVA CL 16,063.9 18.5 2.1 16.8 -7.8 80.0 6.9 68.3 -1.2 43.8 22 25 BANCOLOMBIA CO 30,698.3 35.6 2.1 17.6 2.5 100.0 14.4 39.2 2.9 43.2 23 23 INBURSA MX 22,605.3 30.7 4.2 8.6 41.0 100.0 18.2 60.0 -0.2 42.5 24 17 ABC BRASIL BR 5,951.6 20.8 0.3 10.8 13.1 10.0 15.3 49.5 3.3 42.4 25 14 BANAMEX MX 96,962.2 14.4 15.6 8.0 -42.5 100.0 11.1 49.8 -1.6 40.6 2012 - 2013 / AMÉRICAECONOMÍA 49 BANCOS GI.indd 49 17/8/12 16:51:42
  • 52.
    BANKING SPECIAL INTRODUCTION period of 2010 and equivalent to 10% of CARRY ON LENDNG The ten banks which most enlarged their credit portfolio, annual varia- the group’s total profits (in 2010, they tion as a percentage accounted for just 8%). Only its new SOURCE: AMÉRICAECONOMÍA INTELLIGENCE operations in Africa grew faster than its 700.00 600.00 Latin American business, but starting 500.00 from a much lower base. In fact, globally 400.00 HSBC saw zero profit growth. 300.00 In the case of Citicorp, its banks in 200.00 100.00 Latin America achieved the group’s best .00 performance during the first half of 2011, X) ) ) ) ) ) ) ) ) ) (BR GT GT (GT GT BR BR GT GT (M S( L( R( ( L( N( A( TIL IAL RE CO RA TA RE O FR lifting profits by 12.7% to US$6.739 GA AD AN EE TR AN EN RU DO SA R ND RM US RC MO CIB TIN JA LLO J. IND ME FO H BA ON JP JO RO RE RO RA TC billion. Asia, on the other hand, grew AR AG ST G& ES LO LD DE DE by just 2.3%, while its global profits fell by 6.2% in the same period. TAKING ON RISK The strong presence in Latin America The ten largest increases in the credit/asset ratio, measured in percen- of some Spanish banks literally saved tage points SOURCE: AMÉRICAECONOMÍA INTELLIGENCE their skin. In the middle of a recession in 350% Spain, BBVA lifted its profits generated 300% in Latin America during the first half of 250% the year by 14% (measured in Euros). 200% Meanwhile, its profits in Spain fell by 150% 34.4%. The region now generates 47% of 100% 50% the Spanish firm’s brute margin, despite 0% representing just 22% of its assets. ) ) ) ) X) ) ) ) ) ) GT GT BR (GT (GT GT (GT (BR (BR (M L( S( L( E( OR TIL IAL AN ICO CO The story is similar for their compa- RA TA RE ER AD AN TR RG AN EN NT RU DO DE RM US RC MO CIB TIN LA JA LLO HN IND ME AT FO BA ON JP JO RO ER RE RO RA triots at Banco Santander. The region TC NT AR AG ST G& AI ES LO IST LD DE AV DE generated US$4.001 billion in profits BO during the first half of the year, 13.4% PLAYING IT SAFE The ten largest falls in the credit/asset ratio, measured in negative more than the same period of 2010. At percentage points the time, profits from its operations SOURCE: AMÉRICAECONOMÍA INTELLIGENCE in continental Europe fell by 17%. At 90% 80% the end of the first half of 2011, Latin 70% America accounted for 44% of San- 60% 50% tander’s group profits. 40% These rising profits and ballooning 30% assets were created by banking systems 20% 10% which have massively expanded their 0% coverage in recent years. In addition, ) MX ) ) ) ) ) R) ) ) BR MX BR (BR (BR BR (BR MX . (B K( A( B( O( E( K( NO LE AL N.A N FR IM SIC IRM N ST ER BA ICA BA the growing commercial and financial SA AS NK WE N AF .G. ER HE GE J. CL BA I.N AM SC TE I CIT UT N CIE PA DE importance of China helped to offset the SO restrictions spreading from the financial financial system. Their performance liquidity tests to select Latin America’s markets of the United States and Europe. depends on their capacity to success- 25 best banks. To do this, we used the However, banks cannot only be measured fully face cycles of tightening credit CAMEL methodology, an international in terms of their profits. While banking and shrinking assets, like the one the benchmark which analyses financial in- profits mean corporate strength and the world is going through today. So as stitutions based on their Capital, Assets, capacity to face external shocks, they are well as revising the balance sheets of Management, Earnings and Liquidity. not the only qualities which we should Latin America’s 250 biggest banks for In addition, in order to reflect the ask of institutions which remain the big- this special report, AméricaEconomía difficulties which financial institutions gest component of the Latin American Intelligence also carried out stress and have faced in maintaining good indicators 50 AMÉRICAECONOMÍA / 2012 - 2013 BANCOS GI.indd 50 17/8/12 16:51:45
  • 53.
    ESPECIAL INTRODUCCIÓN BANCOS while operating at scale, the methodology other financial crisis? “This new global says Torres. “We in turn were able to for selecting the best banks also awarded crisis will find Latin America not totally resolve it in just ninety days by working the volume of assets which the banks prepared,” says the Peruvian economist together and you can still see the results have to manage (in fact, Latin America’s Liliana Rojas-Suárez, who chairs the of that effort today.” fifty biggest banks have a smaller return Latin-American Shadow Financial One of the results of that deal was on assets or ROA than the fifty smallest Regulatory Committee. “Much of the a sharp increase in lending by relaxing banks on the ranking or than the average region’s fiscal health has been spent criteria. of the 250 biggest banks). countering the effects of the last crisis Today Brazil faces the opposite prob- In this 2011 version of the ranking, and that has left us with fewer tools to lem: how to prevent the economy from Brazil’s Banco Itau took first place for employ.” overheating. “Today the first time (page 53). Its capacity to According to the we are cutting our generate unprecedented growth in as- consultant Ernani Latin America funding for these loans sets, and deposits, lifted it to the top of Torres, until recently is less prepared to avoid a bubble,” the ranking, ending the six-year reign head of economic says Marcelo Nasci- of Santander Santiago, the jewel in the research at Brazilian for the next crisis mento, senior research crown of the Spanish banking group. development bank analyst at BNDES. He Despite a fall in profitability, the Chil- BNDES, it is a mis- than it was for describes as realistic ean firm remains Latin America’s most take to believe that the collapse of the S&P report which efficient bank. the crisis which be- last June explained To study banking, one must take gan with the fall of Lehman Brothers that “BNDES, which, a well-rounded approach. Especially Lehman Brothers and until 2010, was a key in today’s uncertain times when slow is continuing today in 2008. promoter of counter- global growth could at any moment did not affect Latin cyclical fiscal policies trigger the collapse of a major European America. “It affected and expanding cred- institution (bank or country) which would us and continues to it, has significantly then cause a major shock to the global affects us. Just look at the merger of Itau slowed its rate of lending during 2011.” financial system. and Unibanco. That would not have oc- In fact, according to S&P, the volume In 2008, when the fall of the invest- curred without the crisis,” he says. of lending, both direct and secondary ment bank Lehman Brothers sparked a In Brazil, a strategic agreement, not (loans from other banks, but financed generalized run on the banks which forced widely reported at the time, played a by BNDES) grew by just 0.3% in April governments to stump up cash to prevent key role. “In December 2008, the gov- and by 2.5% so far this year. further collapses, Latin America’s banks ernment, the central bank and BNDES However, for many observers, it is were also hit. In the year to June 2009, literally locked in a room all the bank- already too late. “Brazil lacks the fis- the region’s banks saw the value of their ers and business leaders whose pockets cal margin to either promote expansive assets fall by 0.65% after two years with were stuffed with derivatives and told policies or to cut interest rates,” says growth rates of around 40% a year. them: if you want to leave, leave now, Rojas-Suarez from Washington. Fortunately, Latin America’s leading those who stay, close your eyes and Colombia is in a similar situation economies were coming out of a long prepare to follow the plan we are going after a series of fiscal deficits. Mexico, period of economic expansion during to implement.” Chile, Peru and Panama, on the other which conservative fiscal policies meant According to Torres, it was this ca- hand, have room to act. that governments had sufficient resources pacity to change and adapt learnt during But if a global crisis is not on the to fund countercyclical fiscal policies, decades of economic and political insta- cards then Latin America’s banks and such as lowering interest rates, increasing bility that led the whole financial sector governments can continue to breathe spending and promoting lending through to follow the government’s recipe for easy. Will these good results be repeated state and development banks. As a result, filling the hole left by derivatives. during the next two halves? For now, the the contraction of bank assets lasted just “The United States was a slow and answer lies beyond their borders. ■ one year, compared with four years after clumsy elephant which took the crisis to the tech bubble burst in 2000. Congress, devalued its assets and turned Pablo Gonzalez collaborated What would happen if there was an- an economic crisis into a political one,” with this article from Buenos Aires. 2012 - 2013 / AMÉRICAECONOMÍA 51 BANCOS GI.indd 51 17/8/12 16:51:48
  • 54.
    BANKING SPECIAL LATIN AMERICA´S 250 BIGGEST BANKS ) FO ON S$ UNE % 1 1( 1 01 U J AS A OF U UNE 01 ) S1 11 RIA S$ 2011 S MI POS /10 EDIT % PO RIA OF IN MI OFI US$ NE 2 F IT S$ E 2 20 EDI %) L 1( AN T S N S$ CR /10 ( TOTA VA NS IN J VA ONS OLIO ) RO F U UN DE 11 CR LL IT (% Y1 PR OF JU F U NE LO ION ITY ) MI ET EQ 10 (% RE ) IN P S O IN J LL T S LL T F S O JU UIT LIO IN S IN ING 11 IN S 1 IN IP MI SSE MI OR ION IN EQ SH SIT N (% N RK FORM ION S N 1/ 11 T P SE T IO PO TIO /10 TIO IO RT TI LL T S LL U 11 A R ON Y I NE TR 20 TAL DE RIA R RI RN OW UN PE TO NK VA VA 11 10 TU N- CO BA NO RK 1 DO BRASIL BR S 492,278.5 35.8 185,260.0 33.4 232,072.3 33.4 34,983.3 3,061.4 34.6 17.5 1.0 1 2 ITAÚ UNIBANCO BR DP 480,623.0 36.2 76,439.7 44.7 234,047.1 40.9 27,900.1 1,901.1 28.8 13.6 4.2 2 3 BRADESCO BR DP 432,594.5 38.1 96,043.6 44.1 186,967.4 28.2 33,689.9 2,503.7 38.5 14.9 7.1 3 4 CAIXA ECONOMICA FEDERAL BR S 293,374.8 38.3 122,931.3 58.4 149,480.9 37.2 11,647.9 1,176.6 64.0 20.2 2.0 4 5 SANTANDER BRASIL BR FO 270,588.1 30.4 68,328.9 35.5 98,688.5 35.6 41,249.3 425.6 -36.9 2.1 7.3 5 6 BANAMEX MX FO 96,962.2 14.4 29,336.9 10.7 41,464.6 27.8 10,800.4 430.3 -44.7 8.0 15.6 7 7 BBVA BANCOMER MX FO 95,914.9 10.7 47,304.2 17.3 51,643.9 18.6 9,438.3 993.9 10.9 21.1 3.2 6 8 HSBC BANK BRASIL, BM BR FO 88,581.1 39.1 22,973.0 48.5 49,186.6 23.2 5,245.6 389.4 65.3 14.8 3.5 8 9 VOTORANTIM BR DP 81,960.6 38.1 11,663.5 38.0 14,266.6 14.9 5,632.1 344.6 29.7 12.2 1.0 9 10 SANTANDER MÉXICO MX FO 67,748.2 38.3 24,034.7 52.3 26,867.8 37.7 7,177.1 546.2 8.5 15.2 2.4 10 11 SAFRA BR DP 55,237.6 39.3 16,304.9 59.8 17,023.3 64.1 3,778.5 372.9 30.8 19.7 0.9 12 12 SANTANDER CHILE CL FO 52,546.9 39.0 37,108.9 39.8 28,342.8 37.1 4,042.0 553.9 18.7 27.4 2.6 13 13 MERCANTIL DEL NORTE MX DP 50,475.6 12.7 22,024.7 22.0 23,754.0 9.4 3,932.8 282.0 18.2 14.3 2.4 11 14 DE CHILE CL DP 43,133.9 33.9 33,815.0 37.6 28,183.7 32.9 3,482.7 491.8 29.5 28.2 1.0 15 15 ESTADO CL S 42,911.8 35.9 25,331.9 22.5 28,932.1 41.7 1,998.1 96.2 31.7 9.6 4.9 16 16 HSBC MÉXICO MX FO 42,262.2 28.0 15,106.6 31.2 23,225.9 28.7 3,120.7 43.5 145.2 2.8 2.5 14 17 NACIÓN ARGENTINA AR S 35,608.6 14.5 11,599.6 18.1 28,354.5 15.1 2,955.0 191.0 22.2 12.9 - 17 18 BCI CL DP 31,869.2 35.2 22,117.4 32.4 18,440.7 33.1 2,426.9 294.2 64.5 24.2 2.1 19 19 BTG PACTUAL BR DP 31,177.5 89.0 2,676.0 144.6 5,575.3 63.2 3,714.9 276.9 48.0 14.9 0.5 24 20 BANCOLOMBIA CO DP 30,698.3 35.6 21,370.22 37.8 18,183.34 25.6 4,425.34 390.40 25.0 17.6 2.1 20 21 CITIBANK BRASIL BR FO 30,589.9 18.5 5,707.7 45.5 11,151.0 36.9 2,695.8 659.0 787.2 48.9 4.3 18 22 CRÉDITO PERÚ PE DP 23,666.6 27.0 13,516.6 27.2 15,402.7 21.0 2,038.7 248.3 21.3 24.4 1.1 21 23 DE BOGOTÁ CO DP 23,018.6 38.6 13,846.21 35.1 14,386.96 22.6 4,319.60 283.73 40.4 13.1 1.9 23 24 INBURSA MX DP 22,605.3 30.7 12,595.4 -4.2 10,713.0 -1.1 4,121.4 176.6 68.4 8.6 4.2 22 25 BANRISUL BR S 22,363.0 28.0 10,822.6 41.1 12,759.9 32.7 2,663.5 206.7 82.2 15.5 1.7 - 26 SCOTIABANK INVERLAT MX FO 18,000.5 36.4 9,163.3 20.0 10,424.6 18.6 2,345.1 121.0 19.5 10.3 3.0 27 27 DAVIVIENDA CO DP 17,638.9 31.5 13,122.72 33.8 11,177.56 25.5 2,146.22 168.08 31.0 15.7 3.2 26 28 CORPBANCA CHILE CL DP 16,899.7 31.0 12,221.3 26.2 9,611.3 26.4 1,103.7 129.5 27.6 23.5 1.9 28 29 BBVA CHILE CL FO 16,063.9 18.5 11,635.6 27.0 9,000.7 13.1 1,104.9 93.0 12.9 16.8 2.1 25 30 DO NORDESTE BR S 15,813.3 43.1 6,298.1 26.3 5,619.6 47.0 1,528.7 150.9 421.8 19.7 2.9 30 31 BNP PARIBAS BR FO 15,517.6 50.2 214.9 -4.5 3,010.0 -1.6 685.9 41.3 -33.2 12.0 5.3 32 32 DE VENEZUELA SANTANDER VE FO 15,421.4 46.6 6,233.0 50.7 13,825.2 54.0 1,140.4 160.5 - 28.1 1.2 31 33 DEUTSCHE BANK BRASIL BR FO 14,971.5 74.7 447.2 18.5 2,043.5 111.9 642.0 10.4 -58.2 3.2 0.2 43 34 CONTINENTAL BBVA PE FO 14,440.5 30.3 9,663.6 27.2 9,678.8 26.1 1,121.0 191.6 16.9 34.2 0.2 29 35 DEUTSCHE BANK MÉXICO MX FO 14,357.4 365.8 47.8 7.0 158.0 - 206.1 3.2 -65.0 3.1 0.0 108 36 VOLKSWAGEN BR FO 13,858.2 34.9 10,923.7 44.0 3,562.4 2.2 1,280.4 83.4 27.2 13.0 0.6 33 37 BBVA COLOMBIA CO FO 13,026.3 29.5 9,320.90 37.5 9,150.04 30.2 1,282.05 128.70 6.5 20.1 2.2 34 38 BANESCO VE DP 12,939.2 30.3 7,388.8 29.2 11,197.0 29.5 1,136.0 142.1 51.4 25.0 1.4 35 39 PROVINCIAL VE FO 12,898.8 32.7 6,734.1 47.1 10,617.0 35.4 1,460.2 274.0 39.5 37.5 1.6 36 40 BICENTENARIO VE S 12,600.7 64.7 1,916.0 29.3 7,802.8 45.8 569.5 75.2 886.5 26.4 13.1 47 41 MERCANTIL VE DP 12,477.8 33.7 7,334.8 49.1 11,006.5 36.5 1,141.3 181.0 76.1 31.7 0.9 39 42 SCOTIABANK CHILE CL FO 11,666.8 21.5 8,706.2 19.3 5,141.9 18.6 1,167.2 85.5 84.3 14.7 6.1 38 43 ING BANK MX FO 11,616.9 52.9 348.4 -6.4 439.4 0.8 679.3 -3.8 -137.9 -1.1 0.0 49 44 REP. ORIENTAL DEL URUGUAY UY S 11,322.1 23.6 8,757.9 26.0 10,114.6 23.3 1,207.5 85.7 7.7 14.2 0.2 40 45 DE OCCIDENTE COLOMBIA CO DP 11,096.5 24.4 7,388.83 30.6 6,759.34 22.6 1,506.21 120.03 11.4 15.9 2.9 41 46 INDUSTRIAL E COMERCIAL BR DP 10,793.3 41.8 6,609.5 30.1 5,960.0 46.5 1,297.5 62.4 -12.5 9.6 1.9 48 47 HSBC PANAMÁ PA FO 10,755.9 11.2 7,002.0 15.7 8,476.9 9.0 1,584.2 49.3 45.2 6.2 - 37 48 JP MORGAN BR FO 10,347.9 55.3 342.5 255.7 525.9 104.9 927.5 30.4 57.6 6.6 0.0 54 49 SCOTIABANK PERÚ PE FO 10,338.0 25.7 5,922.9 24.5 6,786.6 19.7 1,290.5 127.9 8.8 19.8 1.2 45 50 PROVINCIA AR S 10,003.9 14.7 3,153.6 23.1 8,781.7 23.4 570.8 43.9 40.5 15.4 - 42 52 AMÉRICAECONOMÍA / 2012 - 2013 BANCOS GI.indd 52 17/8/12 16:51:51
  • 55.
    ESPECIAL LATIN AMERICA´S 250 BIGGEST BANKS BANCOS ) FO ON S$ UNE % 1 1( 1 01 U J AS RIA OF U UNE 01 ) S1 11 RIA S$ 011 S MI POS /10 EDIT % PO A OF IN MI OFI S$ E 2 F IT S$ E 2 ED % L 1( AN T S N S$ CR /10 ( TOTA VA NS IN J VA ONS OLIO VA F U NE 2 PR OF U JUN ) RO F U UN DE 11 CR LL IT (% Y1 LO ION ITY ) MI ET EQ 10 (% RE ) IN P S O IN J LL T S LL T F 11 IT P ) S O JU UIT LIO IN S IN ING 11 IN S 1 IN IP MI SSE MI OR ION IN EQ SH SIT N (% N RK FORM ION S N 1/ SE T IO PO TIO /10 TIO IO RT TI LL T S LL U 11 A R ON Y I NE TR 20 TAL DE RIA RI R RN OW UN PE TO NK VA 11 10 TU N- CO BA 20 NO RK 51 SANTANDER RÍO AR FO 9,986.6 30.3 5,238.9 26.7 6,832.2 31.8 836.3 90.4 -23.6 21.6 - 46 52 SICREDI BR DP 9,024.0 48.5 3,476.0 51.3 4,221.4 36.3 272.5 15.5 69.7 11.3 0.0 59 53 GENERAL PA DP 8,656.2 4.5 5,398.2 5.2 7,019.8 7.2 868.7 87.3 1.5 20.1 - 44 54 AGRARIO CO S 8,444.8 19.8 N,D, - 5,325.30 16.0 699.82 123.52 9.6 35.3 - 52 55 MACRO AR DP 8,090.3 14.1 3,843.0 29.6 5,435.3 15.9 1,074.4 62.8 -33.5 11.7 - 51 56 GALICIA AR DP 7,969.2 21.9 4,240.9 36.2 5,799.6 28.9 689.7 57.3 115.0 16.6 - 55 57 BANCOOB BR DP 7,805.1 57.2 2,432.8 50.6 5,078.7 82.6 212.0 11.5 59.3 10.9 0.0 73 58 BBVA, FRANCÉS AR FO 7,764.3 15.4 3,937.5 37.7 5,875.2 16.5 743.1 47.6 -34.6 12.8 - 53 59 BMG BR DP 7,751.2 29.3 5,502.3 39.5 4,075.3 50.7 1,363.4 13.9 -91.5 2.0 2.9 62 60 ITAÚ CHILE CL FO 7,672.8 34.5 6,273.1 42.7 4,994.2 32.1 826.1 67.2 61.6 16.3 1.1 66 61 POPULAR COLOMBIA CO DP 7,660.1 23.2 5,340.78 40.3 5,202.96 20.7 998.04 108.20 11.6 21.7 2.3 58 62 IXE MX DP 7,628.6 48.4 2,645.5 32.1 2,699.3 25.9 417.2 -0.6 -84.0 -0.3 1.0 69 63 NACIÓN PERÚ PE S 7,415.6 1.9 1,700.5 26.7 5,719.6 1.2 599.6 116.2 138.7 38.8 0.4 50 64 DEL BAJIO MX DP 7,217.8 15.6 5,236.2 9.2 4,266.6 19.2 925.5 35.9 2.2 7.8 3.2 57 65 SECURITY CL DP 7,191.4 24.1 4,633.5 31.0 4,274.9 25.3 446.4 39.9 14.9 17.9 1.4 65 66 FIBRA BR DP 7,095.8 25.6 3,150.4 29.9 3,887.5 29.6 571.1 7.7 44.6 2.7 1.2 - 67 BANK OF AMERICA MX FO 7,067.5 96.6 183.6 146.7 307.8 67.3 357.7 43.7 124.9 24.4 0.0 99 68 INTERBANK PE DP 7,026.5 15.8 4,490.2 24.9 4,610.0 6.2 580.9 90.7 13.7 31.2 1.1 60 69 DAYCOVAL BR DP 7,024.1 45.3 3,685.6 62.7 2,684.4 73.5 1,174.6 59.2 49.4 10.1 1.6 76 70 SOCIETE GENERALE BR FO 7,004.5 47.7 104.3 -61.1 803.5 -24.5 500.6 -202.4 -2,418.4 -80.9 0.0 79 71 NACIONAL C. RICA CR S 6,949.4 9.3 4,026.6 16.5 4,865.6 6.8 734.4 27.8 -2.6 7.6 3.9 56 72 INTERACCIONES MX DP 6,804.8 12.9 3,774.6 12.6 2,879.1 12.6 394.5 39.9 33.1 20.2 0.8 61 73 PANAMERICANO BR DP 6,765.5 19.0 1,888.3 -37.0 2,246.4 -29.4 959.4 24.4 154.2 5.1 21.0 67 74 NACIONAL PANAMÁ PA DP 6,739.2 13.0 2,812.6 26.1 5,830.9 14.6 553.7 48.1 -1.7 17.4 - 63 75 OCCIDENTAL DE DESCUENTO VE DP 6,688.1 13.5 3,292.9 23.9 5,210.6 25.8 587.0 74.3 34.8 25.3 4.9 64 76 MERCANTIL DO BRASIL BR DP 6,545.8 31.7 3,371.8 40.7 3,998.5 46.5 442.7 27.5 -45.0 12.4 4.7 71 77 CRUZEIRO DO SUL BR DP 6,515.2 41.3 1,081.4 46.4 2,743.3 22.8 749.2 45.0 85.3 12.0 3.3 81 78 BICE CL DP 6,327.8 29.6 4,560.2 27.4 3,795.3 23.4 505.3 50.2 59.1 19.9 0.8 75 79 AFIRME MX DP 6,293.5 97.8 810.4 14.3 1,153.5 17.2 221.0 7.8 -22.0 7.1 5.0 107 80 PICHINCHA EC DP 6,245.5 21.7 3,362.8 21.6 4,965.0 18.9 552.4 63.1 103.9 22.8 1.7 70 81 J. SAFRA BR DP 6,242.8 466.1 3,508.1 252.6 5,742.9 522.2 345.4 7.5 84.5 4.3 0.4 207 82 RABOBANK BRASIL BR FO 6,241.0 38.0 1,667.9 22.7 283.5 15.7 447.3 31.2 40.4 14.0 1.2 82 83 COLPATRIA CO DP 6,240.3 30.1 5,106.69 34.9 4,344.53 36.7 562.46 63.17 57.0 22.5 4.2 78 84 PINE BR DP 6,105.8 39.0 2,342.9 31.0 2,036.8 27.7 569.2 26.5 19.5 9.3 0.9 86 85 HELM BANK CO FO 6,091.9 69.3 4,622.79 77.2 3,907.55 57.4 634.79 34.98 8.4 11.0 2.1 98 86 DA AMAZONIA BR S 6,009.3 34.1 1,298.9 44.2 1,609.1 35.4 1,259.7 27.6 6.7 4.4 5.8 83 87 ABC BRASIL BR DP 5,951.6 20.8 3,829.2 24.1 1,731.9 3.9 908.0 48.8 44.3 10.8 0.3 74 88 AZTECA MX DP 5,951.4 13.0 2,600.3 53.4 4,467.3 10.0 446.1 29.3 21.4 13.1 3.0 68 89 HSBC ARGENTINA AR FO 5,926.4 23.5 2,887.8 29.0 4,087.5 18.6 587.0 104.8 0.3 35.7 - 77 90 BLADEX PA DP 5,870.9 32.8 4,781.8 55.2 2,123.4 38.0 701.3 42.4 91.3 12.1 - 85 91 INDUSTRIAL GUATEMALA GT DP 5,771.5 22.2 2,719.8 232.8 4,323.1 16.5 412.9 57.5 26.3 27.9 0.7 80 92 BANESTES BR S 5,618.1 8.4 895.0 - 2,294.6 - 520.6 N,D, - - 5.3 - 93 DE BRASILIA, BRB BR S 5,354.3 39.1 2,543.7 42.4 4,232.6 39.6 507.6 57.0 22.1 22.4 1.8 94 94 DEL TESORO VE S 5,060.9 48.9 1,117.4 92.4 3,316.6 67.7 307.2 78.8 483.4 51.3 8.0 104 95 FIAT BR FO 5,057.6 67.3 4,079.2 75.7 3,809.5 57.6 678.2 54.1 35.6 16.0 0.8 110 96 POPULAR DOMINICANO DO DP 5,017.5 12.2 3,123.9 15.7 3,425.8 11.7 396.2 55.6 12.3 28.1 0.7 84 97 GNB SUDAMERIS CO FO 4,981.2 19.1 2,168.97 22.8 2,964.8 16.7 325.36 31.24 -10.3 19.2 1.6 88 98 DE COSTA RICA CR S 4,949.0 15.2 2,999.1 24.5 3,618.3 18.3 576.2 23.4 -5.3 8.1 2.5 87 99 DE RESERVAS DO DP 4,902.8 -1.2 3,026.9 -12.5 2,641.2 3.2 390.2 40.5 -6.3 20.8 2.0 72 100 MERCEDES-BENZ BR FO 4,891.9 40.3 4,405.8 50.9 27.4 -45.0 685.6 38.3 98.0 11.2 0.3 100 2012 - 2013 / AMÉRICAECONOMÍA 53 BANCOS GI.indd 53 17/8/12 16:51:56
  • 56.
    Do you knowhow much will be spent daily in cloud-based services? Tech investment in cloud-based services will triple, reaching US$ 44 billion in 2013 Source: IDC INHOUSE engAETECNO 2 PAG.indd 2 17/08/2012 15:12:26
  • 57.
    Learn this andmore The first regional web portal devoted to business-oriented telecom and information technology services in Latin America. News, tutorials, events, surveys, communities, company directories and industry providers A valuable tool for CEOs, directors, managers and professionals who look for updated information on innovation and IT trends www.aetecno.com A product of INHOUSE engAETECNO 2 PAG.indd 3 17/08/2012 15:14:23
  • 58.
    BANKING SPECIAL LATIN AMERICA´S 250 BIGGEST BANKS ) FO ON S$ UNE % 1 1( 1 01 U J AS A OF U UNE 01 ) S1 11 RIA S$ 2011 S MI POS /10 EDIT % PO RIA OF IN MI OFI US$ NE 2 F IT S$ E 2 20 EDI %) L 1( AN T S N S$ CR /10 ( TOTA VA NS IN J VA ONS OLIO ) RO F U UN DE 11 CR LL IT (% Y1 PR OF JU F U NE LO ION ITY ) MI ET EQ 10 (% RE ) IN P S O IN J LL T S LL T F S O JU UIT LIO IN S IN ING 11 IN S 1 IN IP MI SSE MI OR ION IN EQ SH SIT N (% N RK FORM ION S N 1/ 11 T P SE T IO PO TIO /10 TIO IO RT TI LL T S LL U 11 A R ON Y I NE TR 20 TAL DE RIA R RI RN OW UN PE TO NK VA VA 11 10 TU N- CO BA NO RK 101 BCSC CO DP 4,823.2 20.1 2,827.88 9.5 3,923.8 16.5 536.05 56.72 32.6 21.2 4.9 91 102 CIUDAD AR DP 4,557.2 9.0 2,698.2 26.7 3,681.6 10.1 598.3 56.6 2.7 18.9 - 89 103 SANTANDER URUGUAY UY FO 4,536.2 15.0 3,490.1 13.0 4,089.0 16.4 447.3 13.5 -57.9 6.0 0.1 92 104 GMAC BR FO 4,506.0 11.3 1,498.8 28.9 1,375.8 43.2 796.2 52.1 71.3 13.1 2.0 90 105 BANREGIO MX DP 4,487.2 47.1 1,776.9 31.7 1,592.6 27.2 276.3 25.9 140.5 18.8 1.8 109 106 CITIBANK N.A ARGENTINA AR FO 4,351.7 12.5 2,044.5 23.0 2,559.5 16.0 604.5 29.5 -51.7 9.8 - 93 107 EXTERIOR VE DP 4,341.9 49.9 2,767.2 58.0 3,893.2 54.1 354.7 81.9 42.1 46.2 0.5 111 108 CREDICOOP AR DP 4,276.2 23.2 1,939.4 30.1 3,719.8 25.7 315.0 41.6 36.3 26.4 - 101 109 G & T CONTINENTAL GT DP 4,183.8 12.7 1,938.1 220.5 3,157.4 14.4 333.9 43.8 64.3 26.3 1.6 97 110 INDUSTRIAL DE VENEZUELA VE S 4,175.0 65.6 224.7 26.0 2,560.7 43.7 172.1 3.6 -74.0 4.1 43.4 123 111 CRÉDITO DEL PERÚ PANAMÁ PA FO 4,076.1 52.2 3,823.7 48.1 169.1 87.3 73.1 16.6 385.2 45.4 - 118 112 CITIBANK COLOMBIA CO FO 4,069.8 7.2 2,580.04 19.3 2,626.71 12.9 746.52 37.21 -2.1 10.0 3.4 95 113 AV VILLAS CO DP 3,975.6 16.5 2,605.63 14.0 3,168.69 24.3 486.37 42.03 23.2 17.3 3.2 103 114 BARCLAYS BRASIL BR FO 3,923.5 93.2 N,D, - 472.1 118.1 467.8 24.6 -32.8 10.5 - 139 115 DEL DESARROLLO RURAL GT DP 3,906.7 21.6 2,383.6 419.9 3,263.9 26.2 460.1 55.3 32.7 24.0 0.9 106 116 SANTANDER COLOMBIA CO FO 3,882.7 12.8 2,687.84 26.7 2,498.67 13.1 409.14 34.30 24.5 16.8 1.8 102 117 BANCARIBE VE DP 3,829.6 38.0 2,573.7 55.7 3,358.7 43.4 336.9 66.9 71.2 39.7 0.5 115 118 BVA BR DP 3,715.3 69.5 2,492.9 111.4 2,502.1 53.1 355.0 24.2 -13.3 13.6 0.4 133 119 BANCOLOMBIA PANAMÁ PA FO 3,639.2 26.5 1,861.1 30.5 2,106.4 19.5 514.5 105.0 42.4 40.8 - 112 120 PATAGONIA AR DP 3,627.2 45.5 1,826.9 44.2 2,627.4 51.1 543.8 29.6 -17.5 10.9 - 125 121 AGRICOLA SV DP 3,583.5 -3.5 2,390.8 0.5 2,531.17 -4.1 560.34 61.20 61.7 21.8 3.2 96 122 STANDAR BANK AR FO 3,555.9 28.3 1,746.2 23.5 2,606.4 32.3 269.9 6.4 2.6 4.8 - 116 123 MIFEL MX DP 3,519.7 34.4 1,137.2 -2.0 1,908.1 48.6 114.4 4.2 -13.6 7.3 4.2 120 124 IBI BM BR DP 3,519.4 28.4 1,308.1 23.2 52.6 -66.8 1,668.0 96.1 -38.0 11.5 39.3 117 125 SOFISA BR DP 3,471.4 6.4 1,045.3 -15.4 1,500.3 10.8 497.4 5.3 286.6 2.1 4.0 105 126 BBM BR DP 3,320.4 16.0 266.5 33.4 421.7 35.2 336.1 17.2 605.6 10.2 9.3 113 127 POPULAR C. RICA CR DP 3,195.1 21.6 2,075.1 17.8 2,265.2 21.6 627.9 39.4 147.0 12.5 2.8 119 128 CLASSICO BR DP 3,190.6 23.3 0.4 -40.0 0.1 -82.0 2,524.6 -40.8 -553.4 -3.2 0.0 121 129 FIDIS BR DP 3,095.8 38.9 2,713.8 41.6 2,105.4 29.7 261.0 20.0 107.0 15.3 0.4 131 130 CORP BANCA VENEZUELA VE FO 3,065.4 21.0 1,926.8 23.2 2,416.4 34.9 236.6 36.7 137.8 31.0 3.6 122 131 GLOBAL BANK PA DP 3,045.5 21.1 2,419.7 42.6 2,247.4 22.6 237.5 3.8 -61.6 3.2 - 124 132 DEUTSCHE BANK CHILE CL FO 2,979.1 27.5 - - 685.9 0.1 201.2 20.2 -7.3 20.1 - 128 133 JP MORGAN MX FO 2,954.8 67.8 10.7 27.9 38.9 -34.1 363.7 -5.9 -183.1 -3.3 0.0 150 134 LAGE DE LANDEN BR FO 2,889.4 36.9 2,442.7 31.9 32.9 - 306.4 -10.7 -289.1 -7.0 2.0 137 135 GUAYAQUIL EC DP 2,856.2 18.0 1,478.2 25.1 2,177.4 20.9 218.3 25.5 55.7 23.4 1.1 126 136 INDUSVAL BR DP 2,828.5 65.7 904.3 31.1 956.0 26.8 361.2 -37.6 -2,306.8 -20.8 5.3 153 137 HIPOTECARIO AR DP 2,800.6 0.9 1,252.5 13.2 1,286.7 22.7 736.1 11.5 9.8 3.1 - 114 138 PACÍFICO EC DP 2,687.9 22.6 1,234.9 36.6 2,207.2 23.1 333.7 25.0 - 15.0 0.6 132 139 COMERCIAL BHD DO DP 2,671.8 10.5 1,304.5 9.1 1,151.0 6.2 255.4 41.0 -1.3 32.1 2.0 127 140 RURAL BR DP 2,671.6 22.9 1,589.1 51.0 1,862.6 24.9 256.6 -7.1 -158.1 -5.6 0.0 134 141 HSBC CHILE CL FO 2,569.3 24.1 504.2 7.8 1,248.8 15.1 192.2 -8.0 -589.6 -8.3 - 138 142 INVEX MX DP 2,546.7 39.5 643.0 19.0 753.3 38.3 206.9 7.2 9.2 7.0 2.0 146 143 BBVA URUGUAY UY FO 2,542.1 167.9 2,078.9 152.8 2,353.1 167.8 189.0 -14.6 -2,401.7 -15.5 0.2 228 144 BAC INTERNACIONAL PA FO 2,524.0 10.9 1,012.4 3.5 1,482.1 19.7 973.5 101.3 17.8 20.8 - 130 145 NACIONAL DE CRÉDITO VE DP 2,478.2 38.1 1,260.5 45.7 2,198.9 46.4 233.0 19.7 301.4 16.9 3.2 148 146 MORGAN ST. DEAN BR FO 2,420.1 39.8 N,D, - 705.4 0.4 582.2 29.2 -18.1 10.0 - 151 147 FALABELLA CL DP 2,419.9 43.8 1,755.2 45.2 1,271.8 67.5 238.6 24.9 49.9 20.9 3.6 156 148 ATLÁNTIDA HN DP 2,402.0 23.9 1,255.6 10.7 1,562.8 21.2 218.8 13.7 -9.8 12.5 1.7 141 149 MONEX MX DP 2,394.8 45.7 261.4 65.6 268.9 54.9 196.4 28.4 28.1 28.9 1.5 157 150 CNH CAPITAL BR FO 2,360.5 11.0 1,445.9 22.6 339.9 -38.4 626.2 47.5 277.3 15.2 14.6 136 56 AMÉRICAECONOMÍA / 2012 - 2013 BANCOS GI.indd 56 17/8/12 16:52:00
  • 59.
    ESPECIAL LATIN AMERICA´S 250 BIGGEST BANKS BANCOS ) E % FO ON S$ UN 1 1( 1 01 RT TI F U N J SE T IO U E 01 ) S1 11 RIA S$ 011 S AS RIA S OF JUN MI POS 0 (% IT % MI OFI S$ E 2 F IT S$ E 2 CR 0 (% TAL PO ARIA NS O IO I DE 11/1 RED 1( AN T S N S$ VA F U NE 2 PR OF U JUN ) RO UN VA ION S IN Y1 V IO FOL LO /1 TO ION ITY ) C MI ET EQ 10 (% RE ) IN P S O IN J ) S O JU UIT LIO IN S IN ING 11 IN LL T LL T S 1 IN IP MI SSE MI OR ION IN FU EQ SH SIT N (% N RK FORM ION S N 1/ 11 IT P PO TIO /10 TIO LL IT LL T S LL U 11 A R ON Y NE TR 20 TAL DE RIA ED R RN OW UN PE TO NK VA 11 10 TU N- CO BA 20 NO RK 151 BAC SAN JOSÉ CR FO 2,312.2 13.9 1,693.9 17.1 1,600.2 3.3 256.3 22.9 158.0 17.9 0.6 140 152 DE CÓRDOBA AR FO 2,210.1 34.4 943.8 28.8 1,863.1 35.1 101.7 6.1 154.3 11.9 - 158 153 ITAÚ URUGUAY UY FO 2,204.8 27.5 1,587.1 40.9 2,081.1 28.7 123.8 -5.9 -156.8 -9.6 0.1 152 154 HSBC FINANCE BM BR FO 2,155.4 40.6 1,028.7 54.2 987.4 52.1 1,055.9 131.3 145.6 24.9 0.5 167 155 BBVA PANAMÁ PA FO 2,149.3 6,198.6 1,638.4 7,847.7 1,672.1 7,188.9 295.0 20.1 -3.5 13.6 - - 156 NVO. DE SANTA FE AR DP 2,091.4 8.3 1,107.4 31.9 1,484.5 3.0 235.1 24.5 -28.9 20.8 - 142 157 AGRÍCOLA DE VENEZUELA VE DP 2,075.0 86.3 930.9 29.5 393.8 30.7 169.9 0.9 43.4 1.0 32.0 204 158 CITIBANK EL SALVADOR SV FO 2,074.3 -10.8 1,114.1 -14.4 1,589.2 -1.6 331.65 10.52 500.2 6.3 6.1 129 159 BANKPAR BR DP 2,068.8 34.2 198.1 13.4 545.8 26.8 104.7 13.1 60.3 25.0 57.3 166 160 BGN BR DP 2,058.8 28.7 1,345.8 30.3 1,439.6 34.3 532.7 2.9 -87.5 1.1 1.3 161 161 BARCLAYS MÉXICO MX FO 2,056.9 64.7 0.0 - 0.0 - 225.3 49.1 - 43.6 - 193 162 PRODUBANCO EC DP 2,046.5 12.2 927.2 11.2 1,650.2 8.6 176.5 15.0 - 17.0 0.5 147 163 INTERNACIONAL CHILE CL DP 2,039.9 57.1 1,419.7 63.8 1,539.2 62.8 113.2 10.0 63.7 17.7 1.1 188 164 SCOTIABANK C. RICA CR FO 2,017.4 10.4 1,452.0 8.7 1,596.3 4.7 237.3 1.8 447.4 1.5 2.0 145 165 DE OCCIDENTE HONDURAS HN DP 1,996.5 23.0 883.4 6.6 1,519.5 24.6 148.8 12.2 6.4 16.3 2.3 160 166 FICOHSA HN DP 1,993.7 18.3 1,113.5 14.8 1,120.3 25.8 173.6 13.2 22.8 15.2 0.3 155 167 TOKYO-MITSUBISHI UFJ BR FO 1,971.7 91.1 97.9 91.2 287.5 26.0 664.6 0.7 -56.5 0.2 0.0 214 168 BANESCO PA FO 1,958.3 56.7 766.1 56.4 1,731.2 60.3 180.5 21.7 60.8 24.0 - 192 169 MULTIBANK PA DP 1,931.2 21.1 1,137.5 21.0 1,446.6 15.6 195.2 9.3 -14.1 9.5 - 163 170 GOLDMANSACHSDOBRASILBM BR FO 1,889.2 91.3 N,D, - 160.5 117.6 291.7 291.7 808.1 200.0 - 225 171 HSBC EL SALVADOR SV FO 1,883.5 2.2 1,194.7 4.5 1,370.7 6.0 258.67 6.88 5.9 5.3 5.3 144 172 SUPERVIELLE AR DP 1,881.7 43.7 1,130.6 60.3 1,459.3 50.0 164.2 11.5 23.0 14.0 - 185 173 PARANA BR DP 1,860.9 44.4 1,094.4 40.5 941.6 44.0 695.9 181.7 817.2 52.2 6.9 189 174 VENEZOLANO DE CRÉDITO VE DP 1,847.9 36.4 721.0 50.6 1,591.2 40.1 210.3 33.4 84.0 31.8 0.3 180 175 SCOTIABANK EL SALVADOR SV FO 1,813.9 -6.0 1,337.4 -5.4 1,250.9 -10.2 216.17 7.42 109.4 6.9 5.4 143 176 BAC HONDURAS HN DP 1,800.3 1.3 905.6 2.9 938.1 3.6 163.6 11.7 23.2 14.3 0.7 149 177 INTER. DE FINANZAS PE DP 1,798.9 17.7 1,157.1 19.5 1,224.5 9.3 126.3 10.7 13.1 16.9 0.6 168 178 WESTLB BR FO 1,789.4 9.0 212.7 -43.6 167.4 -28.7 322.7 6.7 207.2 4.1 2.0 159 179 BANESE BR S 1,749.9 29.4 818.3 69.0 1,322.9 16.2 127.6 24.5 143.9 38.4 1.1 - 180 CSF BR DP 1,746.1 24.4 313.1 15.9 150.8 -27.2 378.1 21.7 -37.5 11.5 74.0 175 181 CACIQUE BR DP 1,742.5 9.1 1,247.3 32.9 1,234.3 26.2 70.8 70.8 14,772.1 200.0 2.1 162 182 MI BANCO PE DP 1,741.5 23.1 1,311.2 18.2 1,190.4 34.5 147.0 17.9 -8.6 24.4 2.4 174 183 DE LA PRODUCCIÓN NI DP 1,728.9 45.0 501.0 6.2 1,437.1 55.6 110.8 9.1 62.3 16.3 2.9 197 184 MERCANTIL STA. CRUZ BO DP 1,714.1 1.3 999.8 28.1 1,519.6 1.6 128.1 10.8 20.0 16.9 0.2 154 185 CAJA DE AHORROS PA S 1,713.4 7.6 1,209.6 10.9 1,390.0 8.0 205.9 2.9 -75.3 2.8 - 164 186 TOYOTA BR FO 1,710.6 22.7 1,133.0 40.1 615.7 -33.6 184.2 13.8 -20.4 15.0 0.4 177 187 FONDO COMÚN VE DP 1,706.9 21.7 721.3 8.4 1,508.8 22.4 180.0 5.1 125.6 5.6 1.5 176 188 BOLIVARIANO EC DP 1,692.2 16.1 835.8 22.8 1,410.5 14.4 135.6 11.9 - 17.6 0.4 170 189 AGROMERCANTIL GT DP 1,658.7 22.7 943.8 303.6 1,371.2 25.2 133.9 11.3 10.3 16.8 2.9 181 190 INTERNACIONAL ECUADOR EC DP 1,655.8 13.0 883.2 16.7 1,437.2 13.3 136.4 12.8 - 18.8 0.6 169 191 THE BANK OF NOVA SCOTIA PA FO 1,625.0 2.9 1,365.6 11.8 1,565.8 3.9 17.6 19.1 7.4 217.1 - 165 192 CITIBANK N.A. BRASIL BR FO 1,618.9 36.2 42.8 -47.0 N,D, - 732.2 72.7 435.3 19.9 0.0 198 193 NVO. COMERCIAL UY FO 1,614.9 18.2 1,230.9 29.8 1,415.0 18.2 199.8 -2.0 -225.3 -2.0 0.3 179 194 BONSUCESSO BR DP 1,608.5 42.3 970.7 49.3 1,009.0 46.7 259.8 18.8 -43.8 14.5 2.2 203 195 BANPARA BR S 1,579.8 48.2 605.4 41.5 1,296.0 50.7 194.4 26.0 50.7 26.7 1.0 - 196 IBM BR FO 1,537.2 40.9 100.8 -19.1 827.6 121.2 163.0 6.1 8.3 7.5 3.1 208 197 CITIBANK PERÚ PE FO 1,519.9 22.6 650.6 2.4 1,067.0 30.0 206.6 13.2 78.3 12.8 1.8 194 198 INDUSTRIAL BRASIL BR DP 1,508.4 30.8 786.9 45.9 722.1 37.3 264.3 4.5 -3.9 3.4 2.1 202 199 BOAVISTA INTERATLANTICO BR DP 1,505.5 28.5 2.3 173.7 N,D, - 1,306.4 36.2 48.6 5.5 35.5 201 200 ITAÚ ARGENTINA AR FO 1,504.0 5.3 918.7 19.3 1,068.2 10.4 141.2 -5.7 -62.9 -8.1 - 172 2012 - 2013 / AMÉRICAECONOMÍA 57 BANCOS GI.indd 57 17/8/12 16:52:05
  • 60.
    BANKING SPECIAL LATIN AMERICA´S 250 BIGGEST BANKS ) FO ON S$ UNE % 1 1( 1 01 U J AS A OF U UNE 01 ) S1 11 RIA S$ 2011 S MI POS /10 EDIT % PO RIA OF IN MI OFI US$ NE 2 F IT S$ E 2 20 EDI %) L 1( AN T S N S$ CR /10 ( TOTA VA NS IN J VA ONS OLIO ) RO F U UN DE 11 CR LL IT (% Y1 PR OF JU F U NE LO ION ITY ) MI ET EQ 10 (% RE ) IN P S O IN J LL T S LL T F S O JU UIT LIO IN S IN ING 11 IN S 1 IN IP MI SSE MI OR ION IN EQ SH SIT N (% N RK FORM ION S N 1/ 11 T P SE T IO PO TIO /10 TIO IO RT TI LL T S LL U 11 A R ON Y I NE TR 20 TAL DE RIA R RI RN OW UN PE TO NK VA VA 11 10 TU N- CO BA NO RK 201 ALIADO PA DP 1,501.8 15.4 935.4 24.3 1,217.2 13.9 144.3 6.7 15.4 9.2 - 187 202 NACIONAL DE BOLIVIA BO DP 1,471.0 3.1 863.1 28.0 1,207.7 -2.0 116.9 12.2 13.6 21.0 0.7 173 203 BANIF BR FO 1,458.9 36.7 679.8 30.1 754.1 45.5 114.6 1.3 -30.4 2.3 9.9 210 204 CARONÍ VE DP 1,455.8 9.5 403.4 -6.1 1,265.6 6.9 167.2 3.7 -65.3 4.5 3.7 184 205 HSBC C. RICA CR FO 1,428.1 6.2 862.2 -3.1 1,088.4 2.7 153.7 2.6 -63.2 3.4 1.9 182 206 FINANCIERO PE DP 1,423.4 28.3 937.9 21.8 947.1 30.6 126.4 5.5 -4.7 8.7 1.4 205 207 AMERICAN EXPRESS MX FO 1,416.5 16.9 597.5 -2.0 578.4 7.1 301.9 34.3 73.2 22.7 4.9 195 208 JOHN DEERE BR FO 1,401.7 41.8 1,317.6 430.0 27.1 -96.4 197.0 13.2 -16.7 13.4 0.7 223 209 BISA BO DP 1,390.1 4.3 618.7 24.0 1,145.9 6.0 140.7 7.3 -43.6 10.4 0.2 183 210 RABOBANK CHILE CL FO 1,389.8 28.5 897.4 54.7 322.0 -25.6 123.6 0.3 106.3 0.5 1.3 209 211 CITIBANK N.A. URUGUAY UY FO 1,322.4 83.7 1,074.5 65.6 1,248.0 90.1 74.4 5.3 -13.8 14.3 0.0 - 212 BICSA PA FO 1,313.9 39.2 880.9 31.6 724.6 26.9 134.5 7.5 11.8 11.2 - 229 213 HSBC COLOMBIA CO FO 1,296.4 46.6 847.2 50.7 638.4 18.0 122.9 -17.9 -71.2 -29.2 4.0 - 214 VOLVO BR FO 1,288.4 6.3 984.0 11.9 122.3 -40.9 276.8 19.3 -29.8 14.0 1.3 196 215 BANSI MX DP 1,262.3 -1.3 518.2 17.3 406.9 10.3 95.8 4.1 -11.6 8.6 3.2 190 216 MULTIVA MX DP 1,260.2 -12.9 691.6 45.7 792.1 56.5 157.2 1.3 -57.3 1.7 3.3 171 217 DEL PAÍS HN DP 1,257.1 23.6 836.9 20.7 850.2 29.2 115.0 12.0 17.2 20.9 0.3 217 218 CIBANCO MX DP 1,231.7 105.2 191.7 581.9 675.3 211.6 65.8 2.9 -30.2 8.8 0.1 - 219 HSBC BANK PERÚ PE FO 1,213.8 20.2 654.1 5.1 904.2 95.6 111.4 -9.3 -2.5 -16.7 2.8 218 220 HONDA BR FO 1,204.9 26.1 1,110.9 27.0 988.0 22.4 143.7 15.9 40.0 22.2 1.1 227 221 HSBC HONDURAS HN FO 1,204.6 15.5 527.6 -1.8 715.6 12.4 95.6 0.6 -56.5 1.3 1.8 212 222 TRIANGULO BR DP 1,199.0 19.3 708.4 25.5 744.3 19.4 236.3 12.6 -1.5 10.7 7.0 219 223 AGRÍCOLA DE CARTAGO CR DP 1,196.5 16.5 462.0 21.8 1,018.0 15.9 92.8 7.3 51.9 15.7 2.0 - 224 FATOR BR DP 1,184.0 70.9 75.4 50.7 303.8 62.8 269.8 -3.3 -129.4 -2.4 1.3 - 225 BAC EL SALVADOR SV DP 1,183.7 0.5 782.67 1.3 936.32 6.9 130.13 10.03 41.4 15.4 2.7 200 226 VE POR MÁS MX DP 1,169.0 17.1 736.9 11.6 642.8 15.1 98.1 4.2 80.8 8.5 1.6 220 227 SCOTIABANK REP. DOM. DO FO 1,158.4 8.7 771.5 11.5 930.1 6.0 197.0 16.4 8.1 16.6 2.4 211 228 REFORMADOR GT DP 1,151.3 19.0 650.6 300.0 912.6 14.4 105.6 7.5 10.8 14.3 3.2 226 229 COMAFI AR DP 1,147.0 12.8 589.7 23.0 868.6 22.3 93.9 16.7 -5.4 35.5 - 216 230 SAN JUAN AR DP 1,141.5 36.6 144.3 33.1 714.3 48.0 268.6 29.0 -26.0 21.6 - 237 231 ES BANK PA DP 1,125.3 9.8 1,109.0 10.7 1,056.9 9.2 65.0 7.6 150.2 23.4 - 215 232 BANCENTRO NI DP 1,121.5 -12.2 448.5 14.2 848.2 -16.8 98.7 7.4 32.3 14.9 1.7 191 233 COMPARTAMOS MX DP 1,099.8 41.6 966.1 48.6 241.8 69.2 515.4 86.1 26.0 33.4 1.9 247 234 CRÉDITO BOLIVIA BO FO 1,089.7 16.1 638.2 29.4 942.6 18.5 92.2 6.4 -19.3 13.8 0.4 230 235 LEON DO DP 1,077.8 3.4 610.6 -6.7 877.4 8.0 97.6 6.8 -24.3 13.8 1.8 213 236 CREDIT SUISSE MX FO 1,077.3 21.6 0.0 - 66.1 -9.9 166.1 5.8 217.9 6.9 - 233 237 BANCOOMEVA CO DP 1,074.3 - 999.6 - 482.3 - 82.5 3.4 - 8.3 4.8 - 238 AHORRO FAMSA MX DP 1,051.7 25.7 824.2 27.0 817.1 30.8 162.7 22.0 22.2 27.1 14.3 236 239 PSA FINANCE BR FO 1,035.0 10.6 906.5 28.6 613.8 -9.2 182.0 4.8 -0.8 5.3 4.4 231 240 CREDICORP PA FO 1,033.6 3.6 574.8 7.1 858.2 2.4 119.5 8.1 39.4 13.6 - 221 241 CITIBANK N.A. GUATEMALA GT FO 1,023.9 15.9 455.6 -5.3 633.2 -4.9 129.2 14.9 54.7 23.1 7.8 234 242 CITIBANK PANAMÁ PA FO 1,015.7 -26.2 676.0 -10.7 823.0 -28.3 136.8 2.8 -23.5 4.0 - 178 243 CITIBANK VENEZUELA VE FO 1,015.5 -8.4 415.9 30.7 765.6 -1.0 171.1 18.8 1,240.3 22.0 2.4 206 244 PAULISTA BR DP 1,001.4 14.3 217.3 20.2 474.1 44.1 74.7 4.0 183.4 10.6 3.1 235 245 BANCOPPEL MX DP 992.6 63.3 311.4 98.9 854.1 63.6 115.6 0.3 103.1 0.5 20.8 - 246 ING BANK BR FO 984.8 -16.7 136.4 17.6 260.3 -9.0 340.5 17.8 112.2 10.5 3.1 199 247 DE LOS TRABAJADORES GT DP 957.7 28.1 521.0 424.5 803.9 30.2 79.8 6.7 11.1 16.7 3.4 248 248 AUSTRO EC DP 951.4 19.8 559.7 23.2 812.1 18.8 76.5 8.2 - 21.4 2.8 244 249 DISCOUNT UY FO 947.5 19.3 315.9 27.3 868.6 19.4 78.9 -1.1 -117.4 -2.9 0.1 243 250 HSBC BANK URUGUAY UY FO 925.4 34.8 705.6 32.8 875.0 35.2 50.4 -9.4 -323.5 -37.3 0.0 - 58 AMÉRICAECONOMÍA / 2012 - 2013 BANCOS GI.indd 58 17/8/12 16:52:10
  • 61.
    BASE PAGINA COMPLETA.indd1 16/08/2012 12:18:51
  • 62.
    AméricaEconomía THE GLOBAL ISSUE 2012 - 2013 LOMO_GLOBAL.pdf