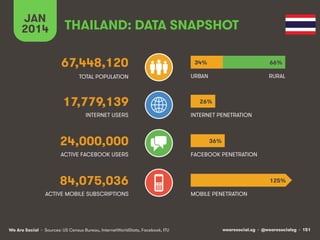
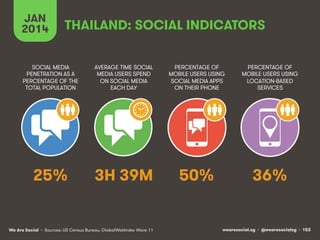
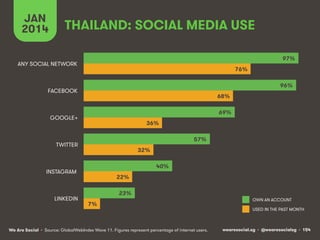
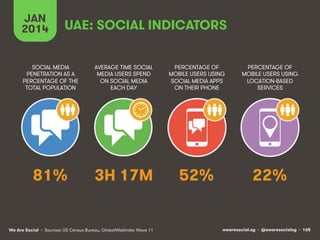
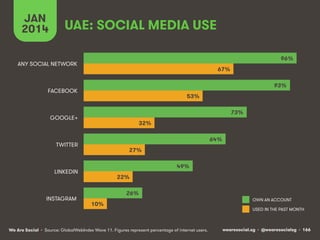
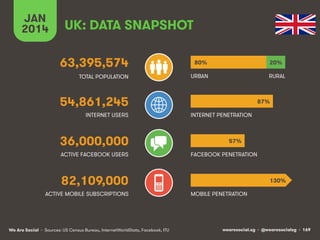
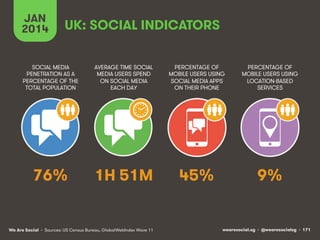
Download as PDF, PPTX
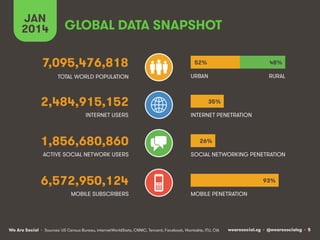
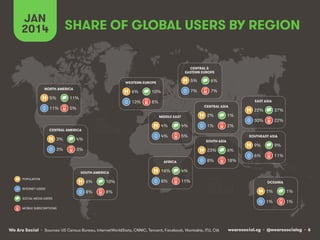
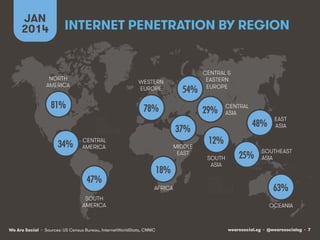
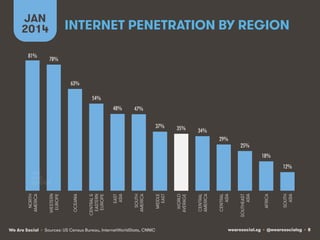
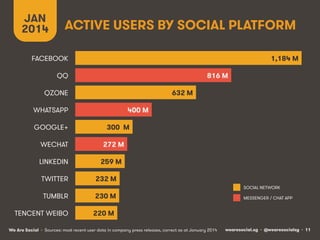


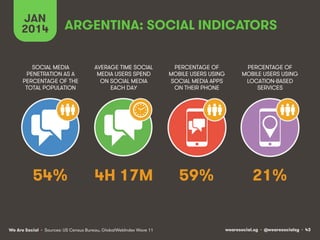
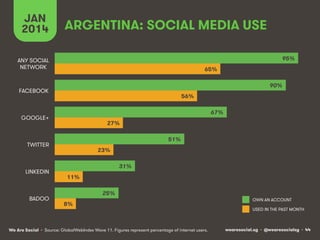
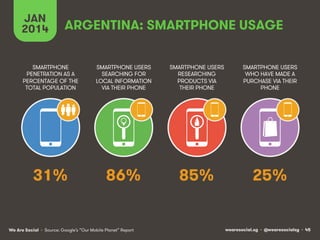
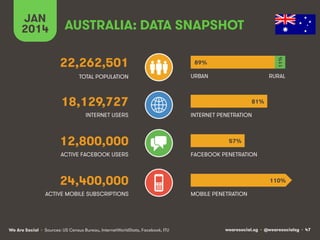

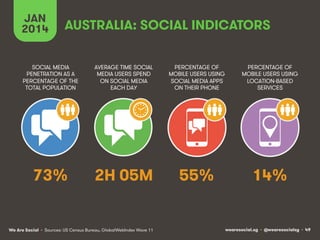
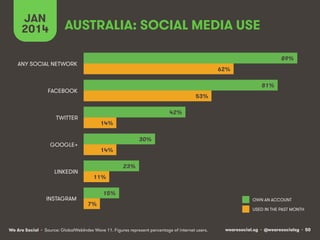
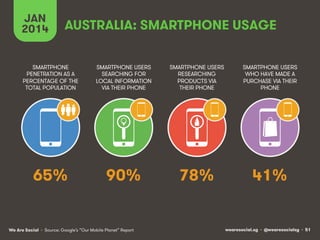

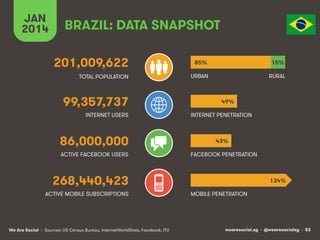


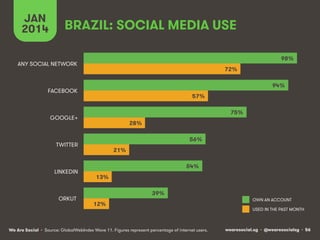


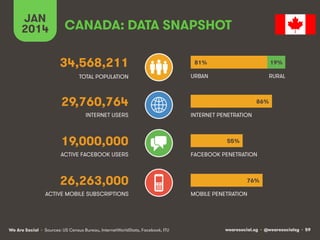

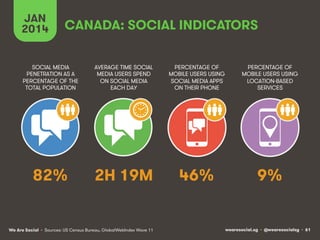

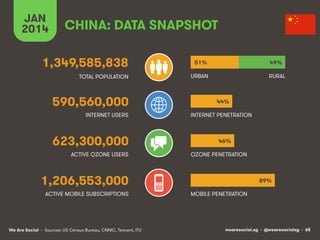


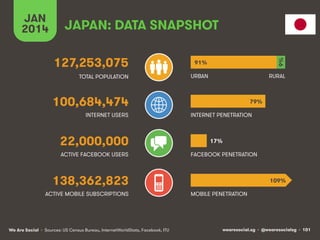


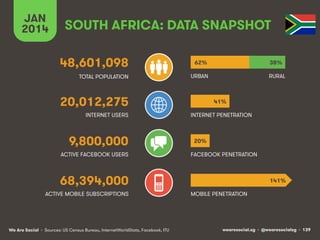


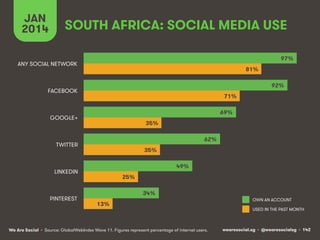


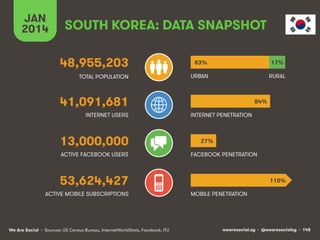


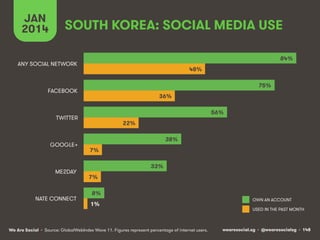


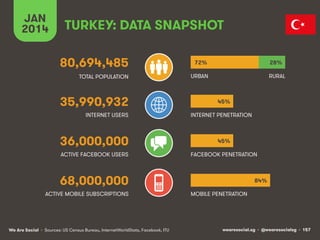
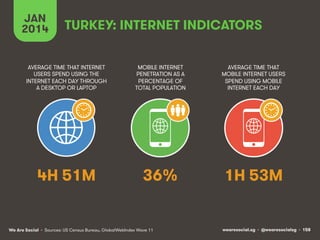

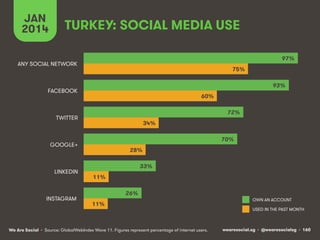


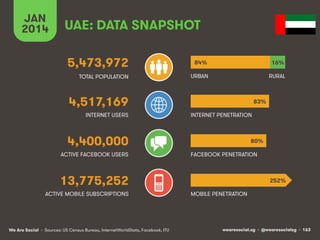


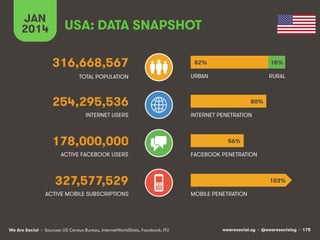


This document is a report from We Are Social that provides global and regional statistics on digital trends as of January 2014. Some key findings include: there were over 2 billion internet users worldwide in 2014 representing 35% internet penetration globally; nearly 1.9 billion people actively used social media accounting for 26% of the world's population; and over 6.5 billion mobile subscriptions amounted to a 93% mobile penetration rate worldwide. The report also analyzes and compares regional data on internet, social media, and mobile connectivity.


