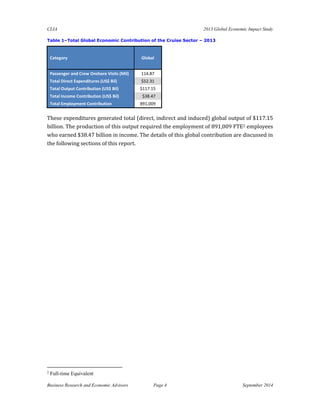
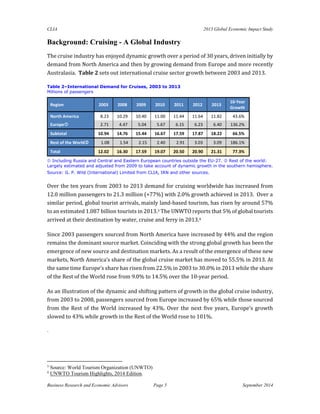
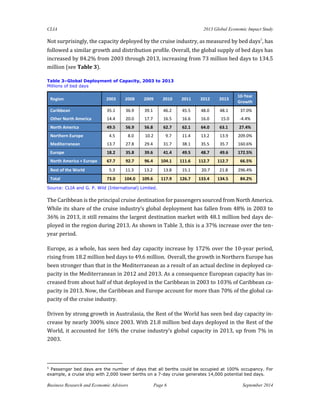
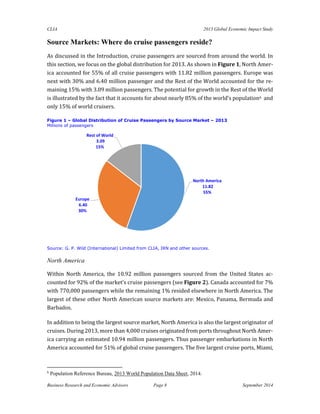
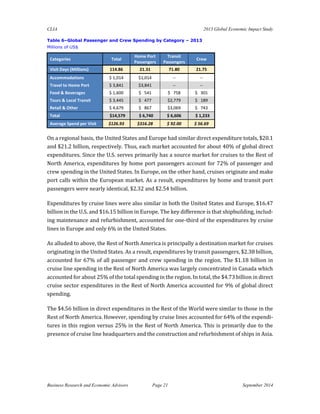
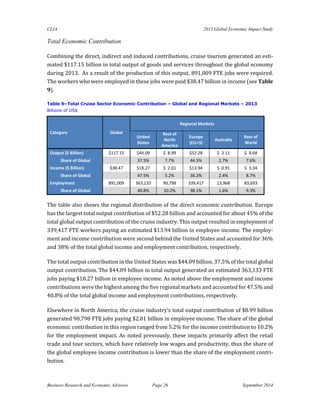
The document provides an analysis of the global economic contribution of the cruise tourism industry in 2013. Some key points:
- Cruise tourism generated $52.31 billion in direct expenditures globally and supported a total output of $117.15 billion.
- The industry supported 891,009 jobs worldwide and labor income of $38.47 billion.
- North America accounted for 55% of cruise passengers, Europe 30%, and the rest of the world 15%. The Caribbean, Europe, and other parts of North America were the largest destination markets.
- Between 2003-2013, the global cruise industry grew significantly, with passenger numbers up 77% and cruise ship capacity up 84%. Growth has shifted from North
This document provides an overview of climate and climate change in Mali. It finds that Mali experiences high rainfall variability, especially in the north. Temperatures have increased over 1979-2015, with the largest rise in the arid region. Projections show continued temperature increases and uncertain rainfall changes, with some models suggesting decreases in rainfall. The document outlines Mali's climate vulnerabilities and priorities for adaptation and mitigation in agriculture, water, and other sectors.
Tourism has become one of the fastest growing economic sectors in the world according to the UN World Tourism Organisation. It represents an important source of revenue for many developing countries and benefits related sectors such as agriculture, construction, and manufacturing through increased demand for food products, materials, and other goods. In 2013, tourism growth was strongest in Asia and the Pacific and Africa, with the number of international tourists growing substantially in both regions. Globally, tourism accounts for 1% of total water consumption and over half of all international tourists arrive at their destination by air. It is also a key export for many least developed countries.
Airlines for America releases its annual Winter Holiday Air Travel Forecast projecting that 44.3 million travelers will fly during the 21-day period from December 16, 2013-January 5, 2014. This is a two percent increase from 2013, or roughly 41,000 passengers daily. In addition, U.S. airlines' improving financials are enabling significant reinvestment in the travel experience for the flying public.
The Philippines aims to attract upper-middle class travelers from Europe and the U.S. by creating travel packages and Pacific cruise trips that include stops in the Philippines, while emphasizing traveler safety through guided trips that showcase the country's diverse landscapes including beaches and mountains.
This document provides information about the Western Visayas region of the Philippines, which includes the provinces of Aklan, Antique, Capiz, Guimaras, Iloilo, and Negros Occidental. It details the geography, economy, industries, tourist attractions, and other key facts about each province. The major points covered are:
- Western Visayas has 6 provinces and 16 cities, with Iloilo City as the regional center.
- The economies rely on agriculture (rice, coconut, fish), fishing, tourism, and industries like sugar and furniture production.
- Major tourist attractions include Boracay Island in Aklan, Ati-Atihan Festival in Kalibo,
Ferdinand Magellan arrived in the Philippines in 1521, claiming the lands for Spain and converting some locals to Catholicism. However, Lapu-Lapu, a native ruler, resisted Spanish colonization and killed Magellan in 1521. Spain then began over 300 years of colonization, introducing Christianity, exploiting gold and other resources, and establishing political and economic systems like the encomienda. Filipino nationalism emerged in response to Spanish abuses, led by reformists like Rizal, del Pilar, and Lopez Jaena. Their Katipunan revolutionary movement was suppressed, leading to the Philippine Revolution and war for independence from Spain.
The document provides an overview of the US cruise industry in 2013. It summarizes that the US cruise market was $22.1 billion in 2013, accounting for 58.79% of the global cruise market. It also outlines key metrics on passenger numbers, revenues, categories and prices, popular destinations, influencers, growth drivers and challenges for the industry.
This report analyzes operational incidents on cruise ships from 2009 to 2013. It finds that as cruise ship capacity has grown 20% over this period, significant operational incidents have decreased. On average, there are 20 significant incidents and 20 minor incidents reported per year. Compared to other modes of transportation, cruise passenger and crew fatality rates from operational incidents are low - 0.08 fatalities per billion passenger miles in 2011 versus 0.16 for airlines. Man overboard incidents have also declined, falling from 23 incidents in 2009 to 12 in 2013. The report concludes cruise ship operational safety compares favorably to air, road and rail transportation based on available data.
Uneca af db-auc statistics for good economic governance, regional intergratio...Dr Lendy Spires
This document presents a project to improve economic statistics in Africa by assisting countries to implement the 2008 System of National Accounts (SNA). It notes that while Africa has experienced rapid economic growth, the quality of economic data is limited, hampering effective policymaking. The 2008 SNA implementation would help produce timely, accurate GDP and related indicators according to international standards.
The project is developed by the African Group on National Accounts (AGNA) under the African Union's Statistical Commission for Africa. It aims to build statistical capacity in African countries over five years through training, technical support, and advocacy. The first phase focuses on capacity building activities and has a budget of $4.9 million. The document outlines governance structures, implementation strategies
The document provides an overview of developments in the global airline industry, focusing on growth projections, new technologies, and sustainability considerations. Some key points:
- Air passenger traffic is expected to double by 2030, straining existing airport infrastructure. The ICAO is working with stakeholders to implement efficiency improvements through its Global Plan.
- New technologies like continuous descent operations, arrival management, and airborne collision avoidance systems aim to increase airspace capacity and flight efficiency while improving safety.
- Automated flight control technologies could allow for fully automated piloting in the future, taking control of aircraft in emergency situations. However, investments are still needed to integrate these systems.
- Sustainable aviation fuels and more fuel
Aviation carbon footprint of global scheduled international passenger flights...Dave Southgate
This book describes the carbon footprint of global international aircraft operations in 2012. It contains a large number of graphics and tables which are designed to make the data readily accessible to the reader.
The document provides a summary of key air transport statistics and trends in 2013:
- Global passenger traffic grew 4.5% to over 3.1 billion passengers carried. Revenue passenger kilometers increased 0.4% to 5.8 trillion.
- Cargo traffic as measured by freight tonne-kilometers increased 5.5% to 186 billion tonne-kilometers globally.
- Asia Pacific has become the largest market for both passenger and cargo traffic, surpassing North America, with over 30% of global RPKs and 40% of freight tonne-kilometers. The Middle East market share has been growing each year.
Socio-economic trends and EU policy in offshore economy: TOURISM Sara Barrento
EU Report: MARIBE is a Horizon 2020 project that aims to unlock the potential of multi-use of space in the
offshore economy (also referred to as Blue Economy). This forms part of the long-term Blue Growth
(BG) strategy to support sustainable growth in the marine and maritime sectors as a whole;
something which is at the heart of the Integrated Maritime Policy, the EU Innovation Union, and the
Europe 2020 strategy for smart, sustainable growth.
Cruise Industry Contribution to European Economy - 2014 EditionCrucerista.net
This document summarizes the contribution of the cruise tourism industry to the European economy in 2013. Some key points:
- The cruise industry generated €16.2 billion in direct expenditures in Europe, a 4.7% increase from 2012. This supported over 164,000 direct jobs and €4.97 billion in employee compensation.
- The total economic impact of the cruise industry in Europe was €39.4 billion in output, over 339,000 total jobs supported, and €10.5 billion in total employee compensation.
- The top 5 countries (Italy, Germany, UK, Spain, France) accounted for around 80% of the cruise industry's economic impacts in Europe, with most focused on serving passengers
The document provides an overview of global tourism statistics and the tourism industry. It discusses how the tourism industry contributes to the global economy and GDP. It also describes the impact of COVID-19 on the tourism sector, with international tourism revenue decreasing 42.1% in 2020. Finally, it outlines the categorization of countries into "four worlds" based on their economic status and political alignment during the Cold War era.
(ReflectionHighlights the need for further research, based onVannaJoy20
(
Reflection
Highlights the need for further research, based on the economic impacts of renewable energy developments on the Welsh tourism industry
(particularly industry based research)
This
Report
contributes to raising awareness regarding
the economic impacts that onshore wind energy has on the tourism sector in Wales
.
Further research into economically focused case studies is on going
Further Development of Supporting Theory is ongoing
Porter’s Diamond was taken out of V2 due to a difficulty in linking to the other models and relevance to the objectives.
) (
Contribution
Will show a clear understanding of the size, growth, trends and success factors of the tourism industry in the 7 Strategic Search Areas
by using market analysis to determine
the size and future trends of the sector, using desk research from industry and government data and also using survey to capture survey from local stakeholders
.
To determine the economic impact of proposed developments on the tourism industry; by using number of analytical tools to look at the benefits and
dis
-benefits
, such as a PEST analysis focusing on economic trends to measure potential economic impacts. Also using a Cost Benefit Analysis to see whether the potential benefits outweigh the potential
dis
benefits (particularly at an economic level)
T
o determine how Wind Farm developments could enable tourist activity in Wales
, by using an input-output analysis to measure the relationship between wind farm development and the tourism industry and also by looking at the economic effects of this relationship in terms of multipliers.
Shall provide complimentary support to the achievement of the key project aims, including; potential for positive economic impact in the Welsh tourism sector
) (
Supporting Theory
Objective Based:
Stakeholder Mapping
Mendelow
(1991)
–
to identify key stakeholders and to identify interests of stakeholders in relation to economic impacts of tourism in Wales.
Also identifies possible conflict of interests and can be used to look deeply at the relationships between these stakeholders.
Market Analysis
Kress et al (1994)
–
mainly used to assess the size, growth and future trends of the tourism sector. Size will focus on volumes (turnover, visitors, GVA). Trends focuses on potential changes in sector (opportunities + threats
)(
could change market size). Also uses desk research for industry figures (Govt, trade etc) as well as attitude surveys.
PEST Analysis
Used
to look at the political, economic, socio cultural, technological changes in the business environment
.
Helps to identify potential opportunities and threats (particular focus on economical side).
Cost Benefit Analysis
Depuit
(1844)
– used to measure the positive and negative consequences of a project
over a period of time
, while including s
ocial and environmental impacts.
Used to see if it is economically beneficial to the regions in terms of tourist activity.
Can be a quantifiab ...
Tourism Australia’s Quarterly Market Update provides an update to industry on the current state of international tourism for Australia. This report covers International Visitor Survey data to June 2013, and Australian Bureau of Statistics data to September 2013. For historic reports please visit: www.tourism.australia.com/markets/market-regions.aspx
Dominican Republic: Passenger Trends, Airports and Airlines vaughn cordle
Passenger trends for the top 7 airports. Information includes airline and airport market share from the late 90s, in addition to country GDP growth rates and estimates
PRESENTATION AND REGRESSION ANALYSIS OF POPULATION, ECONOMIC AND ENVIRONMENTA...Rajat Nag
The document presents data on population, GDP, energy consumption, and land area for 23 countries from different continents. It includes a table with this raw data. The data is then analyzed by creating another table with GDP per capita, energy use per capita, and population density. A graph is made showing energy consumption per capita increases with higher GDP per capita, with an R2 value of 0.709, indicating GDP explains about 71% of the variation in energy use. Some small countries lack energy data likely due to small emissions amounts.
Egypt has faced an economic crisis in recent years due to political unrest. This has depleted foreign currency reserves and increased the budget deficit. While GDP growth was recently 2.3%, key sectors like tourism and manufacturing have underperformed. Foreign reserves decreased to $17.76 billion in November 2013 due to declines in foreign investment and tourism. Domestic and external debt have also increased. The central bank has maintained interest rates to control inflation, but the pound's value has fallen, risking higher food prices and more unrest.
In the last two years since the publication of the previous
edition of the Travel & Tourism Competitiveness Report,
the framework conditions for the Travel and Tourism
(T&T) sector have changed significantly. The world has
been facing geopolitical tensions from the Middle East
and Ukraine to South-East Asia, growing terrorism
threats and fear of the spread of global pandemics.
Should they persist, these global challenges could have
significant further repercussions on the T&T industry, as they touch on the pre-condition for the sector
to grow and develop—the ability of people to travel
safely.
The World Economic Forum has, for the past nine
years, engaged key industry and thought leaders through
its Aviation & Travel Industry Partnership Programme,
along with its Global Agenda Council on the Future of
Travel & Tourism, to carry out an in-depth analysis of the
T&T competitiveness of economies around the world.
The resulting Travel & Tourism Competitiveness Report
provides a platform for multistakeholder dialogue with the objective of achieving a strong and sustainable
T&T industry capable of contributing effectively to
international economic development.
At the core of the Report is the sixth edition of the
Travel & Tourism Competitiveness Index (TTCI). The aim
of the TTCI, which covers a record 141 economies this
year, is to provide a comprehensive strategic tool for
measuring the “the set of factors and policies that enable
the sustainable development of the Travel & Tourism
sector, which in turn, contributes to the development
and competitiveness of a country.”
2015 - CLIA Europe Economic Contribution ReportCrucerista.net
The cruise industry generated significant economic benefits throughout Europe in 2014. Direct expenditures totaled €16.6 billion, supporting nearly 170,000 jobs and €5.1 billion in employee compensation. Shipbuilding expenditures increased 12.8% to €4.55 billion, driving overall growth. Passenger and crew spending declined 4.2% due to fewer embarkations and port visits. Total economic impacts included €40.2 billion in output, 349,000 jobs, and €10.8 billion in compensation. The majority of impacts occurred in Italy, Germany, the UK, Spain, and France.
The aviation industry has experienced exponential growth over the past century, doubling in size every 15 years. In 2016, airlines carried 3.8 billion passengers and 53 million tonnes of freight. Aviation is a major contributor to the global economy, supporting 62.7 million jobs and $2.7 trillion in economic impact. It facilitates international trade and tourism, connecting people and cultures worldwide. The future of aviation looks bright, with passenger and freight traffic projected to more than double by 2034.
This document analyzes the economic impacts of two events in Wasco County, Oregon: What the Festival and RiverFest. For What the Festival, the analysis estimates $504,900 in direct visitor spending based on 4,500 attendees, of which 68% were non-local. Applying a regional multiplier of 1.45 yields total economic impacts of $732,105 for What the Festival in 2013 dollars. For RiverFest, direct spending is estimated to be $225,000 based on 2,000 attendees, of which 60% were non-local. The total economic impact is $322,500 after applying the same regional multiplier. Both events are found to generate new economic activity in Wasco County through visitor spending.
The travel and tourism industry in the United States grew faster than the overall economy in 2015. Specifically:
- Real output of the travel and tourism industry increased 4.7% in 2015, faster than the 2.4% growth of overall real GDP.
- Several components of the travel and tourism industry accelerated in 2015, including traveler accommodations, international passenger air transportation, and food and beverage services.
- Overall prices for tourism goods and services decreased 3.1% in 2015, driven largely by a 26.7% decline in gasoline prices. However, prices increased for most individual tourism commodities.
Tourism as a Driver of Growth in the Pacific: A Pathway to Growth & Prosperit...SW Associates, LLC
Tourism to the Pacific is increasing and will be a key driver of economic growth in the coming decade. Yet despite more visitors to the Pacific, tourism growth is not inevitable for all countries in the region.
This brief identifies the trends driving this increase. To secure and sustainably harness the benefits of this growth, this brief recommends that Pacific island countries create an enabling environment for tourism through interventions in four areas:
tourism policy, strategy, and the regulatory environment; infrastructure; human resources; and product development and marketing.
Best Places to Stay in New Brunswick, Canada.Mahogany Manor
New Brunswick, a picturesque province in eastern Canada, offers a plethora of unique and charming places to stay for every kind of traveler. From the historic allure of Fredericton and the vibrant culture of Saint John to the natural beauty of Fundy National Park and the serene coastal towns like St. Andrews by-the-Sea, there's something for everyone. Whether you prefer luxury resorts, cozy inns, rustic lodges, or budget-friendly options, the best places to stay in New Brunswick ensure a memorable stay, allowing you to fully immerse yourself in the province's rich history, stunning landscapes, and warm hospitality.
https://www.mmanor.ca/blog/best-5-bed-and-breakfast-new-brunswick-canada
Our excursions in tahiti offer stunning lagoon tours, vibrant marine life encounters, and cultural experiences. We ensure unforgettable adventures amidst breathtaking landscapes and serene waters. For more information, mail us at tracey@uniquetahiti.com.
More Related Content
Similar to Global Economic Contribution of Cruise Tourism - 2013
Uneca af db-auc statistics for good economic governance, regional intergratio...Dr Lendy Spires
This document presents a project to improve economic statistics in Africa by assisting countries to implement the 2008 System of National Accounts (SNA). It notes that while Africa has experienced rapid economic growth, the quality of economic data is limited, hampering effective policymaking. The 2008 SNA implementation would help produce timely, accurate GDP and related indicators according to international standards.
The project is developed by the African Group on National Accounts (AGNA) under the African Union's Statistical Commission for Africa. It aims to build statistical capacity in African countries over five years through training, technical support, and advocacy. The first phase focuses on capacity building activities and has a budget of $4.9 million. The document outlines governance structures, implementation strategies
The document provides an overview of developments in the global airline industry, focusing on growth projections, new technologies, and sustainability considerations. Some key points:
- Air passenger traffic is expected to double by 2030, straining existing airport infrastructure. The ICAO is working with stakeholders to implement efficiency improvements through its Global Plan.
- New technologies like continuous descent operations, arrival management, and airborne collision avoidance systems aim to increase airspace capacity and flight efficiency while improving safety.
- Automated flight control technologies could allow for fully automated piloting in the future, taking control of aircraft in emergency situations. However, investments are still needed to integrate these systems.
- Sustainable aviation fuels and more fuel
Aviation carbon footprint of global scheduled international passenger flights...Dave Southgate
This book describes the carbon footprint of global international aircraft operations in 2012. It contains a large number of graphics and tables which are designed to make the data readily accessible to the reader.
The document provides a summary of key air transport statistics and trends in 2013:
- Global passenger traffic grew 4.5% to over 3.1 billion passengers carried. Revenue passenger kilometers increased 0.4% to 5.8 trillion.
- Cargo traffic as measured by freight tonne-kilometers increased 5.5% to 186 billion tonne-kilometers globally.
- Asia Pacific has become the largest market for both passenger and cargo traffic, surpassing North America, with over 30% of global RPKs and 40% of freight tonne-kilometers. The Middle East market share has been growing each year.
Socio-economic trends and EU policy in offshore economy: TOURISM Sara Barrento
EU Report: MARIBE is a Horizon 2020 project that aims to unlock the potential of multi-use of space in the
offshore economy (also referred to as Blue Economy). This forms part of the long-term Blue Growth
(BG) strategy to support sustainable growth in the marine and maritime sectors as a whole;
something which is at the heart of the Integrated Maritime Policy, the EU Innovation Union, and the
Europe 2020 strategy for smart, sustainable growth.
Cruise Industry Contribution to European Economy - 2014 EditionCrucerista.net
This document summarizes the contribution of the cruise tourism industry to the European economy in 2013. Some key points:
- The cruise industry generated €16.2 billion in direct expenditures in Europe, a 4.7% increase from 2012. This supported over 164,000 direct jobs and €4.97 billion in employee compensation.
- The total economic impact of the cruise industry in Europe was €39.4 billion in output, over 339,000 total jobs supported, and €10.5 billion in total employee compensation.
- The top 5 countries (Italy, Germany, UK, Spain, France) accounted for around 80% of the cruise industry's economic impacts in Europe, with most focused on serving passengers
The document provides an overview of global tourism statistics and the tourism industry. It discusses how the tourism industry contributes to the global economy and GDP. It also describes the impact of COVID-19 on the tourism sector, with international tourism revenue decreasing 42.1% in 2020. Finally, it outlines the categorization of countries into "four worlds" based on their economic status and political alignment during the Cold War era.
(ReflectionHighlights the need for further research, based onVannaJoy20
(
Reflection
Highlights the need for further research, based on the economic impacts of renewable energy developments on the Welsh tourism industry
(particularly industry based research)
This
Report
contributes to raising awareness regarding
the economic impacts that onshore wind energy has on the tourism sector in Wales
.
Further research into economically focused case studies is on going
Further Development of Supporting Theory is ongoing
Porter’s Diamond was taken out of V2 due to a difficulty in linking to the other models and relevance to the objectives.
) (
Contribution
Will show a clear understanding of the size, growth, trends and success factors of the tourism industry in the 7 Strategic Search Areas
by using market analysis to determine
the size and future trends of the sector, using desk research from industry and government data and also using survey to capture survey from local stakeholders
.
To determine the economic impact of proposed developments on the tourism industry; by using number of analytical tools to look at the benefits and
dis
-benefits
, such as a PEST analysis focusing on economic trends to measure potential economic impacts. Also using a Cost Benefit Analysis to see whether the potential benefits outweigh the potential
dis
benefits (particularly at an economic level)
T
o determine how Wind Farm developments could enable tourist activity in Wales
, by using an input-output analysis to measure the relationship between wind farm development and the tourism industry and also by looking at the economic effects of this relationship in terms of multipliers.
Shall provide complimentary support to the achievement of the key project aims, including; potential for positive economic impact in the Welsh tourism sector
) (
Supporting Theory
Objective Based:
Stakeholder Mapping
Mendelow
(1991)
–
to identify key stakeholders and to identify interests of stakeholders in relation to economic impacts of tourism in Wales.
Also identifies possible conflict of interests and can be used to look deeply at the relationships between these stakeholders.
Market Analysis
Kress et al (1994)
–
mainly used to assess the size, growth and future trends of the tourism sector. Size will focus on volumes (turnover, visitors, GVA). Trends focuses on potential changes in sector (opportunities + threats
)(
could change market size). Also uses desk research for industry figures (Govt, trade etc) as well as attitude surveys.
PEST Analysis
Used
to look at the political, economic, socio cultural, technological changes in the business environment
.
Helps to identify potential opportunities and threats (particular focus on economical side).
Cost Benefit Analysis
Depuit
(1844)
– used to measure the positive and negative consequences of a project
over a period of time
, while including s
ocial and environmental impacts.
Used to see if it is economically beneficial to the regions in terms of tourist activity.
Can be a quantifiab ...
Tourism Australia’s Quarterly Market Update provides an update to industry on the current state of international tourism for Australia. This report covers International Visitor Survey data to June 2013, and Australian Bureau of Statistics data to September 2013. For historic reports please visit: www.tourism.australia.com/markets/market-regions.aspx
Dominican Republic: Passenger Trends, Airports and Airlines vaughn cordle
Passenger trends for the top 7 airports. Information includes airline and airport market share from the late 90s, in addition to country GDP growth rates and estimates
PRESENTATION AND REGRESSION ANALYSIS OF POPULATION, ECONOMIC AND ENVIRONMENTA...Rajat Nag
The document presents data on population, GDP, energy consumption, and land area for 23 countries from different continents. It includes a table with this raw data. The data is then analyzed by creating another table with GDP per capita, energy use per capita, and population density. A graph is made showing energy consumption per capita increases with higher GDP per capita, with an R2 value of 0.709, indicating GDP explains about 71% of the variation in energy use. Some small countries lack energy data likely due to small emissions amounts.
Egypt has faced an economic crisis in recent years due to political unrest. This has depleted foreign currency reserves and increased the budget deficit. While GDP growth was recently 2.3%, key sectors like tourism and manufacturing have underperformed. Foreign reserves decreased to $17.76 billion in November 2013 due to declines in foreign investment and tourism. Domestic and external debt have also increased. The central bank has maintained interest rates to control inflation, but the pound's value has fallen, risking higher food prices and more unrest.
In the last two years since the publication of the previous
edition of the Travel & Tourism Competitiveness Report,
the framework conditions for the Travel and Tourism
(T&T) sector have changed significantly. The world has
been facing geopolitical tensions from the Middle East
and Ukraine to South-East Asia, growing terrorism
threats and fear of the spread of global pandemics.
Should they persist, these global challenges could have
significant further repercussions on the T&T industry, as they touch on the pre-condition for the sector
to grow and develop—the ability of people to travel
safely.
The World Economic Forum has, for the past nine
years, engaged key industry and thought leaders through
its Aviation & Travel Industry Partnership Programme,
along with its Global Agenda Council on the Future of
Travel & Tourism, to carry out an in-depth analysis of the
T&T competitiveness of economies around the world.
The resulting Travel & Tourism Competitiveness Report
provides a platform for multistakeholder dialogue with the objective of achieving a strong and sustainable
T&T industry capable of contributing effectively to
international economic development.
At the core of the Report is the sixth edition of the
Travel & Tourism Competitiveness Index (TTCI). The aim
of the TTCI, which covers a record 141 economies this
year, is to provide a comprehensive strategic tool for
measuring the “the set of factors and policies that enable
the sustainable development of the Travel & Tourism
sector, which in turn, contributes to the development
and competitiveness of a country.”
2015 - CLIA Europe Economic Contribution ReportCrucerista.net
The cruise industry generated significant economic benefits throughout Europe in 2014. Direct expenditures totaled €16.6 billion, supporting nearly 170,000 jobs and €5.1 billion in employee compensation. Shipbuilding expenditures increased 12.8% to €4.55 billion, driving overall growth. Passenger and crew spending declined 4.2% due to fewer embarkations and port visits. Total economic impacts included €40.2 billion in output, 349,000 jobs, and €10.8 billion in compensation. The majority of impacts occurred in Italy, Germany, the UK, Spain, and France.
The aviation industry has experienced exponential growth over the past century, doubling in size every 15 years. In 2016, airlines carried 3.8 billion passengers and 53 million tonnes of freight. Aviation is a major contributor to the global economy, supporting 62.7 million jobs and $2.7 trillion in economic impact. It facilitates international trade and tourism, connecting people and cultures worldwide. The future of aviation looks bright, with passenger and freight traffic projected to more than double by 2034.
This document analyzes the economic impacts of two events in Wasco County, Oregon: What the Festival and RiverFest. For What the Festival, the analysis estimates $504,900 in direct visitor spending based on 4,500 attendees, of which 68% were non-local. Applying a regional multiplier of 1.45 yields total economic impacts of $732,105 for What the Festival in 2013 dollars. For RiverFest, direct spending is estimated to be $225,000 based on 2,000 attendees, of which 60% were non-local. The total economic impact is $322,500 after applying the same regional multiplier. Both events are found to generate new economic activity in Wasco County through visitor spending.
The travel and tourism industry in the United States grew faster than the overall economy in 2015. Specifically:
- Real output of the travel and tourism industry increased 4.7% in 2015, faster than the 2.4% growth of overall real GDP.
- Several components of the travel and tourism industry accelerated in 2015, including traveler accommodations, international passenger air transportation, and food and beverage services.
- Overall prices for tourism goods and services decreased 3.1% in 2015, driven largely by a 26.7% decline in gasoline prices. However, prices increased for most individual tourism commodities.
Tourism as a Driver of Growth in the Pacific: A Pathway to Growth & Prosperit...SW Associates, LLC
Tourism to the Pacific is increasing and will be a key driver of economic growth in the coming decade. Yet despite more visitors to the Pacific, tourism growth is not inevitable for all countries in the region.
This brief identifies the trends driving this increase. To secure and sustainably harness the benefits of this growth, this brief recommends that Pacific island countries create an enabling environment for tourism through interventions in four areas:
tourism policy, strategy, and the regulatory environment; infrastructure; human resources; and product development and marketing.
Similar to Global Economic Contribution of Cruise Tourism - 2013 (20)
Best Places to Stay in New Brunswick, Canada.Mahogany Manor
New Brunswick, a picturesque province in eastern Canada, offers a plethora of unique and charming places to stay for every kind of traveler. From the historic allure of Fredericton and the vibrant culture of Saint John to the natural beauty of Fundy National Park and the serene coastal towns like St. Andrews by-the-Sea, there's something for everyone. Whether you prefer luxury resorts, cozy inns, rustic lodges, or budget-friendly options, the best places to stay in New Brunswick ensure a memorable stay, allowing you to fully immerse yourself in the province's rich history, stunning landscapes, and warm hospitality.
https://www.mmanor.ca/blog/best-5-bed-and-breakfast-new-brunswick-canada
Our excursions in tahiti offer stunning lagoon tours, vibrant marine life encounters, and cultural experiences. We ensure unforgettable adventures amidst breathtaking landscapes and serene waters. For more information, mail us at tracey@uniquetahiti.com.
How do I plan a Kilimanjaro Climb?
Planning to climb Mount Kilimanjaro is an exciting yet detailed process. Here’s a step-by-step guide to help you prepare for this incredible adventure.
Un viaje a Buenos Aires y sus alrededoresJudy Hochberg
A travelogue of my recent trip to Argentina, most to Buenos Aires, but including excursion to Iguazú waterfalls, Tigre, and Colonia del Sacramento in Uruguay
Discovering Egypt A Step-by-Step Guide to Planning Your Trip.pptImperial Egypt
Travelling to Egypt is like stepping into a time capsule where the past and present coexist, offering a unique blend of history, culture, and stunning landscapes.
See more: https://imperialegypt.com/tour-packages/
Assessing the Influence of Transportation on the Tourism Industry in Nigeriagsochially
This research dissertation investigates the complex interplay between transportation and the tourism industry in Nigeria, aiming to unravel critical insights that contribute to the enhancement of the overall tourist experience. The study employs a multi-faceted approach, literature review establishes a robust theoretical framework, incorporating The Service Quality and Satisfaction Theory to guide the research questions and hypotheses.
The methodology involves the distribution of a structured questionnaire, ensuring a representative sample and facilitating a comprehensive analysis of the gathered data.
Key findings include the nuanced perceptions of transportation infrastructure adequacy, safety and security concerns, financial influences on travel decisions, and the cultural and ecological impacts of transportation choices. These findings culminate in a comprehensive set of recommendations for policymakers and practitioners in the Nigerian tourism industry. The findings contribute to the existing literature by providing actionable insights for policymakers, stakeholders, and researchers in the Nigerian tourism sector.
The recommendations encompass gender-sensitive planning, infrastructure enhancements, safety measures, and strategic interventions to address financial constraints, ensuring a holistic and sustainable development of the tourism industry in Nigeria.
Author: Imafidon Osademwingie Martins
What Challenges Await Beginners in SnowshoeingSnowshoe Tahoe
Discover the exhilarating world of snowshoeing through our presentation, highlighting the challenges faced by beginners. From physical exertion to technical finesse and braving harsh winter conditions, each step in the snow brings new obstacles and unforgettable adventures. Embrace the challenge and conquer the winter wonderland with confidence!
How To Change Your Name On American Airlines Aadvantage.pptxedqour001namechange
American Airlines permits passengers to change/correct names on their AAdvantage account. Also, you can request a name change both online via a web portal and offline over the phone. For further information on how to change your name on American Airlines Advantage, get in touch with the airline’s customer service. Also, you can reach out to a consolidation desk at +1-866-738-0741 for quick assistance.
You can easily change/correct a name on your flight ticket under the American Airlines name change policy. The airline provides multiple online and offline modes to place a name change request. To learn more about how to change a name on American Airlines ticket, you can directly approach the airline’s customer support. Moreover, you can connect with a flight expert at +1-866-738-0741 for quick assistance.
Wayanad-The-Touristry-Heaven to the tour.pptxcosmo-soil
Wayanad, nestled in Kerala's Western Ghats, is a lush paradise renowned for its scenic landscapes, rich biodiversity, and cultural heritage. From trekking Chembra Peak to exploring ancient Edakkal Caves, Wayanad offers thrilling adventures and serene experiences. Its vibrant economy, driven by agriculture and tourism, highlights a harmonious blend of nature, tradition, and modernity.
Global Economic Contribution of Cruise Tourism - 2013
1. Business Research & Economic Advisors
P.O. Box 955
Exton, PA 19341
The Global Economic Contribution of Cruise Tourism 2013
Prepared for:
CLIA
September 2014
BREA
Business Research & Economic Advisors
2. CLIA 2013 Global Economic Impact Study
Business Research and Economic Advisors Page 1 September 2014
Table of Contents
INTRODUCTION ................................................................................................................ 2
Methodology ............................................................................................................... 2
Global Economic Impacts ........................................................................................... 3
BACKGROUND: CRUISING - A GLOBAL INDUSTRY ........................................................... 5
SOURCE MARKETS: WHERE DO CRUISE PASSENGERS RESIDE? ......................................... 8
North America ............................................................................................................. 8
Europe ......................................................................................................................... 9
Rest of the World ....................................................................................................... 10
Top Ten Countries..................................................................................................... 11
DESTINATION MARKETS: WHERE ARE CRUISE SHIPS DEPLOYED? .................................. 13
North America ........................................................................................................... 13
Europe ....................................................................................................................... 15
Asia/Pacific ............................................................................................................... 15
Rest of the World ....................................................................................................... 16
PASSENGER AND CREW ONSHORE VISITS ...................................................................... 18
DIRECT EXPENDITURES GENERATED BY CRUISE TOURISM ............................................ 20
ECONOMIC CONTRIBUTION GENERATED BY CRUISE TOURISM IN 2013 ......................... 23
Direct Economic Contribution .................................................................................. 23
Indirect and Induced Economic Contribution .......................................................... 25
Total Economic Contribution ................................................................................... 26
3. CLIA 2013 Global Economic Impact Study
Business Research and Economic Advisors Page 2 September 2014
Introduction
Business Research and Economic Advisors (BREA) was engaged by the Cruise Lines In- ternational Association (CLIA) to provide estimates of the contribution of the cruise indus- try to the global economy in 2013.1 Data on passengers by source and destination market, as well as the global deployment of the global cruise fleet were obtained from sources published by CLIA. Research reports on passenger and crew expenditures and the eco- nomic impact of the industry in specific national and regional markets were assembled and reviewed.
Methodology
The global impact relied heavily on existing reports by BREA and other researchers and rep- resents an aggregation of the results reported in these studies plus estimates developed for regions where data were not readily available. The majority of the global economic contribu- tion reported below is derived directly from studies prepared for CLIA by BREA. Data on pas- senger and crew visits, direct expenditures of the cruise lines and their passengers and crew and the resulting economic impacts were taken directly from these reports and shown in the regional data for the United States, Europe EU+3 and Australia. These reports were:
I. BREA, The Economic Contribution of the North American Cruise Industry to the U.S. Economy in 2013, prepared for Cruise Lines International Association, September 2014.
II. BREA and G. P. Wild (International) Ltd., Contribution of Cruise Tourism to the Econo- mies of Europe, 2013, prepared for CLIA Europe, June 2014.
III. BREA, The Contribution of Cruise Tourism to the Australian Economy in 2013, prepared for CLIA Australasia, July 2014.
Combined, these three regions accounted for approximately 85% of the global total output contribution of cruise tourism.
The estimates of the global contribution for the Rest of North America were estimated by extrapolating the 2012 estimates for the Caribbean, Canada and Mexico from the following reports.
IV. BREA, Economic Contribution of Cruise Tourism to the Destination Economies, 2011- 12 Cruise Year, prepared for The Florida-Caribbean Cruise Association, September 2012.
1 The terms economic contribution and economic impact are used interchangeably throughout this report.
4. CLIA 2013 Global Economic Impact Study
Business Research and Economic Advisors Page 3 September 2014
V. BREA, The Economic Contribution of the International Cruise Industry in Canada, 2012, prepared for CLIA North West & Canada Cruise Association and Partnering Cruise As- sociations, March 2013.
The data on spending by cruise lines and their passengers and crew were extrapolated to 2013 by adjusting average spending rates for inflation as reported by the appropriate gov- ernment and monetary authorities. Passenger and crew visits were updated with data for 2013 as obtained from the destination ports and the Caribbean Tourism Organization. Given the extrapolated visit and spending data, the direct cruise sector expenditures were esti- mated for each of the markets. The resulting economic impacts were estimated with the same models that were used to estimate the economic impacts for 2012. The Rest of North America accounted for about 8% of the total global economic impacts.
Limited data was available for the Rest of the World which consisted primarily of Asia and South America. Data for Brazil and New Zealand were obtained from the following reports.
VI. FGV Projetos, Maritime Cruises: Study on Profile and Economic Impacts in Brazil, pre- pared for CLIA Abremar Brasil, June 2014.
VII. M.e Spatial, Economic Impact of the New Zealand Cruise Sector, prepared for Cruise New Zealand, August 2013.
The expenditure and economic impact data reported in these studies were directly included in the estimated impacts for the Rest of World. Estimates for all of South America were esti- mated utilizing the Brazilian data and passenger and crew visit data for the rest of South America. Estimates for the remaining global destinations were estimated from average cruise line, passenger and crew expenditure rates for home port and transit port destinations as derived from the above seven studies. The resulting estimated impacts accounted for 7% of the global total output impacts.
Global Economic Impacts
As noted above, the global impact relied heavily on existing reports by BREA and other re- searchers and represents an aggregation of the results reported in these studies plus esti- mates developed for regions where data were not readily available. All data that were re- ported in local currencies, i.e., expenditures, output, income, etc., were converted to US$ for purposes of aggregation.
As shown in Table 1, the 114.87 million onshore visits by passengers and crew generated $52.31 billion in direct cruise sector expenditures at destinations and source markets around the world. These also include the direct expenditures of the cruise lines for goods and services in support of their cruise operations.
5. CLIA 2013 Global Economic Impact Study
Business Research and Economic Advisors Page 4 September 2014
Table 1–Total Global Economic Contribution of the Cruise Sector – 2013 Category Global Passenger and Crew Onshore Visits (Mil) 114.87 Total Direct Expenditures (US$ Bil) $52.31 Total Output Contribution (US$ Bil)
$117.15 Total Income Contribution (US$ Bil) $38.47 Total Employment Contribution 891,009
These expenditures generated total (direct, indirect and induced) global output of $117.15 billion. The production of this output required the employment of 891,009 FTE2 employees who earned $38.47 billion in income. The details of this global contribution are discussed in the following sections of this report.
2 Full-time Equivalent
6. CLIA 2013 Global Economic Impact Study
Business Research and Economic Advisors Page 5 September 2014
Background: Cruising - A Global Industry
The cruise industry has enjoyed dynamic growth over a period of 30 years, driven initially by demand from North America and then by growing demand from Europe and more recently Australasia. Table 2 sets out international cruise sector growth between 2003 and 2013.
Table 2–International Demand for Cruises, 2003 to 2013
Millions of passengers Region 2003 2008 2009 2010 2011 2012 2013 10-Year Growth North America
8.23
10.29
10.40
11.00
11.44
11.64
11.82
43.6% Europe 2.71 4.47 5.04 5.67 6.15 6.23 6.40 136.2% Subtotal
10.94
14.76
15.44
16.67
17.59
17.87
18.22
66.5% Rest of the World 1.08 1.54 2.15 2.40 2.91 3.03 3.09 186.1% Total 12.02 16.30 17.59 19.07 20.50 20.90 21.31 77.3%
Including Russia and Central and Eastern European countries outside the EU-27. Rest of the world: Largely estimated and adjusted from 2009 to take account of dynamic growth in the southern hemisphere.
Source: G. P. Wild (International) Limited from CLIA, IRN and other sources.
Over the ten years from 2003 to 2013 demand for cruising worldwide has increased from 12.0 million passengers to 21.3 million (+77%) with 2.0% growth achieved in 2013. Over a similar period, global tourist arrivals, mainly land-based tourism, has risen by around 57% to an estimated 1.087 billion tourists in 2013.3 The UNWTO reports that 5% of global tourists arrived at their destination by water, cruise and ferry in 2013.4
Since 2003 passengers sourced from North America have increased by 44% and the region remains the dominant source market. Coinciding with the strong global growth has been the emergence of new source and destination markets. As a result of the emergence of these new markets, North America’s share of the global cruise market has moved to 55.5% in 2013. At the same time Europe’s share has risen from 22.5% in 2003 to 30.0% in 2013 while the share of the Rest of the World rose from 9.0% to 14.5% over the 10-year period.
As an illustration of the dynamic and shifting pattern of growth in the global cruise industry, from 2003 to 2008, passengers sourced from Europe increased by 65% while those sourced from the Rest of the World increased by 43%. Over the next five years, Europe’s growth slowed to 43% while growth in the Rest of the World rose to 101%.
.
3 Source: World Tourism Organization (UNWTO)
4 UNWTO Tourism Highlights, 2014 Edition.
7. CLIA 2013 Global Economic Impact Study
Business Research and Economic Advisors Page 6 September 2014
Not surprisingly, the capacity deployed by the cruise industry, as measured by bed days5, has followed a similar growth and distribution profile. Overall, the global supply of bed days has increased by 84.2% from 2003 through 2013, increasing from 73 million bed days to 134.5 million (see Table 3).
Table 3–Global Deployment of Capacity, 2003 to 2013
Millions of bed days Region 2003 2008 2009 2010 2011 2012 2013 10-Year Growth Caribbean
35.1
36.9
39.1
46.2
45.5
48.0
48.1
37.0% Other North America 14.4 20.0 17.7 16.5 16.6 16.0 15.0 -4.4% North America 49.5 56.9 56.8 62.7 62.1 64.0 63.1 27.4% Northern Europe
4.5
8.0
10.2
9.7
11.4
13.2
13.9
209.0% Mediterranean 13.7 27.8 29.4 31.7 38.1 35.5 35.7 160.6% Europe 18.2 35.8 39.6 41.4 49.5 48.7 49.6 172.5% North America + Europe 67.7 92.7 96.4 104.1 111.6 112.7 112.7 66.5% Rest of the World
5.3
11.3
13.2
13.8
15.1
20.7
21.8
296.4% Total 73.0 104.0 109.6 117.9 126.7 133.4 134.5 84.2%
Source: CLIA and G. P. Wild (International) Limited.
The Caribbean is the principal cruise destination for passengers sourced from North America. While its share of the cruise industry’s global deployment has fallen from 48% in 2003 to 36% in 2013, it still remains the largest destination market with 48.1 million bed days de- ployed in the region during 2013. As shown in Table 3, this is a 37% increase over the ten- year period.
Europe, as a whole, has seen bed day capacity increase by 172% over the 10-year period, rising from 18.2 million bed days to 49.6 million. Overall, the growth in Northern Europe has been stronger than that in the Mediterranean as a result of an actual decline in deployed ca- pacity in the Mediterranean in 2012 and 2013. As a consequence European capacity has in- creased from about half of that deployed in the Caribbean in 2003 to 103% of Caribbean ca- pacity in 2013. Now, the Caribbean and Europe account for more than 70% of the global ca- pacity of the cruise industry.
Driven by strong growth in Australasia, the Rest of the World has seen bed day capacity in- crease by nearly 300% since 2003. With 21.8 million bed days deployed in the Rest of the World, it accounted for 16% the cruise industry’s global capacity in 2013, up from 7% in 2003.
5 Passenger bed days are the number of days that all berths could be occupied at 100% occupancy. For example, a cruise ship with 2,000 lower berths on a 7-day cruise generates 14,000 potential bed days.
8. CLIA 2013 Global Economic Impact Study
Business Research and Economic Advisors Page 7 September 2014
Thus, the cruise industry is truly a global industry with passengers sourced from around the world and with cruise itineraries destined for countries and ports around the globe. It is also a dynamic industry with overall global growth rates exceeding that of land-based tourism over the past ten years. The dynamism also carries over to the geographic distribution of growth which has shifted from North America, to Europe and now to Australasia. As a result, the industry impacts the global economy generating jobs, income and tax revenues in all re- gions of the world.
9. CLIA 2013 Global Economic Impact Study
Business Research and Economic Advisors Page 8 September 2014
Source Markets: Where do cruise passengers reside?
As discussed in the Introduction, cruise passengers are sourced from around the world. In this section, we focus on the global distribution for 2013. As shown in Figure 1, North Amer- ica accounted for 55% of all cruise passengers with 11.82 million passengers. Europe was next with 30% and 6.40 million passenger and the Rest of the World accounted for the re- maining 15% with 3.09 million passengers. The potential for growth in the Rest of the World is illustrated by the fact that it accounts for about nearly 85% of the world’s population6 and only 15% of world cruisers.
Figure 1 – Global Distribution of Cruise Passengers by Source Market – 2013
Millions of passengers
Source: G. P. Wild (International) Limited from CLIA, IRN and other sources.
North America
Within North America, the 10.92 million passengers sourced from the United States ac- counted for 92% of the market’s cruise passengers (see Figure 2). Canada accounted for 7% with 770,000 passengers while the remaining 1% resided elsewhere in North America. The largest of these other North American source markets are: Mexico, Panama, Bermuda and Barbados.
In addition to being the largest source market, North America is also the largest originator of cruises. During 2013, more than 4,000 cruises originated from ports throughout North Amer- ica carrying an estimated 10.94 million passengers. Thus passenger embarkations in North America accounted for 51% of global cruise passengers. The five largest cruise ports, Miami,
6 Population Reference Bureau, 2013 World Population Data Sheet, 2014.
North America11.82 55%
Europe6.40 30%
Rest of World 3.09 15%
10. CLIA 2013 Global Economic Impact Study
Business Research and Economic Advisors Page 9 September 2014
Port Everglades, Port Canaveral, Galveston and New York, accounted for 62% of the passen- ger embarkations in North America with 6.77 million passengers.
Figure 2 –Distribution of Cruise Passengers Sourced from North America – 2013
Millions of passengers
Source: G. P. Wild (International) Limited from CLIA, IRN and other sources.
Note: Rest of North America consists of Mexico, Bermuda, Central America and the Caribbean.
Europe
As shown in Figure 3, the five largest source countries in Europe accounted for 83% of the passengers sourced from Europe in 2013. The cruise industry sourced about 1.7 million pas- sengers from both United Kingdom and Germany. Thus these two countries alone accounted for just over half (53%) of the passengers sourced from Europe. An additional 1.9 million passengers were sourced from Italy, France and Spain, 30% of European-sourced passengers.
Among the other European countries, four countries provided more than 100,000 cruise pas- sengers. These were Switzerland, Norway, Austria and the Netherlands. Combined 533,000 passengers were sourced from these four countries, about 8% of European sourced passen- gers. Finally, another 584,000 cruise passengers were sourced from the remaining European countries, 9% of European-sourced passengers.
With 6.4 million passengers being sourced from Europe, an estimated 6.1 million passengers embarked on their cruise from European ports. Thus, a significant number of Europeans board cruises outside Europe. Among the top non-European cruise destinations for European residents are: the Caribbean, Bermuda and the U.S./Canada. The top ten European home ports include: Southampton, Barcelona, Venice, Civitavecchia, Savona, Genoa, Hamburg, Palma Majorca, Copenhagen and Marseille. More than 200,000 passengers embarked on
United States10.92 92%
Canada0.77 7%
Rest of North America0.13 1%
11. CLIA 2013 Global Economic Impact Study
Business Research and Economic Advisors Page 10 September 2014
cruises from each of these ports. Combined these ten ports accounted for nearly 75% of all European embarkations.
Figure 3 –Distribution of Cruise Passengers Sourced from Europe – 2013
Millions of passengers
Note: United Kingdom includes Ireland
Source: G. P. Wild (International) Limited from CLIA, IRN and other sources.
Rest of the World
As shown in Figure 4, the three principal source countries in the Rest of the World are Aus- tralia with 833,000 passengers, Brazil with 732,000 passengers and China with 727,000 pas- sengers. Combined these three countries accounted for 74% of all passengers sourced from the Rest of the World. The next four countries, South Africa, Argentina, Japan and Singapore accounted for 21% of the passengers sourced from the Rest of the World. A total of 650,000 passengers were estimated to have been sourced from these countries during 2013. Finally, an estimated 148,000 passengers were estimated to have been sourced from other countries, 5% of the passengers sourced from the Rest of the World.
12. CLIA 2013 Global Economic Impact Study
Business Research and Economic Advisors Page 11 September 2014
Figure 4 –Distribution of Cruise Passengers Sourced from the Rest of the World – 2013
Source: G. P. Wild (International) Limited from CLIA, IRN and other sources.
Top Ten Countries
In summary, a total of 19.3 million passengers were sourced from the top ten countries, 90% of global cruise passengers. As indicated in Figure 5, these countries are located in all major global regions.
Figure 5 –Cruise Passengers Sourced from the Top 10 Countries - 2013
Source: G. P. Wild (International) Limited from CLIA, IRN and other sources.
Australia833,00027%
Brazil732,00024%
China727,00023%
South Africa203,0007%
Argentina194,0006%
Japan145,0005%
Singapore108,0003%
Other148,0005%
10.92
1.73
1.69
0.87
0.83
0.77
0.73
0.73
0.52
0.48
0.0
2.0
4.0
6.0
8.0
10.0
12.0
Millions
13. CLIA 2013 Global Economic Impact Study
Business Research and Economic Advisors Page 12 September 2014
The United States with 10.92 million passengers was the largest source country by far ac- counting for just over half (51%) of global cruise passengers The next two countries, the United Kingdom and Germany, accounted for 16% of global passengers. About 1.7 million passengers were sourced from each of these countries. Between 800,000 and 900,000 pas- sengers were sourced from the next two countries, Italy and Australia. Combined, these two countries accounted for 8% of global passengers with 1.7 million passengers sourced from the two countries. Thus, the top five countries, located in North America, Europe and Austral- asia, accounted for 75% of global passengers.
Around 750,000 passengers each were sourced from Canada, Brazil and China during 2013. Cruise lines also sourced approximately 500,000 passengers from both France and Spain.
14. CLIA 2013 Global Economic Impact Study
Business Research and Economic Advisors Page 13 September 2014
Destination Markets: Where are cruise ships deployed?
As discussed in the Introduction, cruise lines deploy their ships around the globe. In this sec- tion, we focus on the global distribution of bed day capacity for 2013. As shown in Figure 6, North America accounted for 47% of the global bed day capacity with 63.1 million bed days. Europe was next with 37% and 47.6 million bed days. The Asia/Pacific region came in with 13.5 million bed days, 10% of the global capacity and the Rest of the World accounted for the remaining 6% with 8.3 million bed days.
Figure 6 – Global Distribution of Passenger Bed Days – 2013
Millions of bed days
Source: CLIA and G. P. Wild (International) Limited.
North America accounted for a smaller share of global capacity than global passengers, 47% versus 55%. Europe, on the other hand accounted for a larger share of capacity than passen- gers, 37% versus 30% while the Rest of the World, including Asia/Pacific, had about equal shares for capacity and passengers, 16% and 15%.
North America
Within North America, the Caribbean, with 48.1 million bed days, accounted for more than three-fourths (76%) of the capacity deployed in the market (see Figure 7). Alaska was the next largest region with 6.3 million bed days or 10% of the capacity in the market. Combined, Hawaii and Mexico West (ports on Mexico’s Pacific coast) accounted for 8% of the North American capacity with 5.0 million bed days. Finally, cruise lines deployed 3.7 million bed days among destinations in Canada, and the Atlantic coast of the United States, 6% of the capacity deployed in North America.
North America63.147%
Europe49.637%
Asia/Pacific13.510%
Rest of the World8.36%
15. CLIA 2013 Global Economic Impact Study
Business Research and Economic Advisors Page 14 September 2014
Figure 7 –Distribution of Passenger Bed Days in North America – 2013
Millions of bed days
Source: CLIA and G. P. Wild (International) Limited.
Notes: East Coast America includes Canada/New England and Bermuda. The Caribbean includes the Baha- mas, U.S. and Mexican ports on the Caribbean and Transcanal (Panama) cruises.
Data published by the Caribbean Tourism Organization (CTO)7 showed that seven Caribbean destinations had passenger arrivals8 in excess of one million passengers during 2013. These were: the Bahamas (4.71 million), Cozumel (2.75 million), U.S. Virgin Islands (2.0 million), St. Maarten (1.78 million), the Cayman Islands (1.38 million), Jamaica (1.29 million) and Puerto Rico (1.18 million). Combined these seven destinations accounted for about 70% of the 22 million cruise passenger arrivals reported for the 23 destinations covered in the CTO report.
Within the United States, BREA has reported that 9.96 million passengers embarked on their cruises from U.S. ports (excludes San Juan, PR) while 5.4 million passengers visited U.S. ports as transit passengers. As noted previously the five largest embarkation ports in the U.S. dur- ing 2013 were: Miami (2.02 million), Port Everglades (1.85 million), Port Canaveral (1.70 million), Galveston (.61 million) and New York (.63 million). Thus these five ports accounted for 68% of embarkations among all U.S. ports.
The major transit ports were the Alaska ports of Juneau (992,000), Ketchikan (955,000) and Skagway (824,000) and the Florida ports of Key West (765,000) and Port Canaveral (370,000). These five ports accounted for about 72% of all passenger arrivals at U.S. transit ports.
7 Caribbean Tourism Organization, Latest Statistics 2013, June 26, 2014
8 Passenger arrivals are the number of passengers on cruise ships that arrive at destination ports. Since not all passengers will disembark at a given port, passenger arrivals are larger than passenger onshore visits.
Caribbean48.176%
Alaska6.310%
Hawaii and Mexico West5.08%
East Coast America3.76%
16. CLIA 2013 Global Economic Impact Study
Business Research and Economic Advisors Page 15 September 2014
In Canada the principal home ports were Vancouver, Montreal and Quebec. Vancouver, along with Seattle, is a major home port for Alaska cruises and handled more than 625,000 passen- gers while the two ports along the St. Lawrence handled nearly 175,000 home port and transit port passengers. Finally, the ports of Atlantic Canada handled about 660,000 passen- gers during 2013.
Europe
Within Europe the Mediterranean accounted for 72% of the capacity deployed in Europe dur- ing 2013 with 35.7 million bed days (see Figure 8). The Mediterranean is a fairly self-con- tained market with most cruise originating and terminating within the region. As noted pre- viously the major home ports in the Mediterranean are Barcelona, Civitavecchia, Venice and Piraeus (Athens). Major destination or transit ports include Marseille, Naples, Dubrovnik, Santorini, Corfu and Livorno.
Figure 8 –Distribution of Passenger Bed Days in Europe – 2013
Millions of bed days
Source: CLIA and G. P. Wild (International) Limited.
Notes: The Mediterranean includes the Atlantic Isles while Northern Europe includes the Black Sea.
Cruise lines also deployed an estimated 13.9 million bed days in Northern Europe. Like the Mediterranean, most cruises originate and terminate within the region. The principal home ports are Southampton, Copenhagen and Hamburg. Major cruise destinations in Northern Europe include Lisbon, St. Petersburg, Tallinn, Cadiz, Stockholm and Rostock/Warnemunde.
Asia/Pacific
As noted previously the Asia/Pacific destination market accounted for 10% of the cruise in- dustry’s global bed day capacity. As shown in Figure 9, the Australia/South Pacific region
Mediterranean35.772%
Northern Europe13.928%
17. CLIA 2013 Global Economic Impact Study
Business Research and Economic Advisors Page 16 September 2014
accounted for about half (49%) of the capacity deployed in this market with 6.6 million bed days. Sydney serves as the primary homeport in the region with cruises primarily destined for New Zealand and South Pacific destinations as well as other Australian ports.
Figure 9 –Distribution of Passenger Bed Days in Asia/Pacific – 2013
Millions of bed days
Source: CLIA and G. P. Wild (International) Limited.
Notes: Southeast Asia includes Singapore, Indonesia, Malaysia, Thailand and Vietnam among others. Far East includes China, Japan, Hong Kong and others.
The Far East region, led by China, accounted for one-third of the capacity deployed in the market with 4.4 million bed days. This was followed by Southeast Asia with 18% of the ca- pacity in the market and 2.5 million bed days. Most cruises in this region originate in Singa- pore with calls at destinations in Indonesia, Malaysia, Thailand and Vietnam.
Rest of the World
The Rest of the World accounted for 6% of the cruise industry’s global capacity with 8.3 mil- lion bed days. South America was the largest region within this destination market with 5.2 million bed days, 63% of the market’s capacity. Brazil and Argentina are the largest destina- tions within this region. Another 2.8 million bed days were deployed in the Indian Ocean re- gion, 34% of the market’s capacity. Finally about 300,000 bed days were deployed elsewhere in the world primarily for transatlantic and global cruises.
Southeast Asia2.518%
Far East4.433%
Australia/South Pacific6.649%
18. CLIA 2013 Global Economic Impact Study
Business Research and Economic Advisors Page 17 September 2014
Figure 10 –Distribution of Passenger Bed Days in the Rest of the World – 2013
Millions of bed days
Source: CLIA and G. P. Wild (International) Limited.
Notes: The Indian Ocean includes cruises in the Red Sea, the Middle East and to South Africa.
South America5.263%
Indian Ocean2.834%
Oher0.33%
19. CLIA 2013 Global Economic Impact Study
Business Research and Economic Advisors Page 18 September 2014
Passenger and Crew Onshore Visits
As shown in Table 4, the cruise industry generated nearly 115 million passenger and crew visit days at ports around the globe. These consisted of 21.32 million passenger embarka- tions, 71.8 million transit passenger visit days and 21.75 million crew visit days. European ports accounted for 36% of these while ports throughout North America accounted for 51% of global passenger and crew visit days.
Table 4–Passenger and Crew Onshore Visits – Global and Regional Markets – 2013
Millions of Visit Days Category Global Regional Markets United States① Rest of North America② Europe (EU+3)③ Australia④ Rest of World⑤ Passenger Embarkations 21.31 9.96 1.39 6.05 1.23 2.68 Transit Passengers 71.80 5.44 30.40 28.66 0.72 6.58 Crew 21.75 6.55 5.08 6.15 0.29 3.68 Total 114.86 21.95 36.87 40.86 2.24 12.94
① United States consists of all US ports including those in Alaska and Hawaii.
② Rest of North America consists of ports in Bermuda, Canada, the Caribbean, Central America and Mex- ico.
③Europe EU+3 includes the ports of the 27 member states of the EU plus Iceland, Norway and Switzer- land.
④ Australia consists solely of the ports in Australia.
⑤ Rest of the World consists of ports in South America, Asia and the South Pacific, excluding Australia.
Of the 21.31 million cruise passengers sourced from around the world, 9.96 million, 47%, embarked on their cruise from a port in the United States. Of these 62% boarded cruises from Florida’s five cruise ports, Miami, Port Everglades, Port Canaveral, Tampa and Jacksonville. Another 1.39 million passengers, 6% of the global total, embarked on cruises from other ports in North America. The principal embarkation ports were San Juan in the Caribbean and Van- couver in Canada. Combined these two ports accounted for nearly 75% of embarkations at the other ports in North America.
European ports with 6.05 million passenger embarkations accounted for another 28% global passenger embarkations. The major embarkation ports in Europe included Barcelona, Civi- tavecchia, Venice and Piraeus (Athens) in the Mediterranean and Southampton, Copenhagen and Hamburg in northern Europe. Combined, these seven ports accounted for more than half of the passenger embarkations in Europe.
A total of 1.23 million passengers embarked on cruises at Australian ports, 6% of the total. Sydney accounted for 82% of these. Finally, the ports in the remaining regions (Rest of the World) generated 2.68 million passenger embarkations, 13% of the total.
20. CLIA 2013 Global Economic Impact Study
Business Research and Economic Advisors Page 19 September 2014
An analysis of global cruise itineraries and passenger arrivals indicated that the average length of a cruise was approximately seven days. On a seven day itinerary, the typical cruise ship made between three and four calls in addition to the home port call. Thus, the 21.32 million cruise passenger embarkations generated another 71.8 million visit days at transit calls at ports around the globe.
The ports of the Rest of North America accounted for the largest share at 42% with 30.4 mil- lion visit days. The Caribbean, including Mexico and Central America accounted for 82% of these visit days. Europe was next with 28.66 million visit days, 40% of the total. Europe’s major transit ports included Barcelona, Civitavecchia, Dubrovnik, Naples and Piraeus in the Mediterranean and St. Petersburg, Lisbon, Tallinn, Stockholm and Bergen. Combined, these ten ports accounted for about one-third of transit visit days throughout Europe. The ports of the United States generated 5.44 million transit passenger visit days, 8% of the total. The principal transit ports in the United States are located in Alaska, Hawaii and Florida. Since Australia is principally a source market for cruises to the South Pacific, Australian ports gen- erated only 720,000 transit passenger visits days, 1% of the total. In contrast, the ports else- where in the world are predominantly transit ports and thus accounted for 9% of global transit visit days with 6.58 million days.
Finally crew onboard cruise ships also disembark and visit in both home and transit ports. Based upon data collected as part of regional and port specific cruise studies, BREA has esti- mated that between 40% and 45% of crew disembark at each port call. Thus, on a global basis cruises generated an estimated 21.75 million crew visit days.
The ports of the United States and Europe generated 6.55 million and 6.15 million crew visits days, respectively. Combined this accounted for 58% of global crew visit days. The Rest of North America and the Rest of the World generated 5.08 million and 3.68 million crew visit days while Australia generated the remaining 290,000 crew visit days.
21. CLIA 2013 Global Economic Impact Study
Business Research and Economic Advisors Page 20 September 2014
Direct Expenditures Generated by Cruise Tourism
The direct expenditures generated by cruise tourism were analyzed for three segments: i) cruise passengers, ii) crew members and iii) cruise lines. Passengers purchased pre- and post-cruise vacations, shore excursions, souvenirs and other retail goods while crew pur- chased a similar set of goods and services with a heavier concentration on retail goods. In addition, cruise lines purchased a variety of goods in support of their cruise operations, in- cluding food and beverages, hotel supplies, bunker fuel, and utilities while in port. Cruise lines also made payments for a variety of services in support of their global cruise operations, in- cluding travel agent commissions, expenditures for advertising and promotion and other pro- fessional and business services. As shown in Table 5, the estimated direct global spending by passengers, crew and cruise lines totaled $52.31 billion during 2013.
Table 5–Direct Cruise Sector Expenditures – Global and Regional Markets – 2013
Billions of US$ Category Global Regional Markets United States Rest of North America Europe (EU+3) Australia Rest of World Home Port Passengers $ 6.74 $ 2.63 $ 0.69 $ 2.32 $ 0.58 $ 0.52 Transit Passengers $ 6.61 $ 0.70 $ 2.38 $ 2.54 $ 0.12 $ 0.87 Passenger Total
$13.35
$ 3.33
$ 3.07
$ 4.86
$ 0.70
$ 1.39 Crew $ 1.23 $ 0.30 $ 0.48 $ 0.19 $ 0.03 $ 0.23 Cruise Lines① $37.73 $16.47 $ 1.18 $16.15 $ 0.99 $ 2.94 Total $52.31 $20.10 $ 4.73 $21.20 $ 1.72 $ 4.56
① Expenditures by cruise lines consists of purchases of goods consumed and used on ships, port charges and fees, travel agent commissions, administrative expenses and wages paid to shore side employees and crew among others.
On a global basis, passengers spent an estimated $13.35 billion during home and transit port calls, accounting for 26% of total cruise sector direct expenditures. Crew spent another $1.23 billion, 2% of the total. Finally, cruise lines spent $37.73 billion on cruise operations, 72% of the total.
As shown in Table 6, passenger and crew expenditures were concentrated in three catego- ries, travel to home port, tours and local transit and retail and other. Combined these three categories accounted for 82% of the global expenditures of passengers and crew. On average $126.93 in expenditures was generated by each visit day.
22. CLIA 2013 Global Economic Impact Study
Business Research and Economic Advisors Page 21 September 2014
Table 6–Global Passenger and Crew Spending by Category – 2013
Millions of US$ Categories Total Home Port Passengers Transit Passengers Crew Visit Days (Millions) 114.86 21.31 71.80 21.75 Accommodations $ 1,014 $1,014 -- -- Travel to Home Port $ 3,841 $3,841 -- -- Food & Beverages
$ 1,600
$ 541
$ 758
$ 301 Tours & Local Transit $ 3,445 $ 477 $2,779 $ 189 Retail & Other $ 4,679 $ 867 $3,069 $ 743 Total $14,579 $ 6,740 $ 6,606 $ 1,233 Average Spend per Visit $126.93 $316.28 $ 92.00 $ 56.69
On a regional basis, the United States and Europe had similar direct expenditure totals, $20.1 and $21.2 billion, respectively. Thus, each market accounted for about 40% of global direct expenditures. Since the U.S. serves primarily has a source market for cruises to the Rest of North America, expenditures by home port passengers account for 72% of passenger and crew spending in the United States. In Europe, on the other hand, cruises originate and make port calls within the European market. As a result, expenditures by home and transit port passengers were nearly identical, $2.32 and $2.54 billion.
Expenditures by cruise lines were also similar in both the United States and Europe, $16.47 billion in the U.S. and $16.15 billion in Europe. The key difference is that shipbuilding, includ- ing maintenance and refurbishment, accounted for one-third of the expenditures by cruise lines in Europe and only 6% in the United States.
As alluded to above, the Rest of North America is principally a destination market for cruises originating in the United States. As a result, expenditures by transit passengers, $2.38 billion, accounted for 67% of all passenger and crew spending in the region. The $1.18 billion in cruise line spending in the Rest of North America was largely concentrated in Canada which accounted for about 25% of the total spending in the region. In total, the $4.73 billion in direct cruise sector expenditures in the Rest of North America accounted for 9% of global direct spending.
The $4.56 billion in direct expenditures in the Rest of the World were similar to those in the Rest of North America. However, spending by cruise lines accounted for 64% of the expendi- tures in this region versus 25% in the Rest of North America. This is primarily due to the presence of cruise line headquarters and the construction and refurbishment of ships in Asia.
23. CLIA 2013 Global Economic Impact Study
Business Research and Economic Advisors Page 22 September 2014
Finally, Australia accounted for 3% of global direct expenditures with $1.72 billion. Spending by passengers and crew accounted for 42% of the regional total with $0.73 billion in expend- itures while cruise lines accounted for the remaining 58% with nearly $1.0 billion in expend- itures.
24. CLIA 2013 Global Economic Impact Study
Business Research and Economic Advisors Page 23 September 2014
Economic Contribution Generated by Cruise Tourism in 2013
The objective of this analysis is to quantify the contribution of the spending generated by cruise tourism to the global economy during 2013. The quantification consists of the meas- urement of the direct expenditures and the resulting impacts on output, employment and income. The contribution analysis consists of three elements: i) the direct economic contri- bution, ii) the indirect economic contribution and the iii) the induced economic contribution.
The direct expenditures generated by the cruise industry and its passengers and crew that were quantified and discussed in the previous section, are the driving force of the industry’s contribution to the global economy. These expenditures generate direct employment and employee income in support of providing the goods and services purchased by the cruise lines and their passengers and crew.
The indirect contribution results from the subsequent demand for goods and services gener- ated by the directly impacted businesses. For example, food processors must purchase raw foodstuffs for processing; utility services, such as electricity and water, to run equipment and process raw materials; transportation services to deliver finished products to the cruise lines or wholesalers; and insurance for property and employees.
The induced contribution is generated by the spending of the employees of the cruise lines and their suppliers. The income of these employees is used to purchase a broad range of consumer goods and services including such goods as autos, food, clothing, furniture, health care and so forth. As a consequence, the induced contribution is concentrated in the final de- mand for final goods produced for the household sector.
As discussed in the Introduction, the estimates of the global direct, indirect and induced con- tribution are the sum of the impacts estimated for the regional markets. The regional esti- mates for 2013 are taken directly from published economic impact studies for 2013, extrap- olated impacts for regions where studies were conducted in the past two years and estimates developed by BREA for those regions where recent economic impact data are unavailable.
Direct Economic Contribution
The $52.31 billion in global direct cruise tourism expenditures by themselves generated a significant contribution to the global economy. As shown in Table 7, these direct expendi- tures generated 417,979 FTE jobs paying $16.47 billion in employee income, including the shore side employees and crew of cruise lines.
25. CLIA 2013 Global Economic Impact Study
Business Research and Economic Advisors Page 24 September 2014
Table 7–Direct Cruise Sector Economic Contribution – Global and Regional Markets – 2013
Billions of US$ Category Global Regional Markets United States Rest of North America Europe (EU+3) Australia Rest of World Output ($ Billion) $52.31 $20.10 $ 4.73 $21.20 $ 1.72 $ 4.56 Share of Global 38.5% 9.0% 40.5% 3.3% 8.7% Income ($ Billion)
$16.47
$ 6.63
$ 1.08
$ 6.60
$ 0.56
$ 1.60 Share of Global 40.2% 6.6% 40.1% 3.4% 9.7% Employment
417,979
147,898
51,188
164,804
8,378
45,711 Share of Global 35.4% 12.2% 39.5% 2.0% 10.9%
The table also shows the regional distribution of the direct economic contribution. Europe has the largest direct economic contribution accounting for about 40% of the global direct contribution of the cruise industry. The $21.2 billion in direct expenditures generated 164,804 FTE jobs paying an estimated $6.6 billion in employee income. As noted previously Europe’s shipbuilding industry represents a significant component, about 15%, of the direct economic contribution of the cruise industry in Europe.
The share of the direct contribution in the United States was just slightly lower, just under 40%. The $20.1 billion in direct expenditures generated an estimated 147,898 FTE jobs pay- ing $6.63 billion in employee income. Given the significant headquarters and home port op- erations in the U.S., the direct economic contribution is heavily weighted toward those indus- tries that supply goods and services to the cruise ships, i.e., cruise ports, suppliers of food and beverages, fuel and equipment, and administrative support services such as, advertising, ac- counting and professional services and transportation services, including travel agents.
Elsewhere in North America, the cruise industry’s direct expenditures of $4.73 billion gener- ated 51,188 FTE jobs paying $1.08 billion in employee income. The share of the global eco- nomic contribution in this region ranged from 6.6% for the income contribution to 12.2% for the employment impact. The impacts in this region are largely generated by passenger and crew spending which accounted for 75% of the direct expenditures. Because these impacts primarily affect the retail trade and tour sectors, which have relatively low wages and produc- tivity, the share of the employee income impact is lower than the share of the employment impact.
Australia accounted for 3.3% of the direct spending impacts and 3.4% and 2.0% of the global income and employment contribution with $1.72 billion in direct expenditures generating 8,378 FTE jobs paying $0.56 billion in employee income. In Australia, as in the United States,
26. CLIA 2013 Global Economic Impact Study
Business Research and Economic Advisors Page 25 September 2014
cruise line spending accounted for the majority of the direct contribution and as a result im- pacted the higher wage and productivity industries. Thus, the share of the income contribu- tion was higher than the share of the employment contribution.
Finally, the direct expenditures of $4.56 billion in the Rest of the World generated 45,711 FTE jobs paying $1.60 billion in employee income. The share of the global contribution ranged from 8.7% for the direct expenditures to 10.9% for employment.
Indirect and Induced Economic Contribution
As discussed previously, the indirect and induced contributions are generated by the spend- ing of the directly impacted businesses and their employees. As a consequence, these impacts spread throughout the global and regional economies. The specific indirect and induced im- pacts are determined by the structure of the individual economies and as a result can vary significantly from region to region. As shown in Table 8, the $52.31 billion in direct cruise tourism expenditures generated an additional $64.84 billion in indirect and induced output, $22.0 billion in employee income and 473,030 FTE jobs.
Table 8–Indirect and Induced Cruise Sector Economic Impact – Global and Regional Markets – 2013
Billions of US$ Category Global Regional Markets United States Rest of North America Europe (EU+3) Australia Rest of World Output ($ Billion) $64.84 $23.99 $ 4.26 $31.08 $ 1.39 $ 4.12 Share of Global 37.1% 6.6% 47.9% 2.1% 6.3% Income ($ Billion) $22.00 $11.64 $ 0.93 $ 7.34 $ 0.35 $ 1.74 Share of Global 52.9% 4.2% 33.4% 1.6% 7.9% Employment
473,030
215,235
39,610
174,613
5,590
37,982 Share of Global 45.5% 8.4% 36.9% 1.2% 8.0%
Combined, the United States and Europe accounted for about 85% of the global direct and induced contribution. While Europe accounted for a larger percentage of the global output contribution than the U.S., the United States accounted for a larger percentage of the global employment and income contribution. The Rest of North America and the Rest of the World each accounted for between 6% and 8% of the global indirect and induced economic contri- bution with Australia accounting for between 1% and 2% of the global indirect and induced economic contribution.
27. CLIA 2013 Global Economic Impact Study
Business Research and Economic Advisors Page 26 September 2014
Total Economic Contribution
Combining the direct, indirect and induced contributions, cruise tourism generated an esti- mated $117.15 billion in total output of goods and services throughout the global economy during 2013. As a result of the production of this output, 891,009 FTE jobs were required. The workers who were employed in these jobs were paid $38.47 billion in income (see Table 9).
Table 9–Total Cruise Sector Economic Contribution – Global and Regional Markets – 2013
Billions of US$ Category Global Regional Markets United States Rest of North America Europe (EU+3) Australia Rest of World Output ($ Billion) $117.15 $44.09 $ 8.99 $52.28 $ 3.11 $ 8.68 Share of Global 37.5% 7.7% 44.5% 2.7% 7.6% Income ($ Billion) $38.47 $18.27 $ 2.01 $13.94 $ 0.91 $ 3.34 Share of Global 47.5% 5.2% 36.2% 2.4% 8.7% Employment
891,009
363,133
90,798
339,417
13,968
83,693 Share of Global 40.8% 10.2% 38.1% 1.6% 9.3%
The table also shows the regional distribution of the direct economic contribution. Europe has the largest total output contribution of $52.28 billion and accounted for about 45% of the total global output contribution of the cruise industry. This output resulted in employment of 339,417 FTE workers paying an estimated $13.94 billion in employee income. The employ- ment and income contribution were second behind the United States and accounted for 36% and 38% of the total global income and employment contribution, respectively.
The total output contribution in the United States was $44.09 billion, 37.5% of the total global output contribution. The $44.09 billion in total output generated an estimated 363,133 FTE jobs paying $18.27 billion in employee income. As noted above the employment and income contributions were the highest among the five regional markets and accounted for 47.5% and 40.8% of the total global income and employment contributions, respectively.
Elsewhere in North America, the cruise industry’s total output contribution of $8.99 billion generated 90,798 FTE jobs paying $2.01 billion in employee income. The share of the global economic contribution in this region ranged from 5.2% for the income contribution to 10.2% for the employment impact. As noted previously, these impacts primarily affect the retail trade and tour sectors, which have relatively low wages and productivity, thus the share of the global employee income contribution is lower than the share of the employment contri- bution.
28. CLIA 2013 Global Economic Impact Study
Business Research and Economic Advisors Page 27 September 2014
Australia accounted for 2.7% of the total global output contribution and 2.4% and 1.6% of the global total income and employment contribution with $3.11 billion in total output gen- erating 13,968 FTE jobs paying $0.91 billion in employee income. As in the United States, total output impacted the higher wage and productivity industries. Thus, the share of the total in- come contribution was higher than the share of the total employment contribution.
Finally, the total output contribution of $8.68 billion in the Rest of the World generated 83,693 FTE jobs paying $3.34 billion in employee income. The share of the global contribu- tion ranged from 7.6% for the total output contribution to 9.3% for total employment contri- bution.