2. 2018
2017
2016
7,770
11,350 11,595
Funds from
operations◊
(US$ millon)
11,595
2018
2017
2016
0.10
0.41
0.24
Earnings per share
(basic)
(US$)
0.24
2018
2017
2016
7,868
11,866
13,210
Cash generated by
operating activities
before working capital
changes (US$ millon)
13,210
2018
2017
2016
3,930
8,459
9,143
Adjusted EBIT◊
(US$ million)
9,143
2018
2017
2016
33,218 33,934 34,994
Total borrowings
(US$ million)
34,994
2018
2017
2016
1,379
5,777
3,408
Net income
atttributable to
equity holders
(US$ million)
3,408
2018
2017
2016
15,526
14,710
Net debt/
FFO to net debt◊
(US$ millon/%)
14,710
0
30
60
90
120
10,216
FFO to net debt (%)
2018
2017
2016
10,268
14,545
15,767
Adjusted EBITDA◊
(US$ million)
15,767
Our strategy
for a sustainable
future
Page 16
Sustainability
Page 36
We are one of
the world’s largest
globally diversified
natural resource
companies, employing
around 158,000 people
in 150 mining and
metallurgical sites,
oil production assets
and agricultural
facilities around
the world.
Highlights
glencore.com
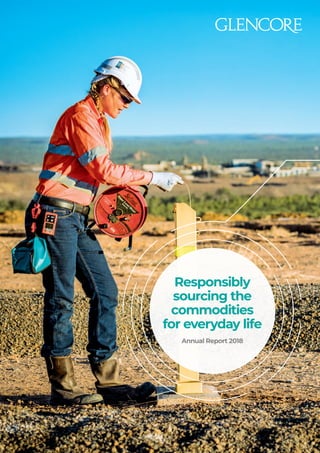
Front cover: Environmental Advisor Alinta Skewes
at Glencore’s McArthur River Mine, Australia.
3. 2018
2017
2016
1.40
1.02 1.06
Lost time injury
frequency rate
(LTIFR)
1.06
2018
2017
2016
23.1
11.9
21.6
11.6
18.5
11.8
Scope 1 Scope 2
Carbon emissions
(million tonnes CO2)
30.3
2018
2017
2016
84
90
95
Community
investment
(US$ millon)
95
Financial
review
Page 52
Strategic report
At a glance 2
Chief Executive Officer’s review 4
Well positioned for the future 8
Our market drivers 10
Business model 12
Our strategy for a sustainable future 16
Climate change – looking beyond 2020 20
Key performance indicators 22
Principal risks and uncertainties 24
Sustainability36
Financial review 52
Business review
– Metals and minerals 60
– Energy products 80
– Agricultural products 90
Corporate Governance
Directors and officers 94
Chairman’s introduction 96
Corporate governance report 98
Directors’ remuneration report 113
Directors’ report 118
Financial statements
Independent Auditor’s Report
to the members of Glencore plc 124
Consolidated statement of income 135
Consolidated statement of
comprehensive income 136
Consolidated statement of financial position 137
Consolidated statement of cash flows 138
Consolidated statement of changes of equity 140
Notes to the financial statements 141
Additional information
Alternative performance measures 214
Other reconciliations 219
Production by quarter – Q4 2017 to Q4 2018 221
Resources and reserves 228
Shareholder information 236
◊
Alternative performance measures
Adjusted measures referred to as
Alternative performance measures
(APMs) which are not defined or
specified under the requirements
of International Financial Reporting
Standards; refer to APMs section
on page 214 for definition and
reconciliations and note 2 of the
financial statements for reconciliation
of Adjusted EBIT/EBITDA.
Read more
Page 214
Contents
1
Glencore Annual Report 2018
4. 2018
2017
2016
2015
2014
1.60
1.34 1.40
Lost time injury
frequency rate
(per million
hours worked)
1.02 1.06
2018
2017
2016
2015
2014
5.02
4.35
4.05
Total recordable
injury frequency rate
(per million
hours worked)
3.08 3.18
2018
2017
2016
2015
2014
21.6
CO2e Scope 1
(million tonnes)
23.0 23.1
21.6
18.5
2018
2017
2016
2015
2014
21.6
CO2e Scope 1
(million tonnes)
23.0 23.1
21.6
18.5
2018
2017
2016
2015
2014
14.6
CO2 Scope 2 –
location based
(million tonnes)
14.3
11.9 11.6 11.8
2018
2017
2016
2015
2014
14.6
CO2 Scope 2 –
location based
(million tonnes)
14.3
11.9 11.6 11.8
At a glance
Metals and
minerals
Energy Agriculture
1
Exploration,
acquisition and
development
2
Extraction and
production
3
Processing
and refining
4
Blending and
optimisation
5
Logistics
and delivery
+90
commodities
3
business
segments
c.3,000
employees in marketing
40+
years’
experience
One of the world’s largest natural resource companies
50
countries
90
offices
c.158,000
people
150
sites
Three business segments
Active at every stage of the commodity chain
Focused on sustainability
Highly diversified With impressive market insight
$200m
to increase Collahuasi
copper concentrator
throughput capacity to
170ktpd. Commissioning
2021
We are one of the world’s largest
natural resource companies.
Active at every stage of the
commodity supply chain,
we are uniquely diversified
by geography, product and
activity, maximising the value
we create for our business
and its diverse stakeholders
Financial review
Page 52
Sustainability
Page 36
$170m
annual investment
2018–24 to secure
long-term production
at our Integrated
Nickel Operations
Glencore Annual Report 2018
2
5. 4
5
7
Adjusted EBITDA
2018 (%)◊
Non-current assets2
by region (%)
Revenue◊1
by region
and segment 2018 (%)
4
5
7
Key
Metal and minerals sites
Energy products sites
(Number of assets where grouped)
Agriculture sites
Corporate offices
Marketing office/other
• High-quality, low-cost
assets in desirable
commodities
• Entrepreneurial
culture: employees
empowered to
make decisions
• Long-term
relationships with
broad base of
suppliers and
customers
• Marketing business
less correlated to
commodity prices
• Maximum flexibility
and economies
of scale
Business segments
Metals and minerals
Energy
Agriculture
Regions
Americas
Asia
Europe
Africa
Oceania
1 Revenue by geographic destination is based on the country of incorporation of the sales counterparty.
However, this may not necessarily be the country of the counterparty’s ultimate parent and/or final
destination of the product, see note 2 of the financial statements.
2 Non-current assets are non-current assets excluding other investments, advances and loans and
deferred tax assets. The percentage contributions are derived from the information included in note 2
of the financial statements.
$1.2bn
in downstream oil
related investments
c.15Mtpa
increase in high
quality coal
production from
HVO and Hail
Creek acquisitions
$15.8bn
(2017: $14.6bn)
$78.0bn
(2017: $78.2bn)
Metal and minerals
$83.4bn
(2017: $80.5bn)
Energy products
$139.0bn
(2017: $128.3bn)
What makes
us different?
3
Glencore Annual Report 2018
Strategic
Report
Financial
statements
Governance
Additional
information
6. from sanctions imposed on
Dan Gertler, Katanga’s deliberations
with Gécamines over the required
recapitalisation of its main
operating subsidiary (see note 33),
a new mining code introduced in
2018 and the recent appearance
of excess levels of uranium in the
cobalt hydroxide being produced
at Katanga.
Katanga resolved the matter with
Gécamines in a constructive manner,
while after careful consideration of
its legal and commercial options and
obligations to a broad stakeholder
universe, Glencore settled its dispute
with the various entities affiliated
with Dan Gertler, in a manner that
sought to appropriately address all
applicable obligations and concerns.
In contravention of the applicable
stabilisation protections afforded by
the previous mining code, the new
mining code includes significant
immediate changes to royalties,
various taxation requirements and
repatriation of profits. Given the legal
risks of non-compliance, our DRC
subsidiaries are currently complying
with the new code “under protest”.
We hope to be able to negotiate a
reasonable resolution with the DRC
government on various key issues
during 2019, but remain willing to
take the necessary steps to protect
our legal rights.
In early July, a Glencore subsidiary
received a subpoena from the United
States Department of Justice (DOJ)
to produce documents and other
records with respect to compliance
with the Foreign Corrupt Practices
Act and United States money
laundering statutes. A committee
comprising only Independent
Non-Executive Directors, led by
our Chairman, Tony Hayward, is
overseeing the Company’s response
to the DOJ investigation. We take
ethics and compliance seriously
and are cooperating with the DOJ.
We have delivered both record Adjusted EBITDA
and significant cash returns to shareholders in 2018.
With our attractive commodities and high margin
assets, we look to the future with confidence
Chief Executive Officer’s review
A record performance in a
challenging environment
We are pleased to report that we
have delivered both record Adjusted
EBITDA and significant cash returns
to shareholders in 2018.
Reflecting the strength of our
uniquely diversified business model
and commitment of our people,
we achieved these results in a
challenging operating environment,
marked by deteriorating market
sentiment as well as some company
specific challenges.
The prospect of synchronised
global economic growth greeted
the start of 2018, supporting positive
commodity fundamentals and
prices. However, by the end of H1 and
into Q3, a strong US dollar, increased
volatility and heightened US trade
policy tension, began to weigh on
broader markets, with widespread
concern around sustainability of
Chinese growth also resurfacing.
Industrial metals bore the brunt
of increasingly negative sentiment
in the second half, although
average 2018 prices were generally
higher year-on-year, e.g. nickel
+26%, thermal coal +22% and copper
+6%. While most commodities
ended the year materially lower
than where they started, thermal
coal was broadly unchanged,
as demand for high quality coals
remained robust against a backdrop
of limited reinvestment in supply.
Notwithstanding the volatility in
commodity prices, like previous
years, underlying demand for
our key commodities remained
generally healthy throughout
the year.
The year also brought specific
challenges for Glencore,
commencing in the form of a
number of issues at our copper
and cobalt operations in the
Democratic Republic of Congo
(DRC), including those arising
Glencore Annual Report 2018
4
7. Commodity fundamentals
still positive
Post the peak in mining sector
capex some six years ago, sector
reinvestment has remained limited,
the growth capex pipeline has
contracted and the demand
backdrop has been solid.
This underpinned favourable
fundamentals for a number of our
key commodities, including copper,
nickel and thermal coal. In the case
of our key base metals, inventory
drawdowns have reduced stockpiles
to record lows in some instances.
As we move through 2019, should
market supply side data prove
correct, inventory drawdowns are
likely to continue beyond already
critical levels for some commodities,
in the absence of a material
demand slow-down.
Strong financial performance
Higher average commodity
prices in 2018 underpinned an
8% increase in Adjusted EBITDA
to $15.8 billion. Net income before
significant items rose 5% to $5.8 billion,
while significant items reduced
Net profit attributable to equity
holders to $3.4 billion, mainly due to
non-cash impairments of $1.6 billion,
primarily reflecting impairments
of the carrying values of our
Mutanda and Mopani assets.
Our performance reflects our
continuing efforts to maximise
and optimise the cash generating
capability of our unique business
model.
Our Marketing business reported
Adjusted EBIT of $2.4 billion, down
17% compared to 2017. Reasonable
market conditions in our Energy
Products and Metals and Minerals
businesses were hampered by a
“basis risk” hedging breakdown
related to alumina sourcing into
medium-term % LME linked legacy
sales contracts as well as cobalt
market challenges in H2 2018.
Looking ahead, we maintain our
long-term Marketing Adjusted EBIT
guidance range of $2.2 to $3.2 billion.
We are confident of an improved
year-over-year performance,
suggesting a 2019 result towards
the middle of our guidance range.
Industrial Adjusted EBITDA of
$13.3 billion in 2018 was 15% higher
than 2017. Our asset portfolio
continued to deliver overall
competitive all-in unit costs which,
despite some minor production
challenges during the year, allowed
the Company to capitalise on
healthy average commodity prices
and generate attractive margins.
Enhancing corporate
governance and sustainability
We recently established an Ethics,
Compliance and Culture committee
to provide oversight and leadership
of the Group’s key ethics, compliance,
culture and governance matters.
The new committee will assume
responsibility for implementing the
new Corporate Governance Code,
including, amongst other matters,
assessing and monitoring our
culture to ensure alignment with
our purpose, values and strategy.
We have continued to strengthen
our controls and made substantial
investments to enhance our
compliance programme across
the Group. In this regard, we were
disappointed by the conduct that
led to Katanga’s settlement with
the OSC. Glencore is working with
Katanga to implement the various
changes to improve its reporting
and control functions and to
address some cultural failures
that contributed to this conduct.
Our commitment to operate
transparently and responsibly
is reflected in our ambition to
integrate sustainability throughout
every aspect of our business.
This is a key strategic priority
for the Group.
Our commodities
underpin the
infrastructure and
chemistry needed
for a low-carbon world
We aim to prioritise capex
towards commodities
essential to the energy
and mobility transition
Our well positioned
portfolio includes
copper, cobalt, zinc,
vanadium and nickel
As one of the world’s
largest diversified
resource companies we
have a key role in enabling
the transition to a
low-carbon economy
Creating
long-term,
sustainable
returns for
shareholders:
We are committed to
enabling the transition
to a low-carbon economy
Page 20
5
Glencore Annual Report 2018
Strategic
Report
Financial
statements
Governance
Additional
information
8. Chief Executive Officer’s review continued
This commitment to sustainability
also encompasses our desire to
uphold respect for human rights,
protect the wellbeing of our people,
our host communities and the
natural environment, while sharing
lasting benefits with the regions
where we work and society as
a whole.
Sadly, we recorded thirteen fatalities
at our operations in 2018, an increase
on 2017. This is disappointing and
unacceptable. We have created
a new position with oversight and
responsibility for all of Glencore’s
industrial mining assets and have
appointed Peter Freyberg to this role.
Peter brings a wealth of operational
experience from his management
of our coal assets and will focus his
attention on co-ordinating our goals
of producing safely, productively
and sustainably. Our goal remains
one of zero fatalities.
We have also made progress on our
post-2020 climate change strategy.
Following consultation with the
investor signatories of the Climate
Action 100+ initiative, we have
agreed steps to further our
commitment to the transition
to a low-carbon economy.
As one of the world’s largest
diversified resource companies, we
have a key role to play in enabling
transition to a low-carbon economy.
We do this through our well-
positioned portfolio that includes
copper, cobalt, nickel, vanadium and
zinc – commodities that underpin
energy and mobility transformation.
We believe this transition is a
key part of the global response
to the increasing risks posed
by climate change, which must
pursue the twin objectives of both
limiting temperatures in line with
the goals of the Paris Agreement
and supporting the United Nations
Sustainable Development Goals,
including universal access to
affordable energy.
Conviction to create value
In 2018, we complemented
our portfolio with acquisitions
(and some non-core disposals)
designed to create long-term
value for shareholders, a number
of which were first announced
in 2017. These include:
• 49% of Rio Tinto’s Hunter
Valley Operations (thermal coal)
with Yancoal retaining 51%,
gaining access to sizeable high
quality energy coal resources,
operatorship and marketing rights
• 82% of Rio Tinto’s interest in
the Hail Creek mainly coking
coal mine
• 78% in ALE Combustiveis
(ALE), Brazil’s fourth largest
fuel distributor
• Chevron’s South African and
Botswana mid/down-stream oil
business (funded already in the
two-stage process, with final
ownership transfer expected
to Glencore in H1 2019)
• Non-core disposals during the
year included our Tahmoor coal
mine and our interest in the
Mototolo platinum operation
Both Hail Creek and HVO have
been successfully integrated into
our portfolio and we have identified
some $185 million of managed
annual cost savings/margin
improvements to be realised upon
completion of the restructure plans
at these assets. These low-cost
high-quality assets are expected
to play an important role within our
coal portfolio in the coming years.
Record shareholder cash returns
Reflecting the strength of our
operating cashflow, we announced
$5.2 billion of distributions and
buybacks in 2018, comprising a
$0.20 per share ($2.84 billion) base
distribution (in respect of 2017
cash flows), $0.32 billion of share
trust purchases and $2 billion
of share buy-backs.
Consistent with the continued
strong cash flow generation
seen in 2018, we are again
recommending to shareholders
a 2019 base distribution of $0.20
per share (~$2.8 billion), payable
in two equal instalments in 2019.
2018 announced
distributions
and buybacks
$5.2bn
Minimising our impact
on the environment
5%
reduction in carbon
emissions intensity
by 2020 vs 2016
Glencore Annual Report 2018
6
9. Strategic priorities
Integration of sustainability
throughout our business
Maintain a robust and
flexible balance sheet
Focus on cost control and
operational efficiencies
Management changes
and succession
2018 has also been a year of change
in the management of the Group,
notably with the retirement of two
of our longstanding Department
Heads, Telis Mistakidis in Copper
and Stuart Cutler in Ferroalloys,
resulting in the most meaningful
implementation of our development
and succession plans since our IPO.
Telis has been succeeded
by Nico Paraskevas and Stuart by
Jason Kluk and Ruan van Schalkwyk.
With Peter Freyberg’s appointment
to the role of Head of Industrial
Mining Assets, Gary Nagle replaces
Peter as Head of Coal Assets, while
Japie Fullard succeeds Gary as
Head of Ferroalloys assets.
We wish Telis and Stuart well in
their retirement. I look forward
to working with our new team
and colleagues in developing our
business in the coming years and
nurturing the next generation
of leadership at Glencore.
Looking forward
We look ahead with confidence,
remaining focused on creating
sustainable long-term value for
all our shareholders.
Ivan Glasenberg
Chief Executive Officer
28 February 2019
This payment comprises a fixed
$1 billion pay-out in respect of
Marketing activities and a variable
component of ~$1.8 billion,
representing ~35% of industrial
free cash, compared to our policy
minimum of 25%.
Near-term focus on deleveraging
and shareholder returns
The dislocation between our current
share price levels and the prospects,
strength and embedded optionality
in our business leads us to conclude
that it is difficult to find a better
investment than buying back
our own shares.
Outside of our base distribution
policy, for the balance of our
equity cash flows, we currently
envisage prioritising:
• Buybacks funded by cash
generation
• Net funding: focus on consistently
maintaining Readily Marketable
Inventories (RMI) at levels below
$20 billion
• Net debt: maintain in the
$10 billion–$16 billion guidance
range, while limiting Net debt/
Adjusted EBITDA to around 1x,
in the current uncertain
economic cycle backdrop
Reflecting this, and taking account
of the illustrative annualised free
cash that the business generates
at current spot commodity prices,
we announced on 20 February 2019
a new $2 billion buyback program,
which will run until the end of the
year. We will proactively look to top
this up (in August, or otherwise)
as market conditions support,
including automatically from
a targeted $1 billion of non-core
asset disposals in 2019, from
a range of candidate assets.
Our strategy for a
sustainable future
Page 16
7
Glencore Annual Report 2018
Strategic
Report
Financial
statements
Governance
Additional
information
10. ● Copper
● Zinc
● Nickel
● Ferroalloys
● Coal
● Oil
● Marketing
● Americas
● Europe/Asia
● Africa
● Oceania
● Marketing
We remain focused on our strategy to sustainably
grow total shareholder returns while operating
responsibly. We are confident we can offer
a differentiated value proposition to investors
Well positioned for the future
Uniquely
diversified by
commodity,
geography
and activity
The right
commodity mix
for changing
needs
Well-capitalised,
low-cost, high-
return assets
• Fully integrated from
mine to customer
• Presence in 50 countries
across 150 operating sites
• Producing and marketing
more than 90 commodities
across three business
segments
• Diversified across multiple
suppliers and customers
• Future demand patterns
for maturing economies are
likely to favour mid and late
cycle commodities
• Major producer of later cycle
commodities including the
enabling materials (copper,
cobalt, nickel) that underpin
the battery chemistry and
infrastructure likely to power
electric vehicles and energy
storage systems
• Since 2009, over $40 billion
has been invested in
industrial assets
• Low-cost long-life assets in
many of the world’s premier
mining districts support
sustainable long-term
cash flows
• Mine-life extension
potential embedded
in key commodities
Volume of commodities required
to enable 30% EV sales by 2030
+4.1mt
Copper
+1.1mt
Nickel
+314kt
Cobalt
Industrial Adjusted EBITDA
mining margins
38%
Metals and minerals,
down from 40%
46%
Energy products,
up from 41%
Adjusted EBITDA◊
diversified by
commodity and geography (%)
8 Glencore Annual Report 2018
11. 0
30
60
90
120
150
2012 2013 2014 2015 2016 2017
Marketing Adjusted EBIT Indexed
Industrial Adjusted EBITDA Indexed
2018
Business
review
Page 60
A unique
marketing
business that
extracts value
across the entire
supply chain
Significant
cash flow
generation and
distribution
potential
A conviction
to create value
• As a marketer of commodities,
we can extract value from
the full-range of arbitrage
opportunities
• We create value from our
economies of scale, our
extensive (including third
parties) supply base, our
logistics, risk management
and working capital
financing capabilities
• Funds from operations (FFO)◊
up 2% to $11.6 billion in 2018
• FFO/Net debt◊
of 78.8%
• Minimum distribution
policy based on a fixed/
variable payout of prior year
cash flow, comprising a fixed
$1 billion from marketing
and a minimum pay-out
ratio of 25% of Industrial
asset free cash flow
• Capital allocation framework
balances preservation
of capital structure with
attractive investment and
growth opportunities
• Conviction to create value
through partnerships, MA
and organic investment
• Unique ability to source and
structure deals using trading
and strategic relationships
Earnings per share
$0.24
down 41%
2019 distribution recommended
$2.8bn
$0.20/share
2019 announced buyback
$2.0bn
Investing in MA
$2.9bn
Including HVO, Hail Creek
and a $1bn loan to acquire
a South African oil business
Investing in brownfield growth
$1.2bn
Expansionary capital investment
in African copper, Zhairem,
Integrated Nickel Operations
and Koniambo
Resilience of marketing earnings
9
Glencore Annual Report 2018
Strategic
Report
Financial
statements
Governance
Additional
information
12. 1 Future commodity
supply
• The pro-cyclical nature of mining investment
means that new mines are usually approved
when commodity prices are higher
• Given the long development time frames
required to bring new mine supply on line,
the timing as to when this appears in
the economic cycle is difficult to predict
and could appear at low points in the
economic cycle, creating excess supply
in the market
• Over-investment creates oversupply and
with it a potentially prolonged period of low
commodity prices
• Although commodity prices have increased
significantly from the lows seen in early 2016,
the experience of the last economic cycle has
increased investor pressure on companies to be
more cautious about investing in new supply
• Balancing a finite, declining resource base
with the need to grow to meet expected future
demand is an inherent challenge for companies
in the resource sector
$38bn
estimated 2018 sector reinvestment compared
to a 13 year average of $43bn (estimated)
• Our disciplined approach to capital allocation
attempts to ensure that supply and demand
forces retain a level of balance
• Given the unpredictability of costs, risks
and timing of large-scale greenfield projects
we prefer to add supply via targeted capital
efficient/low risk brownfield expansions
when required
Our zinc production
increased by
2%
against a significant global
supply shortfall vs demand
Our market drivers
We are dependent upon the supply
of and demand for our commodities
Impact
on our
industry
Key
market
drivers
How we are
responding
10 Glencore Annual Report 2018
13. 2 Demand for the commodities
we produce 3 Energy and emissions
transformation
• The industrialisation and urbanisation of
developing economies over the last decade has
driven significant growth in commodity demand
• China’s rapid growth over this period now means
that it accounts for up to half of global demand
for most commodities
• As developing economies mature, the
commodities that drive their growth change
• Momentum to decarbonise the global economy
is gathering pace as nations increasingly
coordinate efforts aimed at minimising
greenhouse gas emissions to achieve the Paris
Agreement climate change goals and transition
the world to a low-carbon economy
China accounts for close to
50%
of global demand for
most commodities
The Paris Agreement aims to keep the global
temperature rise this century to well below
2ºc
as well as pursue efforts to limit the
temperature increase even further to 1.5ºc
• Increased levels of industrialisation and
urbanisation suggest demand growth rates
for commodities may be lower in the future
• Negative demand could generate excess
supply along with lower commodity prices
• Early-cycle commodities such as iron ore, coking
coal and cement may become less important
as demand patterns shift in favour of mid and late
cycle commodities such as copper, zinc, cobalt,
nickel, thermal coal and agricultural products
• This transition is likely to increase the cost for
fossil fuels, impose levies for emissions and
increase costs for monitoring and reporting
and to reduce demand for fossil fuels
• Third parties, including potential or actual
investors, may also introduce policies adverse
to Glencore due to our interest in fossil fuels,
particularly coal
• Technological advances are making renewable
energy sources more competitive with fossil
fuels which are likely to have increased
market share over the longer run. In particular,
many analysts believe that demand for coal
may reduce sooner than previously expected
An extra 1.7 billion people forecast
to increase global energy demand
25%
by 2040 under IEA New Policies Scenario
• With the expectation that growth drivers in the
global economy will remain weighted towards
consumer spending, and therefore commodity
demand growth will be focused in the higher-end,
fast growing consumer sectors, our diverse
commodity portfolio, supplying this demand,
is well placed to benefit from this transition
• We are a major producer of the commodities
that underpin the current battery chemistry
and infrastructure initiatives that are expected
to power electric vehicles and energy storage
systems and this new source of demand
• We continuously assess the risks and
opportunities presented by decarbonisation
of energy and mobility across our product
and operational portfolio
• As a major producer and consumer of fossil fuels,
we recognise our responsibility to understand
and manage our greenhouse gas emissions,
and support the global transition to a
low-carbon economy
• In consultation with the investor signatories of
the Climate Action 100+ initiative, we have agreed
steps to further our commitment to the transition
to a low-carbon economy
Principal risks
and uncertainties
Page 24
Climate change –
looking beyond 2020
Page 20
11
Glencore Annual Report 2018
Strategic
Report
Financial
statements
Governance
Additional
information
14. Business model
As a global producer and marketer of commodities,
we are uniquely diversified by geography, products
and activities. Integrating our marketing and industrial
business sets us apart from our competitors and helps
us generate value
Exploration, acquisition and development
Our focus on brownfield sites and exploration close to existing
assets lowers our risk profile and lets us use existing infrastructure,
realise synergies and control costs.
Extraction and production
We mine and beneficiate minerals across a range of commodities,
mining techniques and countries, for processing or refining at
our own facilities, or for sale.
Processing and refining
Our expertise and technological advancement in processing
and refining mean we can optimise our end products to suit
a wider customer base and provide security of supply as
well as valuable market knowledge.
Energy
Agriculture
Metals and
minerals
3 business segments,
spanning the metals,
energy and agricultural
markets, producing
90 commodities
from 150 sites
Our business activities
are driven to achieve
our strategic imperatives
and our commitment
to developing a
sustainable business
Safety
The safety of our people is our top
priority. We aim to eliminate fatalities
and provide a safe workplace.
Health
We want to protect and improve
the health of our workforce and
local communities.
Environment
We aim to minimise any negative
environmental impact from our activities
and promote efficient use of resources,
such as energy and water.
Inputs and resources
on which our business
model depends
Assets and natural resources
• Our resources and reserves are
overall long-life and of a high
quality, enhancing the scale and
value of our marketing business
• We are a disciplined producer,
seeking to align supply with
demand and value over volume
Our people and partners
• We have established long-term
relationships with a broad
range of suppliers and
customers across diverse
industries and geographies
• c.158,000 employees and
contractors spread across
90 sites/offices and six continents
Financial discipline
• We deploy capital in a disciplined
manner, seeking to create value
for all our stakeholders
• Our hedging strategies protect
us against price risks and ensure
that our marketing profitability
is primarily determined by
volume-driven activities and
value-added services rather
than absolute price
Unique market knowledge
• As an integrated commodity
producer and marketer,
we are uniquely positioned
to generate value at every
stage of the commodity chain
Glencore Annual Report 2018
12
15. Geographic
arbitrage
Product
arbitrage
Time
arbitrage
Our marketing
business
Page 15
Our commodities in
everyday products
Logistics and delivery
Our logistics assets allow us to handle large volumes
of commodities, both to fulfil our obligations and to
take advantage of demand and supply imbalances.
These value added services make us a preferred
counterparty for customers without such capabilities.
Blending and optimisation
Our ability to blend and optimise allows us to offer a wide range of
product specifications, resulting in a superior service and an ability
to meet our customer specific requirements.
Anti-bribery and corruption
Offering, paying, soliciting or accepting
bribes is unacceptable. We work to
identify and reduce the risks of bribery
and corruption across all our business.
Community and human rights
We foster sustainable growth and respect
human rights wherever we operate.
Safety
3%
increase in total recordable
injury frequency rate
Payments to
Governments
$5.7bn
Minimising our impact
on the environment
-9%
reduction in carbon
emissions (scope 1 and
scope 2 – location based)
Adjusted EBITDA◊
$15.8bn
2018 announced
distributions/buybacks
$5.2bn
Our marketing business
We move commodities
from where they are plentiful
to where they are needed.
Our strategy for a
sustainable future
Page 16
Sustainability
framework
Page 37
13
Glencore Annual Report 2018
Strategic
Report
Financial
statements
Governance
Additional
information
16. Metals and
minerals
Energy Agriculture
Business model continued
Strength through
combination
Our scale and presence both as a producer
and marketer of commodities is unrivalled.
We are present at every point of the
value chain, from where commodities are
sourced to where they are consumed:
• Global scale
• Long-term relationships
• Unique insights
• Differentiated opportunities
Traditional miner Marketer
Glencore
Logistics/
marketing
Blending/
optimisation
Processing/
refining
Extraction/
production
Exploration
4.5mt1
Copper metal and
concentrates marketed
3.2mt1
Zinc metal and
concentrates marketed
1.7bn bbl
Crude oil and oil
products marketed
1,200
Vessels on the ocean
at any one time
7,000+
Long-term relationships
with suppliers and
customers
1 Estimated metal unit contained.
Principal risks
and uncertainties
Page 24
Strategy and risk
A supportive strategy
Our Marketing Business supports
the creation of incremental value
from a pool of allocated capital
through critical mass, blending,
storage and arbitrage opportunities.
Our presence at every stage of the
value chain allows us to leverage
our scale and diversity.
How we manage risk
We mitigate credit risks through
application of measures including
credit insurance, letters of credit,
security arrangements and bank
or corporate guarantees.
We manage market exposure
by reducing price risks arising from
timing differences to acceptably
low levels.
Our policies/procedures seek to
ensure we comply with applicable
sanctions, laws and regulations.
Glencore Annual Report 2018
14
17. Our marketing
business
Market insight and
customer understanding
Our global scale and presence in
more than 90 commodities across
50 countries gives us extensive
market knowledge and insight
to help us fully understand the
needs of our customers.
Anticipating supply and demand
Our integrated marketing
and industrial businesses work
side-by-side to give us presence
across the entire supply chain,
delivering in-depth knowledge
of physical market supply
and demand dynamics and
an ability to rapidly adjust to
market conditions.
Creating opportunities
The significant scale of both our
own production and the volumes
secured from third parties allows
us to create margin opportunities
from our ability to supply the
exact commodities the market
needs through processing and/or
blending and optimisation
of qualities.
Generating revenue
We generate revenues as a
fee-like income from physical
asset handling and arbitrage, as
well as blending and optimisation
opportunities. Our use of hedging
instruments results in profitability
being largely determined by
these activities rather than by
absolute price movements.
Arbitrage
opportunities
Many of the physical commodity
markets in which we operate are
fragmented or periodically volatile.
This can result in arbitrage: price
discrepancies between the prices
for the same commodities in
different geographic locations
or time periods.
Other factors with arbitrage
opportunities include freight
and product quality.
Geographic
arbitrage
Disparity
Different prices for the same
product in different geographic
regions, taking into account
transportation and transaction
costs.
Execution
Leverage global relationships
and production, processing and
logistical capabilities to source
product in one location and
deliver in another..
Product
arbitrage
Disparity
Pricing differences between
blends, grades or types
of commodity, taking into
account processing and
substitution costs.
Execution
Ensure optionality with
commodity supply contracts,
and look to lock-in profitable
price differentials through
blending, processing or
end-product substitution.
Time
arbitrage
Disparity
Different prices for a commodity
depending on whether delivery
is immediate or at a future date,
taking into account storage
and financing costs.
Execution
Book “carry trades” that benefit
from competitive sources of
storage, insurance and financing.
We move commodities from where they
are plentiful to where they are needed
15
Glencore Annual Report 2018
Strategic
Report
Financial
statements
Governance
Additional
information
18. Our strategy for a sustainable future
We recognise our ongoing responsibility to not only
deliver financial performance but also make a positive
contribution to society and create lasting benefits
for stakeholders in a manner that is responsible,
transparent and respectful to the rights of all
Strategic objective
To sustainably grow
total shareholder
return while
maintaining a strong
investment grade
rating and acting as a
responsible operator
Glencore Annual Report 2018
16
19. We believe that by being a better operator with a reputation for
doing things the right way, we will be seen by our stakeholders
as a partner of choice. We are achieving this through taking an
approach of continuous improvement. This approach is delivered
through our health and safety programmes, advancing our
environmental performance, respecting human rights and
by developing, maintaining and strengthening our relationships
with all of our stakeholders.
3%
Increase in Total Recordable
Injury Frequency Rate in 2018
We recognise that a robust and sufficiently flexible balance sheet
contributes to the delivery of sustainable, long-term shareholder
returns and ensures that Glencore is well placed to withstand the
cyclical nature of the natural resource industry. We aim to increase
returns on capital and cash flows while targeting a maximum 2x
Net debt/Adjusted EBITDA ratio throughout the cycle. We aim to
only deploy capital when strict and clearly defined financial criteria,
relating to returns and payback, can be met.
$10 – $16bn
Managed Net debt range
Our major industrial assets are mainly long-life and low-cost,
reflecting our substantial investment into existing assets as well
as our appetite, capabilities and belief in some commodities
and geographies where our peers are not materially present.
Our industrial assets provide a consistent source of volumes for
our marketing operations, which are supplemented by third party
production. Our marketing activities use their scale and capabilities
to extract additional margin throughout our business model and
provide a superior service to our customers and a reliable supply
of quality product.
We seek to increase the value of our business by improving the
competitiveness of our assets through an ongoing focus on cost
management and logistical capabilities, including operating safely
and efficiently. We take a disciplined approach towards all of our
assets and will divest when another operator places greater value
on them, or curtail production in response to oversupply when it
makes sense to do so.
+15%
Increase in Industrial Adjusted EBITDA
1
Integration of
sustainability
throughout
our business
2
Maintain
a robust
and flexible
balance sheet
3
Focus on cost
control and
operational
efficiencies
Strategic priorities
CEO’s review
Page 4
17
Glencore Annual Report 2018
Strategic
Report
Financial
statements
Governance
Additional
information
20. Strategic priorities Performance in 2018
1
Integration of
sustainability
throughout
our business
SafeWork programme
Continued to progress
our SafeWork programme,
an initiative that focuses
on eliminating fatalities
and occupational diseases.
Regrettably, there were
thirteen fatalities during the
year. We continue to work
towards the elimination of
fatalities from our business.
Our TRIFR and LTIFR
increased by 3% and 4%
respectively compared
to 2017.
Climate change
On track for meeting
group-wide carbon emission
intensity reduction target
of at least 5% on 2016 levels
by 2020.
As one of the world’s
largest diversified resource
companies, we have a key role
to play in enabling transition
to a low-carbon economy.
We do this through our well
positioned portfolio that
includes commodities that
underpin energy and mobility
transformation that is a key
part of the global response
to the increasing risks posed
by climate change.
Water management
Operations continue
to implement our water
management guideline
which aligns with the
ICMM’s position statement
on water and its water
management framework.
Community engagement
Our community
development programmes
are an integral part of our
community and stakeholder
engagement strategies.
In 2018, we spent $95 million
on these programmes
(2017: $90 million).
2
Maintain
a robust
and flexible
balance sheet
Conservatively repositioned
Capital structure and credit
profile managed through
targeting a maximum 2x
Net debt/Adjusted EBITDA
throughout the cycle,
augmented by an upper
Net debt cap of c.$16 billion.
Year-end Net debt and FFO/
Net debt were $14.7 billion
and 78.8% respectively.
Net income attributable
to equity holders for 2018
was $3.4 billion.
Conviction to create value
Targeted bolt-on acquisitions,
low-cost/risk organic growth
and recycling of capital enabled
capital efficient growth in
compelling commodities.
Bonds
Issued $0.625 billion of
non-dilutive cash settled
convertible bonds due 2025.
Issued a six-year CHF 175 million
bond. Post-2018 maturities
capped at c.$3 billion in any
one year.
Credit rating
The Group’s credit
ratings are currently Baa2
(positive outlook) from
Moody’s and BBB+ (stable)
from Standard Poor’s.
Credit facility
Revolving credit facility
refinanced and resized
to reflect current funding
needs. Committed available
liquidity of $10.2 billion
at year end covers more
than three years of
bond maturities.
3
Focus on cost
control and
operational
efficiencies
Industrial
Strong Adjusted EBITDA
mining margins of 38%
and 46% respectively in our
metals and energy operations
reflect the benefit of higher
prices that more than offset
modest inflationary and
cost pressures as well as the
optimisation of cost structures
and efficiencies over the last
two years.
Marketing
Achieved $2.4 billion Adjusted
EBIT across our marketing
business. The benefits of
supportive market conditions
during the year, particularly
in the first half, were partially
offset by some customer
non-performance in cobalt
as well as alumina basis
risk exposure.
Supply
Continued our disciplined
approach to supply.
Partial restart of idled
zinc production in 2018.
Additional contribution
forecast from 2019 with
an increase in McArthur
River zinc production.
Our strategy for a sustainable future continued
Glencore Annual Report 2018
18
21. Priorities going forward KPIs Principal risks
Sustainability
We will continue to
implement activities that
promote an approach of
consistent improvement for
sustainability throughout
our business to support our
commitment to continuously
improve our standards of
health, safety, environmental
and community and human
rights performance.
As part of our commitment
to a low-carbon economy,
we will limit our coal
production capacity
broadly to current levels.
Transparency
We are committed to
operating transparently,
responsibly and meeting or
exceeding applicable laws
or external requirements.
• Safe and healthy
workplace – TRIFR,
LTIFR and occupational
disease cases
• Environmental
performance – water
withdrawn, greenhouse
gas (GHG) emissions,
meeting our commitments
on climate change
• Long-term value for
communities – community
investment spend
• Health, safety
and environment
• Climate change
• Community relations
and human rights
Balance sheet strength
We are committed to
maintaining our balance
sheet strength to ensure
it is capable of supporting
growth and shareholder
returns regardless of
the commodity price
environment.
Investment grade rating
We will preserve a robust
capital structure and business
portfolio that reflects our
commitment to targeting,
receiving and maintaining a
strong BBB/Baa investment
grade rating. In this regard,
we are targeting a maximum
2x Net debt/Adjusted EBITDA
through the cycle, augmented
by an upper Net debt cap
of c.$16 billion. In the current
uncertain economic cycle
backdrop, aiming to limit
Net debt/Adjusted EBITDA
to around one times.
• Returns to shareholders –
Funds from operations,
Net funding and Net debt
• Value for our shareholders
– Adjusted EBIT/EBITDA,
Net income attributable
to equity holders
• Supply, demand and
prices for the commodities
we produce
• Currency exchange rates
• Liquidity
• Counterparty credit
and performance
Industrial activities
Our industrial activities
will continue to focus
on controlling costs and
generating sustainable
operating and capital
efficiencies. Our marketing
business supports the
creation of incremental
value through critical mass,
blending, storage and
geographical arbitrage.
Positioned to leverage
our scale and diversity
Our marketing activities’
priorities are to maximise
the returns and cash flows
from the pool of allocated
capital, which, in turn,
supports the strengthening
of our balance sheet. Our
presence at every stage
of the value chain means
that Glencore is uniquely
positioned to leverage
our scale and diversity.
• Returns to shareholders –
Funds from operations,
Net funding and net debt
• Value for our shareholders
– Adjusted EBIT/EBITDA,
Net income attributable
to equity holders
• Geopolitical, permits
and licence to operate
• Laws and enforcement
• Operating risk
• Cyber risk
Key performance
indicators
Page 22
Principal risks
and uncertainties
Page 24
19
Glencore Annual Report 2018
Strategic
Report
Financial
statements
Governance
Additional
information
22. Climate change – looking beyond 2020
As one of the world’s largest diversified resource
companies, Glencore has a key role to play in enabling
transition to a low-carbon economy. We do this through
our well positioned portfolio that includes copper,
cobalt, nickel, vanadium and zinc – commodities that
underpin energy and mobility transformation. We believe
this transition is a key part of the global response to the
increasing risks posed by climate change
We recognise climate change
science as set out by the United
Nations Intergovernmental Panel on
Climate Change. We believe that the
global response to climate change
should pursue twin objectives: both
limiting temperatures in line with
the goals of Articles 2.1(a)1
and 4.12
of the Paris Agreement (“the Paris
Goals”) and supporting the United
Nations Sustainable Development
Goals, including universal access
to affordable energy.
To deliver a strong investment case
to our shareholders, we must invest
in assets that will be resilient to
regulatory, physical and operational
risks related to climate change.
To meet the growing needs of a lower
carbon economy, Glencore aims
to prioritise its capital investment
to grow production of commodities
essential to the energy and mobility
transition and to limit its coal
production capacity broadly to
current levels3
.
20 Glencore Annual Report 2018
23. 1
Paris-consistent
strategy/capital
discipline
5
Corporate climate
change lobbying
1 As Glencore rebalances its portfolio towards commodities that support the
transition to a low-carbon economy, the intensity of Scope 3 emissions is expected
to decrease. Starting in 2020, we will disclose our longer-term projections for the
intensity reduction of Scope 3 emissions, including mitigation efforts.
Glencore recognises the importance of disclosing to investors how the company
ensures that material capital expenditure and investments are aligned with the
Paris Goals. This includes each material investment in the exploration, acquisition or
development of fossil fuel (including thermal and coking coal) production, resources
and reserves, as well as in resources, reserves and technologies associated with the
transition to a low-carbon economy. Starting in 2020, we intend to report publicly
on the extent to which, in the Board’s opinion, this was achieved in the prior year and
the methodology and core assumptions for this assessment. These disclosures will
be made in our Annual Report.
2 In 2017, we announced our first target of reducing our greenhouse gas emissions
intensity by 5% by 2020 compared to a 2016 baseline. We are currently on track to meet
this target. Glencore recognises the importance of continued reductions of greenhouse
gas emissions from our operations. We are developing new, longer-term targets based
on policy and technological developments that support the Paris Goals, and intend to
make these public in our Annual Report in 2020. We will report annually on our progress.
3 Glencore reports annually on the progress in meeting its climate change objectives.
The disclosure is included in our Annual Report and supported by further details
in the Sustainability Report. We are committed to transparency and will continue to
publish data on our climate change performance on our website, including continued
disclosure of our Scope 3 emissions. We will give consideration to how our climate
change objectives can be reflected in the design of the relevant schemes for
executive management.
In addition to our reporting under 1 and 2 above, every three years, we will review
any changes to the Nationally Determined Contributions (NDCs) in line with the
Paris Agreement mechanism, and other relevant policy, economic and technology
developments to assess societal progress in the energy transition and to update
our scenario-based portfolio assessment.
4 Glencore was an early supporter of the voluntary guidance on consistent climate
related financial disclosures produced by the TCFD. We are pleased to publicly
support the TCFD guidance and have started to implement its recommendations
in our annual reporting.
Consistent with TCFD recommendations, as appropriate, Glencore will continue to
disclose the metrics, targets and scenarios we use to assess and manage relevant
climate-related risks and opportunities.
5 Glencore believes that it is appropriate that we take an active and constructive
role in public policy development and to participate in relevant trade associations.
Glencore acknowledges “IIGCC Investor Expectations on Corporate Climate Lobbying”
and recognises the importance of ensuring that its membership in relevant trade
associations does not undermine its support for the Paris Agreement and the Paris Goals.
Glencore will consider whether its membership in relevant trade associations aligns
with the company’s stated positions in this statement. The result of this review,
including any material misalignments identified and actions that will be taken,
will be made public in 2019.
Following engagement with investor signatories of the Climate Action
100+ initiative, we are taking the following steps to further our commitment
to the transition to a low-carbon economy:
2
Public Scope 1
and 2 targets
3
Review
of Progress
4
Alignment with
Taskforce on Climate-
related Financial
Disclosures (TCFD)
recommendations
1 Article 2.1(a) of The Paris Agreement states the goal of “Holding the increase in the global average temperature to well below
2°C above pre-industrial levels and pursuing efforts to limit the temperature increase to 1.5°C above pre-industrial levels,
recognising that this would significantly reduce the risks and impacts of climate change.”
2 Article 4.1 of The Paris Agreement reads: “In order to achieve the long-term temperature goal set out in Article 2, Parties
aim to reach global peaking of greenhouse gas emissions as soon as possible, recognising that peaking will take longer for
developing country Parties, and to undertake rapid reductions thereafter in accordance with best available science, so as to
achieve a balance between anthropogenic emissions by sources and removals by sinks of greenhouse gases in the second
half of this century, on the basis of equity, and in the context of sustainable development and efforts to eradicate poverty.”
3 This may include the exercise of our pre-emptive rights to acquire minority stakes of joint-venture partners in our
existing operations.
21
Glencore Annual Report 2018
Strategic
Report
Financial
statements
Governance
Additional
information
24. 2018
2017
2016
EBITDA
EBIT
3,930
10,268
8,459
14,545
15,767
9,143
2018
2017
2016
Net debt
Net funding
FFO to net debt (%)
32,619
31,053
10,216
14,710
32,138
0
30
60
90
120
2018
2017
2016
15,526
2018
2017
2016
7,770
11,350 11,595
2018
2017
2016
1,379
5,777
3,408
Financial key performance indicators:
Definition
Adjusted EBIT/EBITDA provide insight into our overall business
performance (a combination of cost management, seizing market
opportunities and growth), and are the corresponding flow drivers
towards our objective of achieving industry-leading returns.
Adjusted EBIT is the net result of revenue less cost of goods sold
and selling and administrative expenses, plus share of income
from associates and joint ventures, dividend income and the
attributable share of Adjusted EBIT of relevant material associates
and joint ventures, which are accounted for internally by means
of proportionate consolidation, excluding Significant items.
Adjusted EBITDA consists of Adjusted EBIT plus depreciation and
amortisation, including the related Proportionate adjustments.
2018 performance
Adjusted EBITDA was $15.8 billion and Adjusted EBIT was $9.1 billion,
increases of 8% in each case compared to 2017, primarily driven by
generally higher commodity prices, higher production in copper,
zinc and coal, including ramp-ups at Katanga and Lady Loretta
(Mount Isa) and the acquired coal joint venture interests.
Definition
Funds from operations (FFO) is a measure that reflects our ability
to generate cash for investment, debt servicing and distributions
to shareholders.
It comprises cash provided by operating activities before working
capital changes, less tax and net interest payments plus dividends
received, related Proportionate adjustments and Significant items,
as appropriate.
2018 performance
FFO of $11.6 billion was 2% up on 2017, reflecting the improved
Adjusted EBITDA noted above, offset by higher tax payments
on 2017 earnings assessed in 2018.
Definition
Net funding/Net debt demonstrates how our debt is being managed
and is an important factor in ensuring we maintain an investment
grade rating status and a competitive cost of capital.
Net debt is defined as total current and non-current borrowings
less cash and cash equivalents, readily marketable inventories
and related Proportionate adjustments.
The relationship of FFO to net debt is an indication of our financial
flexibility and strength.
2018 performance
Net funding as at 31 December 2018 increased by $1.1 billion to
$32.1 billion, while Net debt (net funding less readily marketable
inventories) increased by $4.5 billion over the year to $14.7 billion.
Such increases reflected ~$3.8 billion disbursements on business
acquisitions (HVO, Hail Creek, oil downstream business) yet to
contribute to FFO on a full 12 months basis, plus enhanced returns
to shareholders.
FFO to Net debt reduced from 111% to 78%, remaining at healthy levels,
reflecting the timing of business acquisition cash flows.
Definition
Net income attributable to equity shareholders is a measure
of our ability to generate shareholder returns.
2018 performance
Net income attributable to equity holders declined in 2018 compared
to 2017, primarily reflecting the impact of non-cash impairments in
the carrying values of our Mutanda and Mopani copper assets, due to
various updated regulatory, technical, tax and other key assumptions,
all of which combined to reduce expected future cash flows.
Announced distributions and buybacks in 2018 totalled $5.2 billion,
in excess of net income attributable to shareholders, reflecting actual
FFO generation and confidence in the sustainable underlying cash
generation of the business.
◊ Refer to APMs section on page 214 for definition and reconciliations.
Key performance indicators
Our financial and non-financial key performance
indicators (KPIs) provide a measure of our performance
against the key drivers of our strategy
Adjusted EBIT/EBITDA◊
(US$ million)
15,767
Net funding/Net debt
and
FFO to net debt◊
(US$ million)
14,710
Links to strategy Links to strategy
Funds from
operations (FFO)◊
(US$ million)
11,595
Net income attributable
to equity holders
(US$ million)
3,408
Links to strategy Links to strategy
Glencore Annual Report 2018
22
25. 2018
2017
2016
4.05
3.08 3.18
2018
2017
2016
35.0
11.9
23.1
33.2
11.6
21.6
30.3
18.5
11.8
Scope 1
Scope 2
2018
2017
2016
971
924
1,020
2018
2017
2016
84
90
95
Non-financial key performance indicators:
Definition
Our CO2 emissions reporting is separated into Scope 1 and Scope 2 –
location-based emissions. Scope 1 (measured in CO2e) includes
emissions from combustion in owned or controlled boilers, furnaces
and vehicles/vessels and coal seam emissions (direct emissions).
Scope 2 – location-based emissions (measured in CO2) applies the grid
emission factor to all our purchased electricity, regardless of specific
renewable electricity contracts (indirect emissions). We monitor and
report both the direct and indirect emissions generated by the industrial
activities, entities and facilities where we have operational control.
2018 performance
During 2018, we emitted 18.5 million tonnes CO2e of Scope 1.
The improvement over 2017 is mainly as a result of lower coal seam
emissions in our Australian coal operations.
We emitted 11.8 million tonnes CO2 of Scope 2 – location based.
The small year-on-year increase in Scope 2 emissions is due to newly
acquired assets, volume increases and production ramp-ups which
outweighed reductions from site closures and divestitures.
Definition
Water withdrawal is a measure of our operational resource efficiency.
Our operations have an ongoing responsibility to increase the reuse
of processed and use of recycled waste water in order to reduce
our impact on local water supplies. Recycled water is predominantly
used in place of fresh water for processes such as dust suppression.
2018 performance
In 2018, we withdrew 1,020 million m3
of water (2017: 924 million m3
).
The increase of water withdrawal is fully attributable to our portfolio
expansion (i.e. incorporation of Volcan). We are committed to managing
our impact on water resources responsibly. We prioritise efficient
water use, water reuse/recycling, responsible waste water disposal and
maintaining any equipment that may pose a hazard to water quality.
Definition
Community investments are our contributions to, and financial
support of, the broader communities in the regions where we operate.
Funds are set aside to support initiatives that benefit communities
and local sustainable development. We also make in-kind contributions,
such as equipment and management. We support programmes
for community development, enterprise and job creation, health,
education and the environment.
2018 performance
In 2018, the funds we made available for community investments were
$95 million, an increase on the amount invested in 2017 ($90 million).
Our community development programmes are an integral part
of our community and stakeholder engagement strategies and
our investments supported various initiatives in all of our
operating regions.
Non-financial indicators includes information and data from our industrial activities, including only assets where we have operational control,
and excluding investment, marketing and holding companies. The 2016 data includes Glencore Agriculture; 2017 and 2018 data excludes
Glencore Agriculture.
Strategic priorities
Integration of sustainability throughout our business
Maintain a robust and flexible balance sheet
Focus on cost control and operational efficiencies
Our strategy for
a sustainable future
Page 16
Financial
review
Page 52
Safety: Total recordable
injury frequency rate (TRIFR)
(per million hours worked)
3.18
Water withdrawn
(million m3
)
1,020
Link to strategy Link to strategy
Carbon emissions
(million tonnes CO2)
30.3
Community investment
(US$ million)
95
Link to strategy Link to strategy
Definition
We believe that every work-related incident, illness and injury is
preventable and we are committed to providing a safe workplace.
TRIFR is the sum of fatalities, lost time injuries, restricted work injuries
and medical treatment injuries per million hours worked. The metric
represents all injuries that require medical treatment beyond first aid.
2018 performance
We are saddened to report that in 2018 thirteen people lost their
lives at our operations (2017: nine people). All loss of life is unacceptable
and we are determined to eliminate fatalities across our Group.
Our TRIFR is 3.18 per million hours worked, an increase of 3% on the
3.08 recorded in 2017.
23
Glencore Annual Report 2018
Strategic
Report
Financial
statements
Governance
Additional
information
26. Principal risks and uncertainties
Glencore is exposed to a variety of risks that can have an
impact on our business and prospects, future performance,
financial position, liquidity, asset values, growth potential,
sustainable development and reputation. Risk management
is one of the core responsibilities of the Board and its Audit
and HSEC Committees, and it is central to the decision
making process. Our principal risks and uncertainties –
whether under our control or not – are highly dynamic
and our assessment and our responses to them are
critical to our future business and prospects
Our risk management framework
identifies and manages risk in a way
that is supportive of our strategic
priorities of opportunistically
deploying capital, while protecting
our future financial security and
flexibility. Our approach towards
risk management is framed by
our ongoing understanding of the
risks that we are exposed to, our
risk appetite and how these risks
change over time.
The Board assesses and approves
our overall risk appetite, monitors
our risk exposure and sets the
Group-wide limits, which are
reviewed on an ongoing basis. This
process is supported by the Audit
and HSEC Committees, whose roles
include evaluating and monitoring
the risks inherent in their respective
areas as described on pages 104–106.
The current assessment of our
principal risks, according to exposure
and impact, is detailed on the
following pages. In accordance
with UK Financial Reporting Council
guidance, we define a principal
risk as a risk or combination of risks
that could seriously affect the
performance, future prospects or
reputation of Glencore. These include
those risks which would threaten the
business model, future performance,
solvency or liquidity of the Group. We
look at risk appetite from the context
of severity of the consequences
should the risk materialise, factors
influencing the risk and the
Company’s ability to mitigate it. In
compiling this assessment we have
indicated the impact and likelihood
of these risks in comparison with
a year ago in the chart opposite.
The commentary on the risks
in this section should be read in
conjunction with the explanatory
text under Understanding the
information on risks which is set
out on page 26.
The natural diversification
of our portfolio of commodities,
geographies, currencies, assets and
liabilities is a source of mitigation
for some of the risks we face. In
addition, through our governance
processes and our proactive
management approach we seek
to mitigate, where possible, the
impacts of certain risks should
they materialise. In particular:
• Our liquidity risk management
policy requires us to maintain
(via a $3 billion minimum
prescribed level) sufficient cash
and cash equivalents and other
sources of committed funding
available to meet anticipated and
unanticipated funding needs,
including ensuring that the
quantum of bonds maturing in
any one year does not exceed
some $3 billion
• Making use of credit enhancement
products, such as letters of credit,
insurance policies and bank
guarantees and imposing limits
on open accounts extended
• Our management of marketing
risk, including daily analysis of
Group value at risk (VaR)
Changes in principal risks
We believe that our principal risks
have remained the same although
our assessment of their possible
negative effect and the scale of
impact has altered. In particular
we believe that geopolitical and
compliance impacts have increased.
Also, pressure for divestment from
coal and coal producing companies
continues to grow. In formulating
a more focused set of risks, we
have (i) combined “Reductions in
commodity prices” and “Fluctuations
in supply of or demand for
commodities” into “Supply, demand
and prices of commodities”; and
(ii) incorporated “Skills availability
and retention” into “Operating”.
2018 developments
Highest impact risks
Significant changes were:
1.
Supply, demand and prices
of commodities: there has
been considerable volatility in
commodity prices over the past 12
months. Any significant downturn
in the current commodity price
environment, especially in copper,
coal or zinc would have a severe
drag on our financial performance.
Additionally, the potential effects
of new trade barriers could
reduce demand for certain of
our commodities or restrict our
supplies. As a result, this continues
to be the Group’s foremost risk.
2.
Currency exchange rates: 2018
reflected a generally stronger
US dollar versus producer country
currencies. While beneficial
over the short term to our locally
denominated operating costs,
this can be indicative of challenges
in world economic conditions
and resulting risks to commodities’
demand and prices. Additionally,
rates can change for reasons
Glencore Annual Report 2018
24
27. 1
2
5
8
2
6
7
10
11
Impact
Moderate
Minor
Major
Severe
Possible
Unlikely Likely Almost certain
Probability
4
9
3
unlinked to commodities,
which could result in mismatched
impact of pricing and currency
movements, resulting in
income volatility.
3.
Geopolitical, permits and
licences to operate: this risk has
become more prominent in 2018,
particularly in light of the various
developments in the DRC.
4.
Laws and enforcement: the
DoJ investigation has considerably
heightened the importance of this
risk, together with other relevant
examples, including sanctions
imposition by US authorities.
5.
Liquidity: while our net debt and
net funding are relatively stable,
and cash flow coverage is healthy,
we remain cognisant that access
to credit is vital and that debt
markets can be volatile.
6.
Cyber: actual and attempted
attacks on organisations continued
to be prevalent. Over time, we have
invested in our security platforms
and data protection, and we
continue to develop our approach
and responses to this evolving risk.
7.
Health, Safety, Environment:
a serious failure in HSE
management could result in an
emergency or catastrophe within
the business, which could result in
injuries or fatalities and also impact
employees safety, production and
Glencore’s reputation. In particular,
catastrophic hazards such as
tailings dam failures and collapses
of pit walls or underground
structures represent significant
unquantifiable risks. Despite our
efforts, our safety performance,
particularly as to fatalities,
continues to be challenging,
mainly reflecting the location and
nature of many of our operations.
In response to the above
challenges, capital expenditure
remains at controllable levels
and initiatives continue to ensure
we operate at optimal working
capital levels. The Group is committed
to maintaining a strong BBB/Baa
investment grade rating balance
sheet, which should support growth
and shareholder returns regardless
of the commodity price environment,
noting also the additional principal
risks which the Group faces.
2018 developments and overview
of principal risks and uncertainties
Key
Risk impact
Moderate Major Severe
External risks
1 Supply, demand and prices of commodities
2 Currency exchange rates
3 Geopolitical, permits and licences to operate
4 Laws and enforcement
5 Liquidity
Business risks
6 Counterparty credit and performance
7 Operating
8 Cyber
Sustainability risks
9 Climate change
10 Community relations and human rights
11 Health, Safety, Environment
Indicates change in 2018
25
Glencore Annual Report 2018
Strategic
Report
Financial
statements
Governance
Additional
information
28. Longer-term viability
In accordance with the requirements
of the UK Corporate Governance
Code, the Board has assessed
the prospects of the Group’s
viability over the four-year period
from 1 January 2019. This period
is consistent with the Group’s
established annual business
planning and forecasting processes
and cycle, which is subject to review
and approval each year by the Board.
The four-year plan considers
Glencore’s adjusted EBITDA, capital
expenditure, funds from operations
(FFO) and net debt, and the key
financial ratios of net debt to
adjusted EBITDA and FFO to net
debt over the forecast years and
incorporates stress tests to simulate
the potential impacts of exposure
to the Group’s principal risks
and uncertainties.
These scenarios included:
• A prolonged downturn
in the price and demand of
commodities most impacting
Glencore’s operations
• Foreign exchange movements
to which the Group is exposed
as a result of its global operations
• An increase in costs associated
with open regulatory
investigations and adverse
geopolitical developments
• Consideration of the potential
impact of adverse movements
in macro-economic assumptions
and their effect on certain key
financial KPIs and ratios which
could increase the Group’s
access to or cost of funding
The scenarios were assessed taking
into account current risk appetite
and any mitigating actions Glencore
could take, as required, in response
to the potential realisation of any
of the stressed scenarios.
Based on the results of the
related analysis, the Directors have
a reasonable expectation that the
Group will be able to continue in
operation and meet its liabilities
as they fall due over the four-year
period of this assessment. They
also believe that the review period
of four years is appropriate having
regard to the Group’s business
model, strategy, principal risks
and uncertainties, and viability.
Understanding the information on risks
There are many risks and uncertainties
which have the potential to significantly
impact our business, including
competitive, economic, political, legal,
regulatory, sustainability and financial
risk. The order in which these risks
and uncertainties appear does
not necessarily reflect the likelihood
of their occurrence or the relative
magnitude of their potential material
adverse effect on our business.
We have sought to provide examples
of specific risks. However, in every
case these do not attempt to be an
exhaustive list. These principal risks and
uncertainties should be considered in
connection with any forward looking
statements in this document as
explained on page 237.
Identifying, quantifying and managing
risk is complex and challenging.
Although it is our policy to identify
and, where appropriate and practical,
actively manage risk, our policies
and procedures may not adequately
identify, monitor and quantify all risks.
This section describes our attempts
to manage, balance or offset risk.
Risk is, however, by its very nature
uncertain and inevitably events may
lead to our policies and procedures
not having a material mitigating
effect on the negative impacts of
the occurrence of a particular event.
Our scenario planning and stress
testing may accordingly prove to be
optimistic, particularly in situations
where material negative events occur
in close proximity. Since many risks
are connected, our analysis should
be read against all risks to which
it may be relevant.
In this section, we have sought to
update our explanations, reflecting
our current outlook. Mostly this
entails emphasising certain risks
more strongly than other risks rather
than the elimination of, or creation of,
risks. Certain investors may also be
familiar with the risk factors that are
published in the Group debt or equity
prospectuses or listing documents.
These provide in part some differing
descriptions of our principal risks.
A recent example is available on our
website at: glencore.com/who-we-
are/governance
In addition, more information on
our risks is available in the relevant
sections of our website.
To provide for concise text:
• Where we hold minority interests
in certain businesses, although these
entities are not generally subsidiaries,
the interests are mostly taken as
being referred to in analysing these
risks, and “business” refers to these
and any business of the Group
• Where we refer to natural hazards,
events of nature or similar
phraseology we are referring to
matters such as earthquake,
flood, severe weather and other
natural phenomena
• Where we refer to “mitigation”
we do not intend to suggest that
we eliminate the risk, but rather it
shows the Group’s attempt to reduce
or manage the risk. Our mitigation
of risks will usually include the
taking out of insurance where it is
customary and economic to do so
• This section should be read as a
whole – often commentary in one
section is relevant to other risks
• “commodity/ies” will usually refer
to those commodities which the
Group produces or sells
• “law” includes regulation of any type
• “risk” includes uncertainty and
hazard and together with “material
adverse effect on the business”
should be understood as a negative
change which can seriously affect
the performance, future prospects
or reputation of the Group. These
include those risks which would
threaten the business model,
future performance, reputation,
solvency or liquidity of the Group
• A reference to a note is a note
to the 2018 financial statements
• A reference to the sustainability
report is our 2018 sustainability
report to be published in April 2019
Principal risks and uncertainties continued
Strategic priorities
Integration of sustainability throughout our business
Maintain a robust and flexible balance sheet
Focus on cost control and operational efficiencies
Glencore Annual Report 2018
26
29. External risks
1
Supply, demand and prices of commodities Risk movement in 2018: Stable
Link to strategic priorities
Risk appetite
Low. Outside of the inherent risk of commodity
prices on unmined reserves/resources, flat
price exposure on extracted or trading related
positions is to be hedged, when possible.
Additionally, we seek to ensure this risk is
minimised through scale of operations
and diversity of product.
Risk description
The revenue and earnings of substantial parts
of our industrial activities and, to a lesser extent,
our marketing activities, are dependent upon
prevailing commodity prices. Commodity
prices are influenced by a number of external
factors, including the supply of and demand
for commodities, speculative activities
by market participants, global political and
economic conditions, related industry
cycles and production costs in major
producing countries.
We are dependent on the expected volumes
of supply or demand for commodities which
can vary for many reasons, such as competitor
supply policies, changes in resource availability,
government policies and regulation, costs
of production, global and regional economic
conditions and demand in end markets for
products in which the commodities are used.
These reasons also include technological
developments, e.g. commodity substitutions,
fluctuations in global production capacity,
global and regional weather conditions, natural
disasters and diseases, all of which impact
global markets and demand for commodities.
Furthermore, changes in expected supply
and demand conditions impact the expected
future prices (and thus the price curve) of
each commodity.
Comments/impacts to the Group
A significant downturn in the price of commodities generally results
in a decline in our cash flow and profitability, and could potentially result
in impairment and balance sheet constraints. It is especially harmful to
profitability in the industrial activities, which are more directly exposed
to price risk due to the higher level of fixed costs. Government policy
decisions can be very important, e.g. in reducing the demand for coal
or increasing its pricing (via carbon taxes) – see Climate change below.
New or improved energy production or technologies can also reduce
the demand for some commodities such as coal. Major decisions by
governments can also lead to lower growth of some countries or regions,
such as US/China trade decisions and Brexit.
Any adverse economic developments, particularly impacting China
and fast growing developing countries, could lead to reductions in
demand for, and consequently price reductions of, commodities.
Future demand for certain commodities might decline (e.g. fossil fuels),
whereas others might increase (such as copper, cobalt, and nickel for
their use in electric vehicles and batteries), taking into consideration
the “greening” of the global economy.
This risk is currently prevalent in various commodities, such as steel,
coal and oil. In particular, many analysts believe that demand for coal will
reduce sooner than previously expected due to significant cost reductions
in renewable and alternate capacity.
The dependence of the Group (especially our industrial business) on
commodity prices, supply and demand of commodities, make this the
Group’s foremost risk. See the Chief Executive Officer’s review on page 4
and the financial review on page 52.
Mitigating factors
Achieving operational efficiencies and enhanced focus on cost control.
Diversification of our portfolio of commodities, geographies, currencies,
assets and liabilities. Maintaining a global portfolio of customers
and contracts.
Preparing for shifts in commodity demand by putting a special focus
on the parts of the business that will potentially grow with the anticipated
increase of electric vehicles and battery production and closely monitor
fossil fuel (particularly thermal coal) demands.
See the Chief Executive Officer’s review on page 4 and the financial
review on page 52.
2
Currency exchange rates Risk movement in 2018: Stable
Link to strategic priorities
Risk appetite
Low. Where possible foreign exchange (“FX”)
exposure to non-operating foreign exchange
risk are to be hedged.
Risk description
The vast majority of our transactions are
denominated in US dollars, while operating
costs are spread across many different countries,
the currencies of which fluctuate against the
US dollar. A depreciation in the value of the US
dollar against one or more of these currencies
will result in an increase in the cost base of the
relevant operations in US dollar terms.
The main currency exchange rate exposure
is through our industrial assets, as a large
proportion of the costs incurred by these
operations is denominated in the currency
of the country in which each asset is located.
The largest of these exposures are to the
currencies listed on page 62.
Comments/impacts to the Group
Currency fluctuations tend to move in inverse correlation to commodity
prices and supply and demand fundamentals as noted above, such that
decreases in commodity prices are generally associated with increases
in the US dollar relative to local producer currencies and vice versa. If this
occurs then it is detrimental to us through higher equivalent US dollar
operating costs at the relevant operations. This negative, however, would
usually be offset to some extent by the increases in commodity prices
which had influenced this change.
Mitigating factors
The FX inverse correlation described above usually provides a natural partial
FX hedge for the industrial business. In respect of commodity purchase
and sale transactions denominated in currencies other than US dollars,
the Group’s policy is usually to hedge the specific future commitment
through a forward exchange contract. From time to time, the Group
may hedge a portion of its currency exposures and requirements in an
attempt to limit any adverse effect of exchange rate fluctuations.
27
Glencore Annual Report 2018
Strategic
Report
Financial
statements
Governance
Additional
information
30. External risks continued
3
Geopolitical, permits and licences to operate Risk movement in 2018: Increase
Link to strategic priorities
Risk appetite
High. We operate in countries with less developed
political and regulatory regimes. To be considered
a truly diversified commodities group, operations
in these jurisdictions are required.
Risk description
We operate and own assets in a large number
of geographic regions and countries, some of
which are categorised as developing, complex
or having unstable political or social climates.
As a result, we are exposed to a wide range
of political, economic, regulatory, social and tax
environments. The Group transacts business
in locations where it is exposed to a risk of overt
or effective expropriation – resource nationalism
continues to be a challenging issue in many
countries. Our operations may also be affected
by political and economic instability, including
terrorism, civil disorder, violent crime, war
and social unrest.
Increased scrutiny by governments and tax
authorities in pursuit of perceived aggressive
tax structuring by multinational companies has
elevated potential tax exposures for the Group.
The terms attaching to any permit or licence
to operate may be onerous and obtaining these
and other approvals, which may be revoked,
can be particularly difficult. Furthermore, in
certain countries title to land and rights and
permits in respect of resources are not always
clear or may be challenged.
Adverse actions by governments and others
can result in operational/project delays or loss
of permits or licences to operate.
The suspension or loss of our permits or licences
to operate could have a material adverse effect
on the Group and could also preclude Glencore
from participating in bids and tenders for future
business and projects, therefore affecting the
Group’s long-term viability.
Our licences to operate through mining rights
are dependent on a number of factors, including
compliance with regulations. It also depends
on constructive relationships with a wide and
diverse range of stakeholders.
Comments/impacts to the Group
Policies or laws in the countries in which we do business may change
in a manner that may be adverse for us, even those with stable political
environments e.g. many governments have sought additional sources
of revenue by increasing rates of taxation, royalties or resource rent
taxes or may increase sustainability obligations.
We have no control over changes to policies, laws and taxes.
In 2018 our operations have been subject to significant tax increases in
the DRC (see below) and Zambia. Some other tax authorities have taken
a tougher approach to engaging with the Group which has in some
cases led to litigation. See also 4 below.
The continued operation of our existing assets and future plans are in
part dependent upon broad support, our “social licence to operate”, and
a healthy relationship with the respective local communities – see further
Community Relations and Operating risks concerning workforce disputes.
In July 2018, a New DRC Mining Code came into effect. The New DRC
Mining Code introduced amongst other measures (1) a cap on a Company’s
ability to repatriate excess capital earned above its initial investment
amount; (2) significantly higher taxes and royalties; and (3) potential state
ownership in certain projects of up to 10%.
Mitigating factors
The Group’s industrial assets are diversified across various countries.
Also, the Group continues to actively engage with governmental
authorities in light of upcoming changes and developments in
legislation and enforcement policies.
See map on pages 2–3 which sets out our global operational footprint.
We endeavour to design and execute our projects according to high
legal, ethical, social, and human rights standards, and to ensure that
our presence in host countries leaves a positive lasting legacy (see
sustainability risks below). This commitment is essential to effectively
manage these risks and to maintain our permits and licences to operate.
The Group has an active engagement strategy with the governments,
regulators and other stakeholders within the countries in which
it operates or intends to operate. Through, strong relationships with
stakeholders we endeavour to secure and maintain our licences
to operate.
In 2018, we also published our third Payments to Governments report.
This detailed total government contributions in 2017 of over $4 billion.
It also set out details of payments on a project by project basis.
We also continue to be an active member of the Extractive Industries
Transparency Initiative (EITI).
Principal risks and uncertainties continued
Glencore Annual Report 2018
28
31. External risks continued
4
Laws and enforcement Risk movement in 2018: Increase
Link to strategic priorities
Risk appetite
Medium. The Group maintains programmes
which seek to ensure that we comply with
or exceed the laws and external requirements
applicable to our operations and products.
However, some of our industrial activities
are located in countries that are categorised
as developing, complex or having political
or social climates and/or where corruption
is generally understood to exist.
Risk description
We are exposed to extensive laws including
those relating to bribery and corruption,
sanctions, taxation, anti-trust, financial
markets regulation, environmental protection,
use of hazardous substances, product safety
and dangerous goods regulations, development
of natural resources, licences over resources,
exploration, production and post-closure
reclamation, employment of labour and
occupational health and safety standards.
The legal system and dispute resolution
mechanisms in some countries may be
uncertain so that we may be unable to enforce
our understanding of our rights. Successful
lawsuits based upon damage resulting from
operations could lead to the imposition of
substantial penalties, the cessation of operations,
compensation and remedial and/or preventative
orders. Moreover, the costs associated with
legal compliance, including regulatory permits,
are substantial and increasing. Any changes to
these laws or their more stringent enforcement
or restrictive interpretation could cause additional
significant expenditure to be incurred or
cause suspensions of operations and delays
in the development of industrial assets. Failure
to obtain or renew a necessary permit or the
occurrence of other disputes could mean
that we would be unable to proceed with the
development or continued operation of an
asset and/or impede our ability to develop
new industrial properties.
As a diversified sourcing, marketing and
distribution company conducting complex
transactions globally, we are exposed to the
risks of fraud, corruption, sanctions breaches
and other unlawful activities both internally
and externally. Our marketing operations are
large in scale, which may make fraudulent
or accidental transactions difficult to detect.
In addition, some of our industrial activities
are located in countries, where corruption is
generally seen. Corruption and sanctions risks
remain highly relevant for businesses operating
in international markets as shown by recent
regulatory enforcement actions both inside
and outside the resources sector.
Comments/impacts to the Group
During the year:
1.
Following the designation by the US Government (“USG”) of Dan Gertler
and affiliated companies as Specially Designated Nationals (“SDNs”),
thereby imposing blocking sanctions on them and companies owned
50% or more by them, the Group had to consider whether it was able
to satisfy contractual obligations to make royalty and pas-de-porte
payments in respect of KCC and Mutanda. Following litigation processes
and negotiations, these obligations are now being satisfied other than
in US dollars and without the involvement of US persons, which Glencore
believes appropriately addresses all applicable sanctions regulations.
2.
United Company Rusal plc was designated by the USG as a SDN, which
led to Mr Glasenberg resigning from his position as a director of Rusal
and required careful monitoring of the trading relationship with Rusal.
3.
A dispute between Katanga Mining Limited (“KML”) and La Generales
des Carrieres et des Mines (“Gecamines”) led to a $5.6 billion
recapitalisation of KCC and additional settlement costs totalling
$248 million, see note 33 of the financial statements.
4.
On 3 July 2018, a subsidiary received a subpoena from the US Department
of Justice (DOJ) to produce documents and other records with respect
to compliance by the Group with the Foreign Corrupt Practices Act and
US money laundering statutes. The requested documents related to
our business in Nigeria, the DRC and Venezuela from 2007.
In the event that the DOJ investigation identifies wrong doing, the
costs to the Group, whether by way of legal fees, penalties, ongoing
monitoring, reputational or otherwise, could be material.
5.
The Ontario Securities Commission (“OSC”) approved a settlement pursuant
to which KML, a subsidiary, acknowledged that it had (i) misstated its
financial position and results; (ii) failed to maintain adequate disclosure
and internal controls; (iii) failed to disclose material weaknesses in its
internal controls; and (iv) failed to adequately describe the heightened risks
associated with its operating environment, specifically the elevated
risk of corruption in the DRC and its reliance on individuals and entities
associated with Dan Gertler. Adverse findings were also made against
certain of its former directors and officers (“FDOs”).
KML agreed to make voluntary payments to the OSC totalling C$30m
and to submit to a review by an independent consultant of its metal
accounting. The FDOs have been subjected to fines and costs orders
and director and officer bans of up to C$2.5m and six years.
6. In December 2018, investigations were commenced relating to
transactions in Brazil with Petrobras by a number of trading companies,
including Glencore.
7. Other investigations concerning Glencore which commenced during
the year include an investigation by PRC authorities into shipments
of lead materials into China.
8. See Risk 3 opposite concerning adverse tax matters.
Mitigating factors
We seek to ensure compliance through our commitment to complying
with or exceeding the laws and external requirements applicable
to our operations and products and through monitoring of legislative
requirements, engagement with government and regulators, and
compliance with the terms of permits and licences.
We seek to mitigate the risk of breaching applicable laws and external
requirements through our risk management framework which is described
on page 104. The Group has dedicated Legal and Compliance resources
in place and internal policies, procedures and control with compliance to
assist Group businesses. Furthermore, the Group conducts training and
awareness, with active monitoring. However, there can be no assurance that
such policies, procedures and controls will adequately protect the Group
against fraud, corruption, sanctions breaches or other unlawful activities.
In response to the heightened risks, the Board has established a committee
that focuses on monitoring ethics and compliance, and seeking to ensure
that business practices are aligned with the Company’s culture, see
page 100.
29
Glencore Annual Report 2018
Strategic
Report
Financial
statements
Governance
Additional
information
32. External risks continued
5
Liquidity Risk movement in 2018: Stable
Link to strategic priorities
Risk appetite
Low. It is the Group’s policy to operate a BBB
rating or above balance sheet and to ensure
that a minimum level of cash and/or committed
funding is available at any given time.
Risk description
Our failure to access funds (liquidity)
would severely limit our ability to engage
in desired activities.
Liquidity risk is the risk that we are unable
to meet our payment obligations when due,
or are unable, on an ongoing basis, to borrow
funds in the market at an acceptable price to
fund our commitments. While we adjust our
minimum internal liquidity threshold from
time to time in response to changes in market
conditions, this minimum internal liquidity
target may be breached due to circumstances
we are unable to control, such as general market
disruptions, sharp movements in commodity
prices or an operational problem that affects
our suppliers, customers or ourselves.
Comments/impacts to the Group
A lack of liquidity may mean that we will not have sufficient funds available
for our marketing and industrial activities, both of which employ substantial
amounts of capital. If we do not have funds available for these activities
then they will decrease.
This is particularly the case during the current period when the
US Federal Reserve and European Central Bank are adopting tighter
monetary policies, which could lead to the credit markets contracting
and becoming more expensive.
Note 26 details our financial and capital risk management including
liquidity risk.
Note 28 details the fair value of our financial assets and liabilities.
Mitigating factors
In light of the Group’s extensive funding activities, maintaining investment
grade credit rating status is a financial priority. The Group’s credit ratings are
currently Baa2 (positive outlook) from Moody’s and BBB+ (stable outlook)
from Standard Poor’s. Glencore’s publicly stated objective, as part of its
overall financial policy package, is to seek and maintain strong Baa/BBB
credit ratings from Moody’s and Standard Poor’s respectively. In support
of this, Glencore targets a maximum 2x Net debt/Adjusted EBITDA ratio
through the cycle, augmented by an upper Net debt cap of ~$16 billion. This
financial policy facilitates access to funds, even in periods of market volatility.
The Financial Review on page 52 sets out the Group’s Net Funding
and Net Debt in 2018. However, it should be noted that the credit ratings
agencies apply a haircut to the value of our RMI, such that their calculated
net debt is higher.
We remain cognisant that access to credit is vital and that market
conditions can change rapidly. As such, we have over the years reduced
our bond portfolio significantly and optimised our bond debt maturity
profile to no more than c.$3 billion of bonds maturing per annum.
As at 31 December 2018, the Group had available undrawn committed
credit facilities and cash amounting to $10.2 billion (31 December 2017:
$12.8 billion), comfortably ahead of our $3 billion minimum prescribed level.
Business risks
6
Counterparty credit and performance Risk movement in 2018: Stable
Link to strategic priorities
Risk appetite
Low. Where possible, credit exposure is
covered through credit mitigation products.
Risk description
Financial assets consisting principally
of receivables and advances, derivative
instruments and long-term advances and
loans can expose us to concentrations of
credit risk.
Furthermore, we are subject to
non-performance risk by our suppliers,
customers and hedging counterparties,
in particular via our marketing activities.
Comments/impacts to the Group
Non-performance by suppliers, customers and hedging counterparties
may occur and cause losses in a range of situations, such as:
•
A significant increase in commodity prices resulting in suppliers being
unwilling to honour their contractual commitments to sell commodities
at pre-agreed prices
•
A significant reduction in commodity prices resulting in customers
being unwilling or unable to honour their contractual commitments
to purchase commodities at pre-agreed prices
• Suppliers subject to prepayment or hedging counterparties may find
themselves unable to honour their contractual obligations due to
financial distress or other reasons
Mitigating factors
We monitor the credit quality of our counterparties and seek to reduce
the risk of customer non-performance by requiring credit support from
creditworthy financial institutions including making extensive use of
credit enhancement products, such as letters of credit, bank guarantees
and insurance policies. Specific credit risk policy rules apply to open
account risk with an established threshold for referral of credit positions
by departments to central management. In addition, note 26 details
our financial and capital risk management approach.
Principal risks and uncertainties continued
Glencore Annual Report 2018
30