Integration of the MODFLOW Lak7 package in the FREEWAT GIS modelling environment
Gersz_CTView_GY2015
1. Visualizing Sea Level Rise: Connecticut’s Coast
Luke Gersz
Natural Resources & the Environment
University of Connecticut
This project’s goal was to create a repeatable process that allows one to form
a sea-level rise visualization. A working visualization would be available online
for easy access, common use and involving interactive manipulation.
Application areas include emergency services, public awareness and future
storm surge visualization.
PROJECT SUMMARY
http://ctview.uconn.edu http://americaview.org
METHODS
The appropriate data files had to be collected and organized:
• LiDAR Data
• Raster Data sets
• Connecticut Base Maps
• Connecticut Road Shapefiles
• Raw elevation Data
Correlation between data files had to be insured. Increments within the X, Y and
Z planes were all converted into foot measurements for more usable results and
common understanding.
A smaller study area along the Connecticut coastline was created to aid in the
process formulation, due to potentially large processing times at all steps in the
visualization development. A study area between and including the Thames and
Connecticut Rivers was selected due to its large hydrography and potential for
displaying the power of this visualization process.
A bare earth flooding model had to be created for a base comparison tool. This
elevation file required editing in order to assure proper water movement through
varying increases of sea level. All bridges within the study area had to be edited
out of the elevation profile in order to allow the water underneath to correctly
flow during a pixel growing process. Using editing capabilities of ERDAS
Imagine these pixels within the bridge were all changed to correspond to the
water height pixel value underneath.
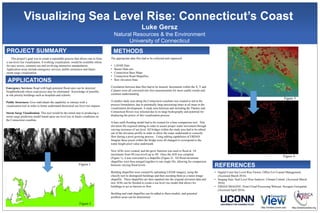
New AOIs were created, and the grow function was used to flood at .1ft
increments from 0ft (sea level) up to 4ft. Once the AOI was complete
(Figure 1), it was converted to a shapefile (Figure 2). All flood increment
shapefiles were then merged together to one single file, allowing for comparison
between varying flood levels.
Building shapefiles were created by uploading LiDAR imagery, using the
classify tool to distinguish buildings and then recoding them as a raster image
shapefile. These shapefiles are then inputted into the original elevation data and
new AOIs can be flooded to create a sea level rise model that allows for
buildings to act as barriers to flow.
Building and road shapefiles can be added to these models, and potential
problem areas can be determined.
Emergency Services: Road with high potential flood rates can be detected.
Neighborhoods where road access may be eliminated. Knowledge of possible
at risk priority buildings such as hospitals and schools.
Public Awareness: Give individuals the capability to interact with a
visualization tool in order to better understand theoretical sea level rise impacts
Storm Surge Visualization: This tool would be the initial step in producing a
storm surge prediction model based upon sea level rise in future conditions on
the Connecticut coastline.
APPLICATIONS
CONCLUSIONS
• Digital Coast Sea Level Rise Viewer. Office For Coastal Management.
(Accessed March 2016)
• Surging Seas: Seal Level Rise Analysis. Climate Central. (Accessed March
2016)
• ERDAS IMAGINE: Point Cloud Processing Webcast. Hexagon Geospatial.
(Accessed April 2016)
REFERENCESFigure 1
Figure 2
Figure 3
Figure 4