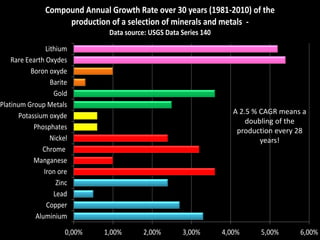
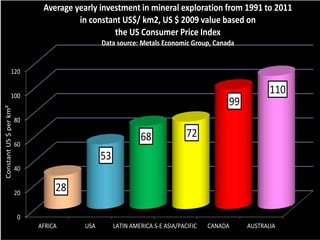
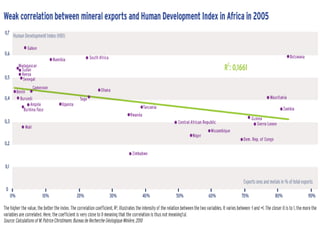
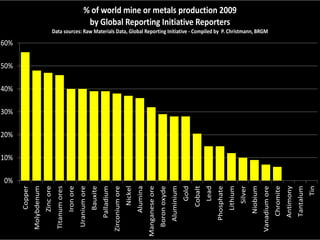
Raw materials demand today and tomorrow :
perspectives for the Africa/ ACP –EU cooperation

            GeoArena 2012 Conference
           Uppsala, October 16-17, 2012

                    Dr. Patrice Christmann
          Deputy-Director, Corporate Strategy, BRGM
                   p.christmann@brgm.fr
Compound Annual Growth Rate over 30 years (1981-2010) of the
                      production of a selection of minerals and metals -
                                   Data source: USGS Data Series 140

                 Lithium
    Rare Eearth Oxydes
           Boron oxyde
                   Barite
                    Gold
Platinum Group Metals
                                                                          A 2.5 % CAGR means a
       Potassium oxyde
                                                                              doubling of the
            Phosphates                                                     production every 28
                   Nickel                                                         years!
               Chrome
            Manganese
                Iron ore
                     Zinc
                    Lead
                 Copper
             Aluminium
       samedi 20 octobre 2012             Nom du service émetteur                         >2
                          0,00%   1,00%       2,00%           3,00%    4,00%     5,00%      6,00%
Average yearly investment in mineral exploration from 1991 to 2011
                                       in constant US$/ km2, US $ 2009 value based on
                                                 the US Consumer Price Index
                                               Data source: Metals Economic Group, Canada


                120


                100
                                                                                                      110
                                                                                          99
Constant US $ per km²


                        80

                                                             68               72
                        60
                                               53
                        40


                        20
                                  28

                        0
                             AFRICA      USA        LATIN AMERICA S-E ASIA/PACIFIC   CANADA    AUSTRALIA
% of world mine or metals production 2009
                                                                        by Global Reporting Initiative Reporters
                                    Data sources: Raw Materials Data, Global Reporting Initiative - Compiled by P. Christmann, BRGM

60%

50%

40%

30%

20%

10%

0%
                                                                                                                                                                       Aluminium
       Copper


                                                                                                                                                                                                                                Silver


                                                                                                                                                                                                                                                                  Chromite


                                                                                                                                                                                                                                                                                                   Tin
                                                                                                                      Nickel


                                                                                                                                                                                                                                                                             Antimony
                                                                                                                                                                                                                                         Niobium
                                        Titanum ores


                                                                                                                               Alumina


                                                                                                                                                                                          Cobalt


                                                                                                                                                                                                                                                   Vanadium ore
                                                                  Uranium ore
                Molybdenum


                                                                                                                                                                                   Gold


                                                                                                                                                                                                   Lead
                             Zinc ore


                                                                                                                                                                                                          Phosphate
                                                                                                                                                                                                                      Lithium
                                                       Iron ore


                                                                                                                                                                                                                                                                                        Tantalum
                                                                                Bauxite


                                                                                                      Zirconium ore


                                                                                                                                                         Boron oxyde
                                                                                          Palladium


                                                                                                                                         Manganese ore


      samedi 20 octobre 2012                                                                                               Nom du service émetteur                                                                                                                                      >5

Raw materials demand today and tomorrow: perspectives for the Africa/ACP-EU cooperation. Patrice Christmann, BRGM

  • 1.
    Raw materials demandtoday and tomorrow : perspectives for the Africa/ ACP –EU cooperation GeoArena 2012 Conference Uppsala, October 16-17, 2012 Dr. Patrice Christmann Deputy-Director, Corporate Strategy, BRGM p.christmann@brgm.fr
  • 2.
    Compound Annual GrowthRate over 30 years (1981-2010) of the production of a selection of minerals and metals - Data source: USGS Data Series 140 Lithium Rare Eearth Oxydes Boron oxyde Barite Gold Platinum Group Metals A 2.5 % CAGR means a Potassium oxyde doubling of the Phosphates production every 28 Nickel years! Chrome Manganese Iron ore Zinc Lead Copper Aluminium samedi 20 octobre 2012 Nom du service émetteur >2 0,00% 1,00% 2,00% 3,00% 4,00% 5,00% 6,00%
  • 3.
    Average yearly investmentin mineral exploration from 1991 to 2011 in constant US$/ km2, US $ 2009 value based on the US Consumer Price Index Data source: Metals Economic Group, Canada 120 100 110 99 Constant US $ per km² 80 68 72 60 53 40 20 28 0 AFRICA USA LATIN AMERICA S-E ASIA/PACIFIC CANADA AUSTRALIA
  • 5.
    % of worldmine or metals production 2009 by Global Reporting Initiative Reporters Data sources: Raw Materials Data, Global Reporting Initiative - Compiled by P. Christmann, BRGM 60% 50% 40% 30% 20% 10% 0% Aluminium Copper Silver Chromite Tin Nickel Antimony Niobium Titanum ores Alumina Cobalt Vanadium ore Uranium ore Molybdenum Gold Lead Zinc ore Phosphate Lithium Iron ore Tantalum Bauxite Zirconium ore Boron oxyde Palladium Manganese ore samedi 20 octobre 2012 Nom du service émetteur >5