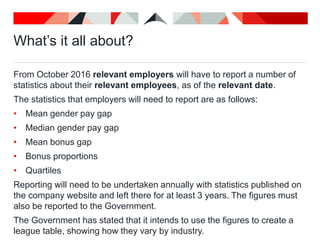
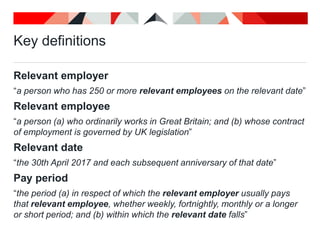
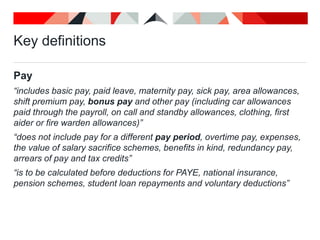
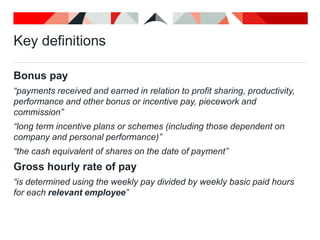
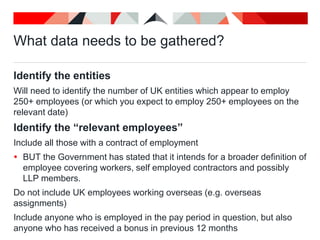
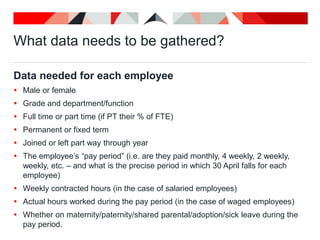
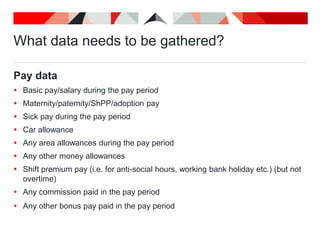
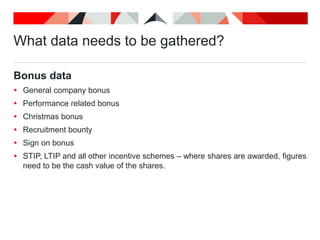
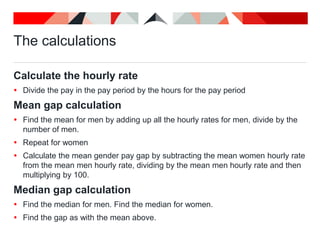
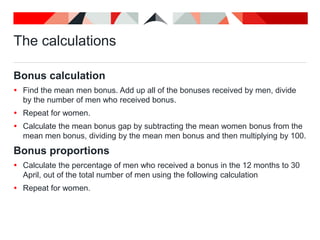
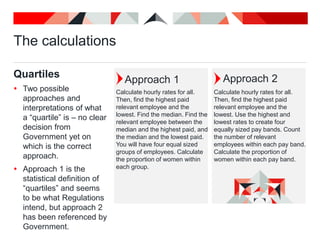
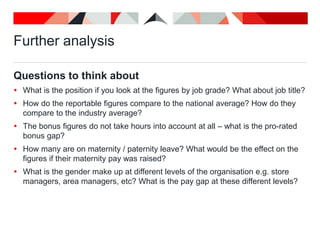
Gender pay
gap reporting
lewissilkinemployment.com
Contents
 What’s it all about?
 Key definitions
 What data needs to be gathered?
 What calculations need to be made?
 Further analysis
 What to do now
What’s it all about?
01
What’s it all about?
From October 2016 relevant employers will have to report a number of
statistics about their relevant employees, as of the relevant date.
The statistics that employers will need to report are as follows:
• Mean gender pay gap
• Median gender pay gap
• Mean bonus gap
• Bonus proportions
• Quartiles
Reporting will need to be undertaken annually with statistics published on
the company website and left there for at least 3 years. The figures must
also be reported to the Government.
The Government has stated that it intends to use the figures to create a
league table, showing how they vary by industry.
Key definitions
(according to the draft
regulations)
02
Key definitions
Relevant employer
“a person who has 250 or more relevant employees on the relevant date”
Relevant employee
“a person (a) who ordinarily works in Great Britain; and (b) whose contract
of employment is governed by UK legislation”
Relevant date
“the 30th April 2017 and each subsequent anniversary of that date”
Pay period
“the period (a) in respect of which the relevant employer usually pays
that relevant employee, whether weekly, fortnightly, monthly or a longer
or short period; and (b) within which the relevant date falls”
Key definitions
Pay
“includes basic pay, paid leave, maternity pay, sick pay, area allowances,
shift premium pay, bonus pay and other pay (including car allowances
paid through the payroll, on call and standby allowances, clothing, first
aider or fire warden allowances)”
“does not include pay for a different pay period, overtime pay, expenses,
the value of salary sacrifice schemes, benefits in kind, redundancy pay,
arrears of pay and tax credits”
“is to be calculated before deductions for PAYE, national insurance,
pension schemes, student loan repayments and voluntary deductions”
Key definitions
Bonus pay
“payments received and earned in relation to profit sharing, productivity,
performance and other bonus or incentive pay, piecework and
commission”
“long term incentive plans or schemes (including those dependent on
company and personal performance)”
“the cash equivalent of shares on the date of payment”
Gross hourly rate of pay
“is determined using the weekly pay divided by weekly basic paid hours
for each relevant employee”
What data needs to be
gathered?
Subhead style
03
What data needs to be gathered?
Identify the entities
Will need to identify the number of UK entities which appear to employ
250+ employees (or which you expect to employ 250+ employees on the
relevant date)
Identify the “relevant employees”
Include all those with a contract of employment
 BUT the Government has stated that it intends for a broader definition of
employee covering workers, self employed contractors and possibly
LLP members.
Do not include UK employees working overseas (e.g. overseas
assignments)
Include anyone who is employed in the pay period in question, but also
anyone who has received a bonus in previous 12 months
What data needs to be gathered?
Data needed for each employee
 Male or female
 Grade and department/function
 Full time or part time (if PT their % of FTE)
 Permanent or fixed term
 Joined or left part way through year
 The employee’s “pay period” (i.e. are they paid monthly, 4 weekly, 2 weekly,
weekly, etc. – and what is the precise period in which 30 April falls for each
employee)
 Weekly contracted hours (in the case of salaried employees)
 Actual hours worked during the pay period (in the case of waged employees)
 Whether on maternity/paternity/shared parental/adoption/sick leave during the
pay period.
What data needs to be gathered?
Pay data
 Basic pay/salary during the pay period
 Maternity/paternity/ShPP/adoption pay
 Sick pay during the pay period
 Car allowance
 Any area allowances during the pay period
 Any other money allowances
 Shift premium pay (i.e. for anti-social hours, working bank holiday etc.) (but not
overtime)
 Any commission paid in the pay period
 Any other bonus pay paid in the pay period
What data needs to be gathered?
Bonus data
 General company bonus
 Performance related bonus
 Christmas bonus
 Recruitment bounty
 Sign on bonus
 STIP, LTIP and all other incentive schemes – where shares are awarded, figures
need to be the cash value of the shares.
What calculations do
you need to make?
A step by step guide
04
The calculations
Calculate the hourly rate
 Divide the pay in the pay period by the hours for the pay period
Mean gap calculation
 Find the mean for men by adding up all the hourly rates for men, divide by the
number of men.
 Repeat for women
 Calculate the mean gender pay gap by subtracting the mean women hourly rate
from the mean men hourly rate, dividing by the mean men hourly rate and then
multiplying by 100.
Median gap calculation
 Find the median for men. Find the median for women.
 Find the gap as with the mean above.
The calculations
Bonus calculation
 Find the mean men bonus. Add up all of the bonuses received by men, divide
by the number of men who received bonus.
 Repeat for women.
 Calculate the mean bonus gap by subtracting the mean women bonus from the
mean men bonus, dividing by the mean men bonus and then multiplying by 100.
Bonus proportions
 Calculate the percentage of men who received a bonus in the 12 months to 30
April, out of the total number of men using the following calculation
 Repeat for women.
The calculations
Quartiles
 Two possible
approaches and
interpretations of what
a “quartile” is – no clear
decision from
Government yet on
which is the correct
approach.
 Approach 1 is the
statistical definition of
“quartiles” and seems
to be what Regulations
intend, but approach 2
has been referenced by
Government.
Calculate hourly rates for all.
Then, find the highest paid
relevant employee and the
lowest. Find the median. Find the
relevant employee between the
median and the highest paid, and
the median and the lowest paid.
You will have four equal sized
groups of employees. Calculate
the proportion of women within
each group.
Calculate hourly rates for all.
Then, find the highest paid
relevant employee and the
lowest. Use the highest and
lowest rates to create four
equally sized pay bands. Count
the number of relevant
employees within each pay band.
Calculate the proportion of
women within each pay band.
Approach 1 Approach 2
Further analysis
What other analysis could be
done to give context to the
reportable figures?
05
Further analysis
Questions to think about
 What is the position if you look at the figures by job grade? What about job title?
 How do the reportable figures compare to the national average? How do they
compare to the industry average?
 The bonus figures do not take hours into account at all – what is the pro-rated
bonus gap?
 How many are on maternity / paternity leave? What would be the effect on the
figures if their maternity pay was raised?
 What is the gender make up at different levels of the organisation e.g. store
managers, area managers, etc? What is the pay gap at these different levels?
Further analysis
Questions to think about
 How much does regionality affect the gap? I.e. if there are different rates paid
for the same role across the country, are more women working in lower paid
parts of the country than in higher paid parts e.g. London?
 What is the pay gap by age? (ONS statistics say there is no gender pay gap for
under 40 year olds.)
 Is length of service a factor? Is there a problem with staff turnover that is
affecting the reportable figures?
 Is there an even gender split in the highest paying roles? If not, how would the
figures be different if there were?
What to do now
What can employers be doing
to prepare?
06
What to do now
Carry out a dry run using data for 30 April 2016
 These figures will not be reportable and this provides an opportunity to see if
there will be problems in the future
Identify any areas of uncertainty over who is in scope
Think about employment status and who is a “relevant
employee”
Consider remuneration packages and benefits
 Salary sacrifice could be used to reduce the value
Audit bonus schemes
Identify who will sign the statement confirming the accuracy of
the figures
Get your house in order
Thank you
Go to lewissilkinemployment.com
to find out more about our gender
pay gap reporting services,
or contact
genderpaygap@lewissilkin.com
All information contained within is correct as of 22 May 2016

Gender pay gap reporting

  • 1.
  • 2.
    Contents  What’s itall about?  Key definitions  What data needs to be gathered?  What calculations need to be made?  Further analysis  What to do now
  • 3.
    What’s it allabout? 01
  • 4.
    What’s it allabout? From October 2016 relevant employers will have to report a number of statistics about their relevant employees, as of the relevant date. The statistics that employers will need to report are as follows: • Mean gender pay gap • Median gender pay gap • Mean bonus gap • Bonus proportions • Quartiles Reporting will need to be undertaken annually with statistics published on the company website and left there for at least 3 years. The figures must also be reported to the Government. The Government has stated that it intends to use the figures to create a league table, showing how they vary by industry.
  • 5.
    Key definitions (according tothe draft regulations) 02
  • 6.
    Key definitions Relevant employer “aperson who has 250 or more relevant employees on the relevant date” Relevant employee “a person (a) who ordinarily works in Great Britain; and (b) whose contract of employment is governed by UK legislation” Relevant date “the 30th April 2017 and each subsequent anniversary of that date” Pay period “the period (a) in respect of which the relevant employer usually pays that relevant employee, whether weekly, fortnightly, monthly or a longer or short period; and (b) within which the relevant date falls”
  • 7.
    Key definitions Pay “includes basicpay, paid leave, maternity pay, sick pay, area allowances, shift premium pay, bonus pay and other pay (including car allowances paid through the payroll, on call and standby allowances, clothing, first aider or fire warden allowances)” “does not include pay for a different pay period, overtime pay, expenses, the value of salary sacrifice schemes, benefits in kind, redundancy pay, arrears of pay and tax credits” “is to be calculated before deductions for PAYE, national insurance, pension schemes, student loan repayments and voluntary deductions”
  • 8.
    Key definitions Bonus pay “paymentsreceived and earned in relation to profit sharing, productivity, performance and other bonus or incentive pay, piecework and commission” “long term incentive plans or schemes (including those dependent on company and personal performance)” “the cash equivalent of shares on the date of payment” Gross hourly rate of pay “is determined using the weekly pay divided by weekly basic paid hours for each relevant employee”
  • 9.
    What data needsto be gathered? Subhead style 03
  • 10.
    What data needsto be gathered? Identify the entities Will need to identify the number of UK entities which appear to employ 250+ employees (or which you expect to employ 250+ employees on the relevant date) Identify the “relevant employees” Include all those with a contract of employment  BUT the Government has stated that it intends for a broader definition of employee covering workers, self employed contractors and possibly LLP members. Do not include UK employees working overseas (e.g. overseas assignments) Include anyone who is employed in the pay period in question, but also anyone who has received a bonus in previous 12 months
  • 11.
    What data needsto be gathered? Data needed for each employee  Male or female  Grade and department/function  Full time or part time (if PT their % of FTE)  Permanent or fixed term  Joined or left part way through year  The employee’s “pay period” (i.e. are they paid monthly, 4 weekly, 2 weekly, weekly, etc. – and what is the precise period in which 30 April falls for each employee)  Weekly contracted hours (in the case of salaried employees)  Actual hours worked during the pay period (in the case of waged employees)  Whether on maternity/paternity/shared parental/adoption/sick leave during the pay period.
  • 12.
    What data needsto be gathered? Pay data  Basic pay/salary during the pay period  Maternity/paternity/ShPP/adoption pay  Sick pay during the pay period  Car allowance  Any area allowances during the pay period  Any other money allowances  Shift premium pay (i.e. for anti-social hours, working bank holiday etc.) (but not overtime)  Any commission paid in the pay period  Any other bonus pay paid in the pay period
  • 13.
    What data needsto be gathered? Bonus data  General company bonus  Performance related bonus  Christmas bonus  Recruitment bounty  Sign on bonus  STIP, LTIP and all other incentive schemes – where shares are awarded, figures need to be the cash value of the shares.
  • 14.
    What calculations do youneed to make? A step by step guide 04
  • 15.
    The calculations Calculate thehourly rate  Divide the pay in the pay period by the hours for the pay period Mean gap calculation  Find the mean for men by adding up all the hourly rates for men, divide by the number of men.  Repeat for women  Calculate the mean gender pay gap by subtracting the mean women hourly rate from the mean men hourly rate, dividing by the mean men hourly rate and then multiplying by 100. Median gap calculation  Find the median for men. Find the median for women.  Find the gap as with the mean above.
  • 16.
    The calculations Bonus calculation Find the mean men bonus. Add up all of the bonuses received by men, divide by the number of men who received bonus.  Repeat for women.  Calculate the mean bonus gap by subtracting the mean women bonus from the mean men bonus, dividing by the mean men bonus and then multiplying by 100. Bonus proportions  Calculate the percentage of men who received a bonus in the 12 months to 30 April, out of the total number of men using the following calculation  Repeat for women.
  • 17.
    The calculations Quartiles  Twopossible approaches and interpretations of what a “quartile” is – no clear decision from Government yet on which is the correct approach.  Approach 1 is the statistical definition of “quartiles” and seems to be what Regulations intend, but approach 2 has been referenced by Government. Calculate hourly rates for all. Then, find the highest paid relevant employee and the lowest. Find the median. Find the relevant employee between the median and the highest paid, and the median and the lowest paid. You will have four equal sized groups of employees. Calculate the proportion of women within each group. Calculate hourly rates for all. Then, find the highest paid relevant employee and the lowest. Use the highest and lowest rates to create four equally sized pay bands. Count the number of relevant employees within each pay band. Calculate the proportion of women within each pay band. Approach 1 Approach 2
  • 18.
    Further analysis What otheranalysis could be done to give context to the reportable figures? 05
  • 19.
    Further analysis Questions tothink about  What is the position if you look at the figures by job grade? What about job title?  How do the reportable figures compare to the national average? How do they compare to the industry average?  The bonus figures do not take hours into account at all – what is the pro-rated bonus gap?  How many are on maternity / paternity leave? What would be the effect on the figures if their maternity pay was raised?  What is the gender make up at different levels of the organisation e.g. store managers, area managers, etc? What is the pay gap at these different levels?
  • 20.
    Further analysis Questions tothink about  How much does regionality affect the gap? I.e. if there are different rates paid for the same role across the country, are more women working in lower paid parts of the country than in higher paid parts e.g. London?  What is the pay gap by age? (ONS statistics say there is no gender pay gap for under 40 year olds.)  Is length of service a factor? Is there a problem with staff turnover that is affecting the reportable figures?  Is there an even gender split in the highest paying roles? If not, how would the figures be different if there were?
  • 21.
    What to donow What can employers be doing to prepare? 06
  • 22.
    What to donow Carry out a dry run using data for 30 April 2016  These figures will not be reportable and this provides an opportunity to see if there will be problems in the future Identify any areas of uncertainty over who is in scope Think about employment status and who is a “relevant employee” Consider remuneration packages and benefits  Salary sacrifice could be used to reduce the value Audit bonus schemes Identify who will sign the statement confirming the accuracy of the figures Get your house in order
  • 23.
    Thank you Go tolewissilkinemployment.com to find out more about our gender pay gap reporting services, or contact genderpaygap@lewissilkin.com All information contained within is correct as of 22 May 2016