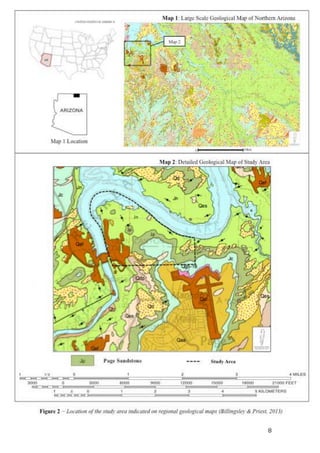
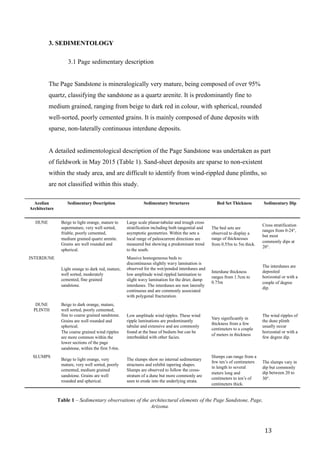
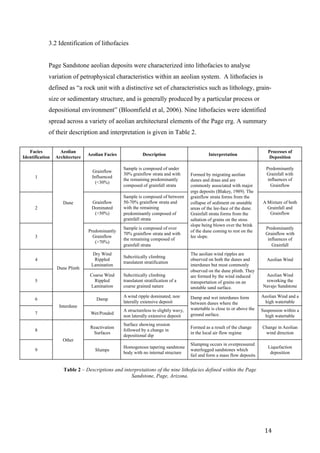
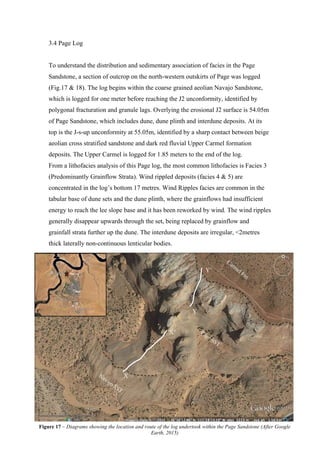
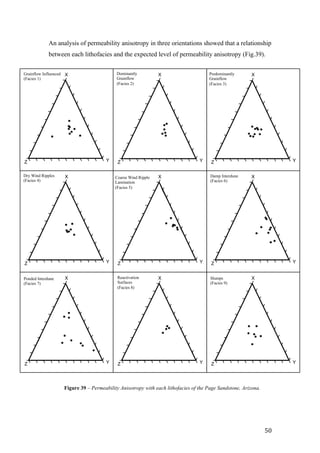
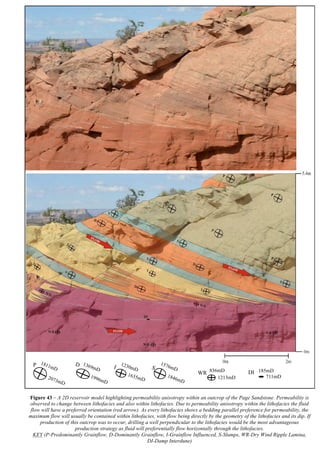
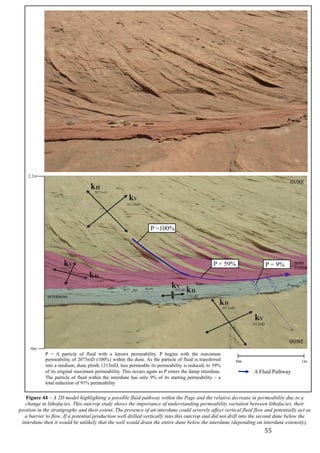
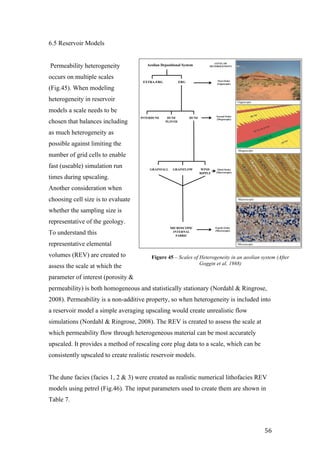
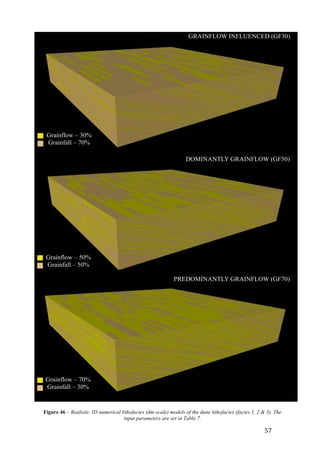
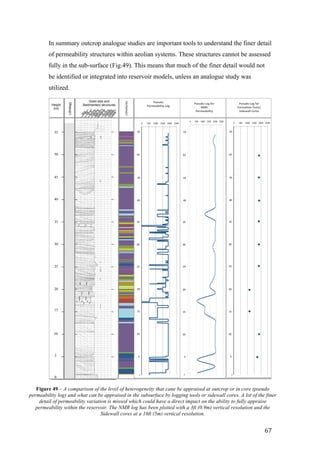
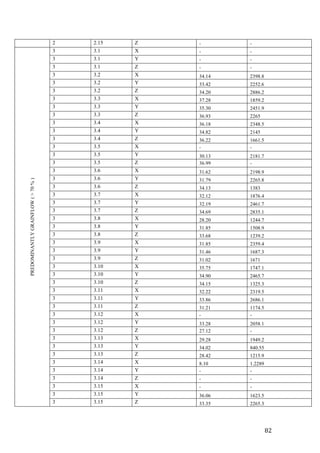
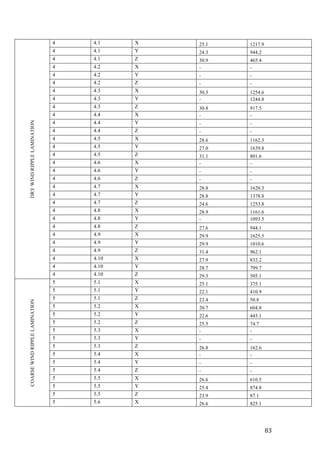
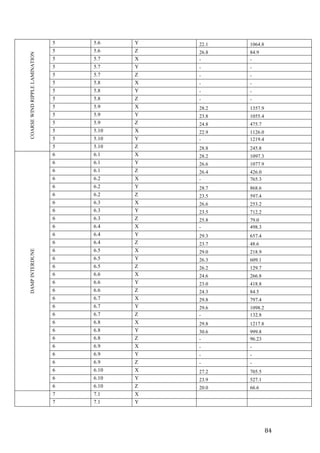
This document summarizes a study of permeability heterogeneity in an aeolian sandstone reservoir. Fieldwork identified 9 lithofacies in the Page Sandstone formation in Arizona based on sedimentary structures. Core samples were taken from each lithofacies and tested for petrophysical properties including permeability and porosity. Permeability was found to vary over 3 orders of magnitude between lithofacies and architectural elements. Permeability was also found to be anisotropic, with higher values parallel versus perpendicular to bedding. The permeability heterogeneity observed has implications for reservoir modeling and production from aeolian reservoirs that were previously considered homogeneous.


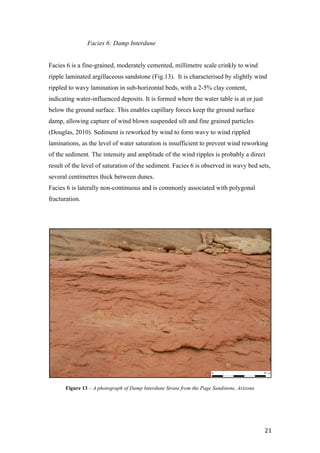
![9
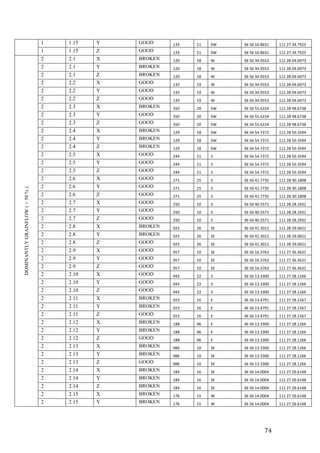
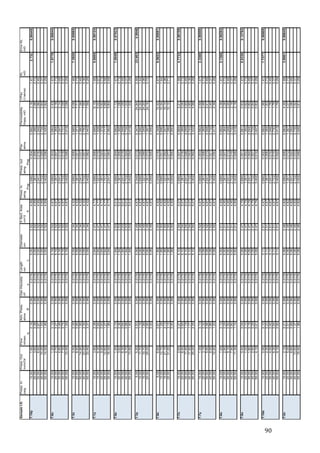
Table&1.!Age!and!elevation!of!floodplain!and!terrace1gra
River!from!Glen!Canyon!Dam!to!Badger!Rapids,!a!25!m
Refer!to!locations!of!separate!older!terrace1gravel!depos
Map$unit Age
Qf Holocene
Qg1
Young!and!intermediate!terrace1gravel!
Floodplain!deposits
Older!terrace1gravel!deposits
Holocene
Qg2 Holocene
Qg3 Holocene
Qg4 Holocene!and!Pleistocene(?)
Qg5 Holocene!and!Pleistocene(?)
Qg6 Holocene(?)!and!Pleistocene
Qg7 Pleistocene
Qg8 Pleistocene
Qg9 Pleistocene
Qg9a Pleistocene
Qg10 Pleistocene
Qg11 Pleistocene
Qg12 Pleistocene
Qg13 Pleistocene
Qg14 Pleistocene
Qg15 Pleistocene
Qg16 Pleistocene!and!Pliocene(?)
Qg17 Pleistocene!and!Pliocene(?)
Qg18 Pleistocene!and!Pliocene(?)
112°00'
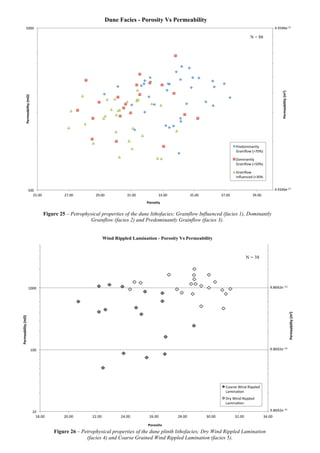
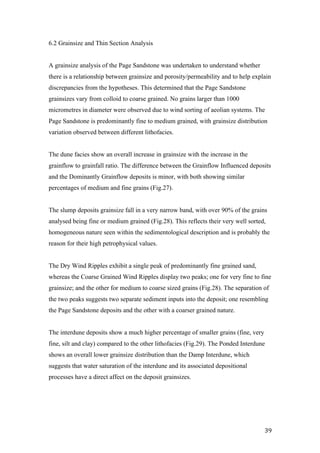
111°00'
37°00'
36°30'
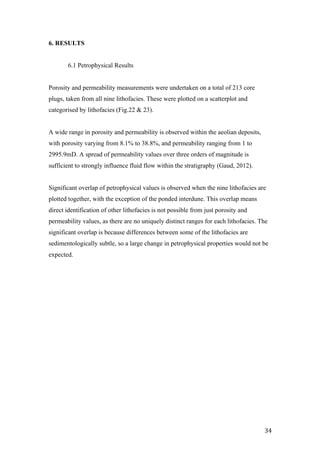
Marble
Canyon
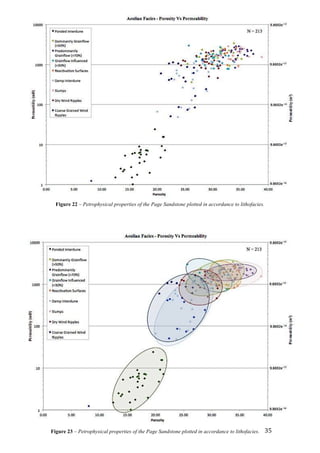
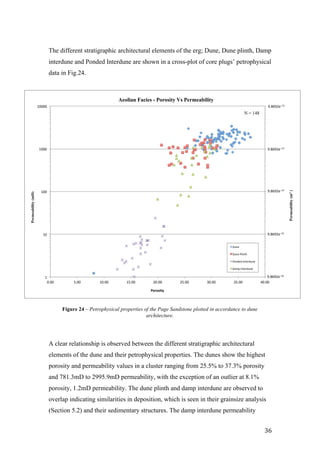
Vermilion
Cliffs!Lodge
Cliff
Dwellers
Lodge
Lees!Ferry
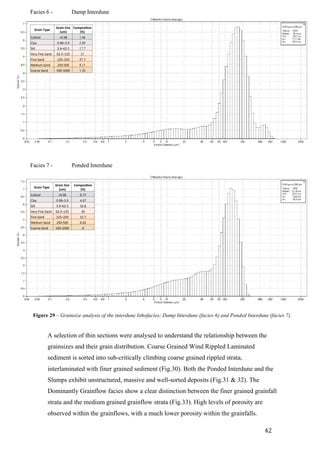
LeChee
Copper!Mine
Page
Kaibito
RAINBOW
PLATEAU
PARIA PLATEAU
Ferry Swale
Vermilion
Cliffs
STRIP
ARIZONA
MARBLE PLATEAU
NAVAJO&&INDIAN
RESERVATIONHouse Rock Valley
VERMILION&CLIFFS
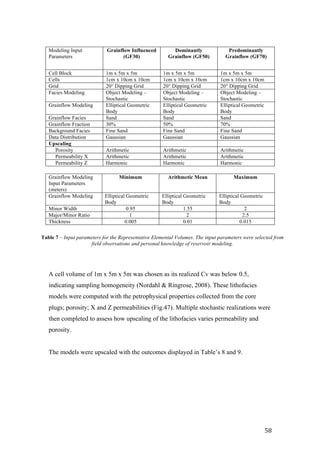
NATIONAL&MONUMENT
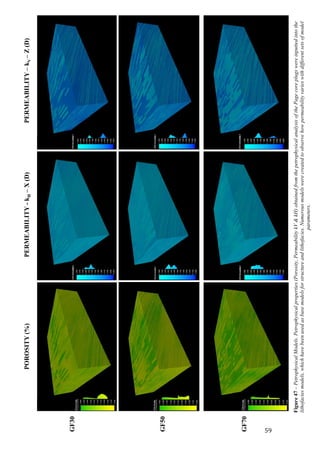
Glen
Canyon
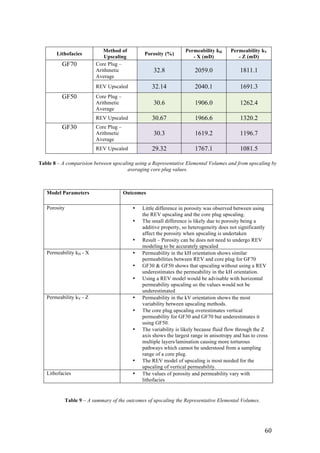
Dam
GLEN&CANYON
NRA
89
89A
98
LeChee Rock
Tse Esgizii Butte
Cummings
Mesa
Kaibito
Creek
Creek
Navajo
C
olorado2River
Paria2River
KAIBITO
PLATEAU
COW1SPRINGS
SYNCLINE
PRESTON1MESA
ANTICLINE
TUBA1CITY
SYNCLINE
ECHO1CLIFFS
MONOCLINE
EMINENCE
BREAK1FAULT
FENCE
FAULT
LIMESTONE
RIDGE
ANTICLINE
PARIA1PLATEAU1SYNCLINE
LAST
CHANCE
ANTICLINE
RED1LAKE
MONOCLINE
KAIBITO
SYNCLINE
F
F
F
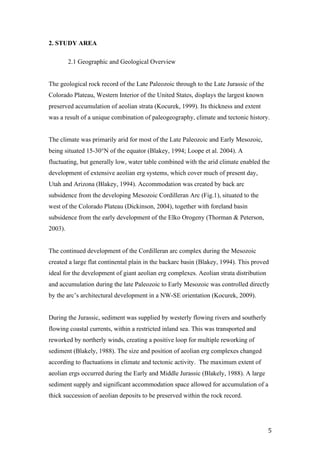
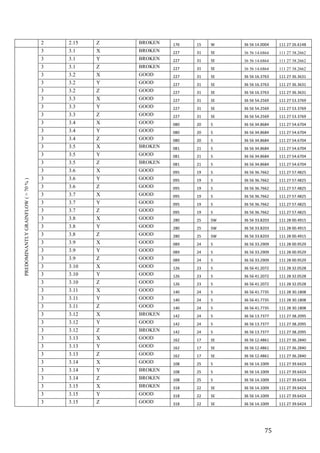
Figure&1.!Map!of!the!Glen!Canyon!Dam!30’!x!60’!quadrangle!showing!cultural!and!physiographic!features!as!well!as!major!geologic!structures.
Boxes!define!area!of!maps!in!figure!2.
Cedar
Mountain
Echo
Cliffs
GRAND&CANYON
NATIONAL&PARK
Bitter!Springs
89
White
Mesa
2B
2A
Geologic Map of the Glen Ca
Ph
Pc
Pe
Ms
Mr
Ms
co
cp
Jn
Jk
Jks
Jm
cs
mu
ms
mlm
Pkh
Pkf
Pt
Jcu
Jc
JpJcj
Je
Jr
Jms
Km
Kd
Qg3 Qa3
Qv Qtr Ql
Qg4
Qa4 Qg5-18
Tgs
QdpQdQes QdlQsQaf Qf Qg1QdluQdb Qdm Qa2Qg2Qa1 Qps Qae
Pliocene
Upper
Triassic
Lower!Triassic
Middle(?)!and
Lower!Triassic
Cisuralian
Middle!Jurassic
Lower!Jurassic
Glen
Canyon
Group
San
Rafael
Group
Holocene
Pleistocene
QUATERNARY
JURASSIC
TRIASSIC
PERMIAN
CORRELATION&OF&MAP&UNITS
SURFICIAL&DEPOSITS
SEDIMENTARY&ROCKS
TERTIARY
Upper
Cretaceous
Unconformity
Unconformity
Unconformity
Unconformity
Unconformity
Unconformity
Unconformity
Unconformity
Unconformity
Unconformity
Unconformity
Unconformity
Unconformity
Unconformity
Unconformity
Upper!and!Lower
Mississippian
MISSISSIPPIAN
CRETACEOUS
Upper,!Middle!and
Lower!Pennsylvanian
and!Upper
Mississippian
Upper!Mississippian
PENNSYLVANIAN
Supai
Group
Miocene
Upper!Jurassic
National P
U.S. Department of the Interior
U.S. Geological Survey
Qg14
Qg1
Qg13
Qg5Qg6
Qg5
Qg6
Qg5
BA
111°37'30''
36°52'30''
111°30'
35
35
?
M
M ?
F
F
F
oo
Qf
Qs
Qaf
Qd
Qes
Qdp
Qdb
Qdl
Jk
Kd
Km
Je
Jks
Jc
Jms
Jr
Jn
Jp
Jcj
Jcu
Jm
co
cp
cs
mu
ms
mlm
Pkh
Pkf
Pt
Pc
Ph
Pe
ms
Ms
Mr
Qa4
Qg4
Tgs
Qae
Qps
Qa3
Qg3
Ql
Qg5-18
Qtr
Qv
Qg2
Qa2
Qa1
Qg1
Qdlu
Qdm
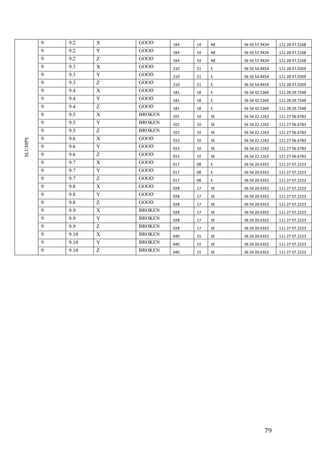
LIST&OF&MAP&UNITS
[Some!map!units!are!too!small!to!distinguish!unit!identification!by!color.!These!units!are!labeled!
where!possible`!all!units!are!attributed!in!the!geodatabase]
SURFICIAL&DEPOSITS
Artificial&fill&and&quarries&(Holocene)
StreamMchannel&deposits&(Holocene)
Floodplain&deposits&(Holocene)
Sand&sheet&deposits&(Holocene)
Dune&sand&and&sand&sheet&deposits,&undivided&(Holocene)
Linear&dune&deposits&(Holocene)
Parabolic&dune&deposits&(Holocene)
Barchan&dune&deposits&(Holocene)
Mixed&dune&deposits&(Holocene)
Linear&dune&and&sand&sheet&deposits,&undivided&(Holocene)
Young&terraceMgravel&deposits&(Holocene)
Young&alluvial&fan&deposits&(Holocene)
Intermediate&terraceMgravel&deposits&(Holocene)
Intermediate&alluvial&fan&deposits&(Holocene)
Ponded&sediments&(Holocene)
Mixed&alluvium&and&eolian&deposits&(Holocene)
Old&terraceMgravel&deposits&(Holocene)
Old&alluvial&fan&deposits&(Holocene)
ValleyMfill&deposits&(Holocene&and&Pleistocene(?))
Talus&and&rockMfall&deposits&(Holocene&and&Pleistocene(?))
Landslide&deposits&(Holocene&and&Pleistocene)
Older&terraceMgravel&deposits&(Pleistocene)
Older&alluvial&fan&deposits&(Pleistocene&and&Pliocene(?))
Oldest&terraceMgravel&deposits,&undivided&(Pleistocene&and&Pliocene(?))
Gravel&and&sedimentary&deposits&(Pliocene(?)&or&Miocene(?))
SEDIMENTARY&ROCKS
Mancos&Shale&(Upper&Cretaceous)
Dakota&Sandstone&(Upper&Cretaceous)
Morrison&Formation&(Upper&Jurassic)
Salt&Wash&Member
San&Rafael&Group&(Middle&Jurassic)
Romana&Sandstone
Entrada&Sandstone
Carmel&Formation,&undivided
Paria&River&Member&and&Winsor&Member,&undivided
Judd&Hollow&Tongue&and&Page&Sandstone&Tongues,&undivided
Page&Sandstone
Glen&Canyon&Group&(Lower&Jurassic)
Navajo&Sandstone
Kayenta&Formation,&undivided
Springdale&Sandstone&Member
Moenave&Formation&and&Wingate&Sandstone,&undivided
Chinle&Formation&(Upper&Triassic)
Owl&Rock&Member&
Petrified&Forest&Member
Shinarump&Member
Moenkopi&Formation&(Middle(?)&and&Lower&Triassic)
Upper&red&member&(Middle(?)&and&Lower&Triassic)
Shnabkaib&Member&(Lower&Triassic)
Lower&red&member,&Virgin&Limestone&Member,&and&middle&red&member,&
undivided&(Lower&Triassic)
Kaibab&Formation&(Cisuralian)
Harrisburg&Member
Fossil&Mountain&Member
Toroweap&Formation,&undivided&(Cisuralian)
Coconino&Sandstone&(Cisuralian)
Hermit&Formation&(Cisuralian)
Supai&Group&(Cisuralian,&Pennsylvanian,&and&Upper&Mississippian)
Esplanade&Sandstone&(Cisuralian)
Wescogame&(Upper&Pennsylvanian),&Manakacha&(Middle&Pennsylvanian)&
and&Watahomigi&(Lower&Pennsylvanian&and&Upper&Mississippian)&FormaM
tions,&undivided
Surprise&Canyon&Formation&(Upper&Mississippian)
Redwall&Limestone,&undivided&(Upper&and&Lower&Mississippian)
EXPLANATION&OF&MAP&SYMBOLS
Contact—Contacts!between!all!alluvial!and!eolian!units!are!approximate!and!
arbitrary
Fault—Dashed!where!inferred`!dotted!where!concealed`!bar!and!ball!on!down1
thrown!side.!Showing!fault!offset!in!feet
Folds—Showing!trace!of!axial!surface!and!direction!of!plunge`!dotted!where!
location!is!concealed
Anticline
Plunging&anticline
Syncline
Plunging&syncline
Monocline
Strike&and&dip&of&beds
Inclined—Showing!dip!measured!in!the!field
Implied—Interpreted!from!aerial!photographs`!dip!not!determined
Strike&of&vertical&and&subvertical&joints—Interpreted!from!aerial!photographs`!
symbol!placed!where!joints!are!most!visible!on!aerial!photographs
Collapse&structure—Black!dot!shows!circular!collapse!structure!characterized!by!
strata!dipping!inward!toward!a!central!point.!Magenta!dot!shows!circular!
collapse!structure!characterized!by!strata!dipping!inward!toward!a!central!point!
and!brecciated!rock
Sinkhole
Mine&or&prospect
Fracture—Open!fracture!(0.5!to!3.5!m!wide)!without!offset
Offset&fracture—Open!fracture!(0.5!to!3.5!m!wide)!with!offset!(generally!less!than!
1.5!m
Prepared In Cooperation With The
National Park Service, U.S. Forest Service, Bureau of Land Management, and Navajo Nation
Scientific Investigati
Pamphlet
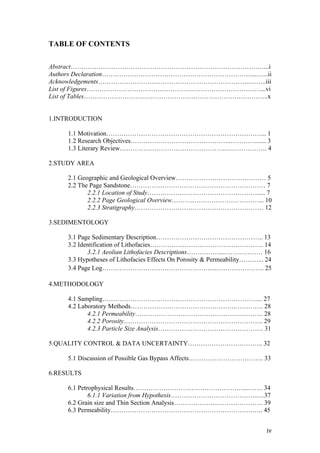
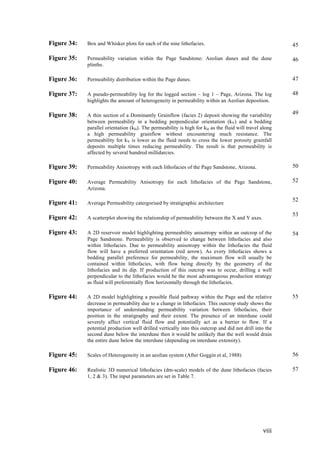
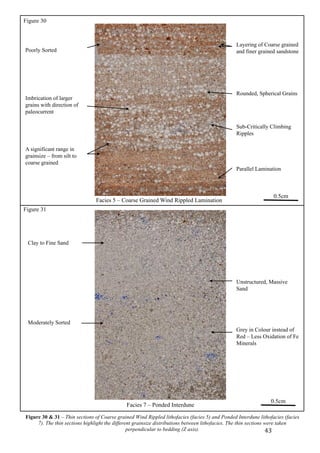
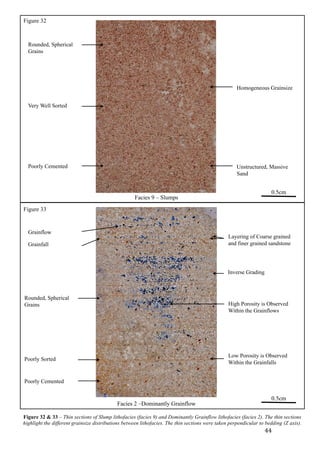
Figure 3 – Map 1 & 2 Geological Key (Billingsley & Priest, 2013)](https://image.slidesharecdn.com/f48515b0-5b6a-4498-a67f-d9231feb738f-150827131335-lva1-app6892/85/FYFE_L_MSC_IPG_FINAL_PROJECT-20-320.jpg)


![71
Dickinson, W. R. (2004). Evolution of the North American cordillera. Annu. Rev.
Earth Planet. Sci., 32, p.13-45.
Douglas, S. W. (2010). The Jurassic Norphlet Formation of the Deep-Water Eastern
Gulf of Mexico: A. Waco: Masters thesis, Baylor University.
Farrell, N. J., Healey, D., & Taylor, C. W. (2014). Anisotropy of permeability in
faulted porous sandstones. Journal of Structural Geology , 63, 50-67.
Fossen, H., Schultz, R. A., & Torabi, A. (2011). Conditions and Implications for
Compaction Band Formation in the Navajo Sandstone, Utah. Journal of Structural
Geology , 33, 1477-1490.
Fryberger, S., & Hern, Y. C. (2014). A Geometric Approach to the Analysis of Global
Eolian Hydrocarbon Reservoirs. AAPG Rocky Mountain Section Meeting, (pp. 1-4).
Denver.
Gaud, M. N., Smith, G. A., & McKenna, S. A. (2012). Relating Small-Scale
Permeability Heterogeneity to Lithofacies Distribution. SEPM Special Publication
No. 80 , 55-66.
Goggin, D. J., Chandler, M. A., Kocurek, G., & Lake, L. W. (1992). Permeability
transects of eolian sands and their use in generating random permeability fields. SPE
Formation Evaluation, 7(01), p.7-16.
Goggin, D. J., Chandler, M. A., Kocurek, G. T., & Lake, L. W. (1988). Patterns of
permeability in eolian deposits: Page Sandstone (Jurassic), northeastern Arizona. SPE
Formation Evaluation, 3(02), p.297-306.
Google Earth 6.0. (2015). Page, Arizona 86040. 36 56'12.34'N 111 28'13.47W,
elevation 1220m. [Accessed 8 June 2015]. Available from:
http://www.google.com/earth/index.html.
Howell, J., & Mountney, N. (2001). Aeolian grain flow architecture: hard data for
reservoir models and implications for red bed sequence stratigraphy. Petroleum
Geoscience , 7, 51-56.
Kocurek, G. T. (2009). Desert aeolian systems In: Reading, H. G. (Ed.). 2009.
Sedimentary environments: processes, facies and stratigraphy. John Wiley & Sons.
p.125-152
Kocurek, G. (1999). The Aeolian Rock Record. In A. S. Goudie, I. Livingstone, & S.
Stokes (Eds.), Aeolian Environments, Sediments & Landforms (pp. 239-259).
Chichester: John Wiley & Sons Ltd.
Loope, D., Eisenberg, L., and Waiss, E. (2004). Navajo sand sea of near-equatorial
Pangea: Tropical westerlies, slumps, and giant stromatolites, in Nelson, E.P. and
Erslev, E.A., Field trips in the southern Rocky Mountains, USA: Geological Society of
America Field Guide 5, p.1–13.](https://image.slidesharecdn.com/f48515b0-5b6a-4498-a67f-d9231feb738f-150827131335-lva1-app6892/85/FYFE_L_MSC_IPG_FINAL_PROJECT-82-320.jpg)
![72
Nordhal, K., & Ringrose, P. (2008). Identifying the Representative Elementary
Volume for Permeability in Heterolithic Deposits Using Numerical Rock Models.
Mathematical Geosciences , 40 (7), 753-771.
North, C. P., & Prosser, D. J. (1993). Characterization of fluvial and aeolian
reservoirs: problems and approaches. In C. P. North, & D. J. Prosser (Eds.),
Characterization of Fluvial and Aeolian Reservoirs (Vol. Special Publication No. 73,
pp. 1-6). Bath: The Geological Society.
Prosser, D. J., & Maskall, R. (1993). Permeability variation within aeolian sandstone:
A case study using core cut sub-parallel to slipface bedding, the Auk field, central
North Sea, UK. Geological Society, London, Special Publications, 73(1), p.377-397.
Peterson, F. and G. N. Pipiringos. (1979). Stratigraphic relations of the Navajo
Sandstone to Middle Jurassic formations, southern Utah and northern Arizona. U.S.
Geological Survey Professional Paper 1035-B, p. 1–43.
Pierce, C., Howell, J., & Reike, H. (2014). Facies distribution within Aeolian sets
related to large scale 3D outcrop architecture: A virtual outcrop case study from the
Jurassic Page Sandstone, Arizona. Nottingham: British Sedimentological Research
Group AGM.
Ringrose, P., & Bentley, M. (2015). The Rock Model. In P. Ringrose, & M. Bentley,
Reservoir Model Design: A Practitioner's Guide (pp. 22-28). London: Springer.
Shell Corrib Development Team. (2015). Interview on An Industry Perspective On
Permeability Heterogeneity In Reservoir Modeling. Interviewed by Laura-Jane Fyfe
[Meeting] Shell Offices, Aberdeen, 27 July 2015, 09:00.
Stalkup, F. (1986). Permeability Variations Observed at the Faces of Crossbedded
Sandstone Outcrops. In L. W. Lake, & H. B. Carroll, Reservoir Characterization (pp.
141-181). London: Academic Press Inc.
Thorman, C. H. & Peterson, F. (2003). The Middle Jurassic Elko Orogeny - A Major
Tectonic Event in Nevada-Utah In Annual Meeting Expanded Abstracts, v.12, p.169-
174.
Torsaeter, O., & Abtahi, M. (2000). Experimental Reservoir Engineering: Laboratory
Work Book. Trondheim: Department of Petroleum Engineering and Applied
Geophysics, Norwegian University of Science and Technology.](https://image.slidesharecdn.com/f48515b0-5b6a-4498-a67f-d9231feb738f-150827131335-lva1-app6892/85/FYFE_L_MSC_IPG_FINAL_PROJECT-83-320.jpg)


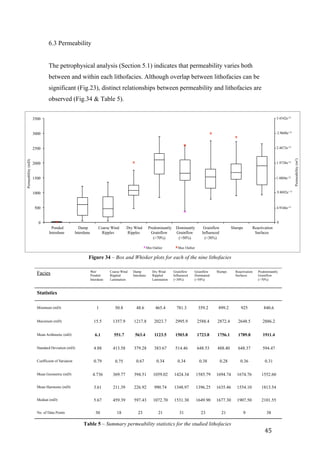
![Distr. of aptian_sandstones_-_part_1[1]](https://cdn.slidesharecdn.com/ss_thumbnails/distr-170116122730-thumbnail.jpg?width=640&height=640&fit=bounds)