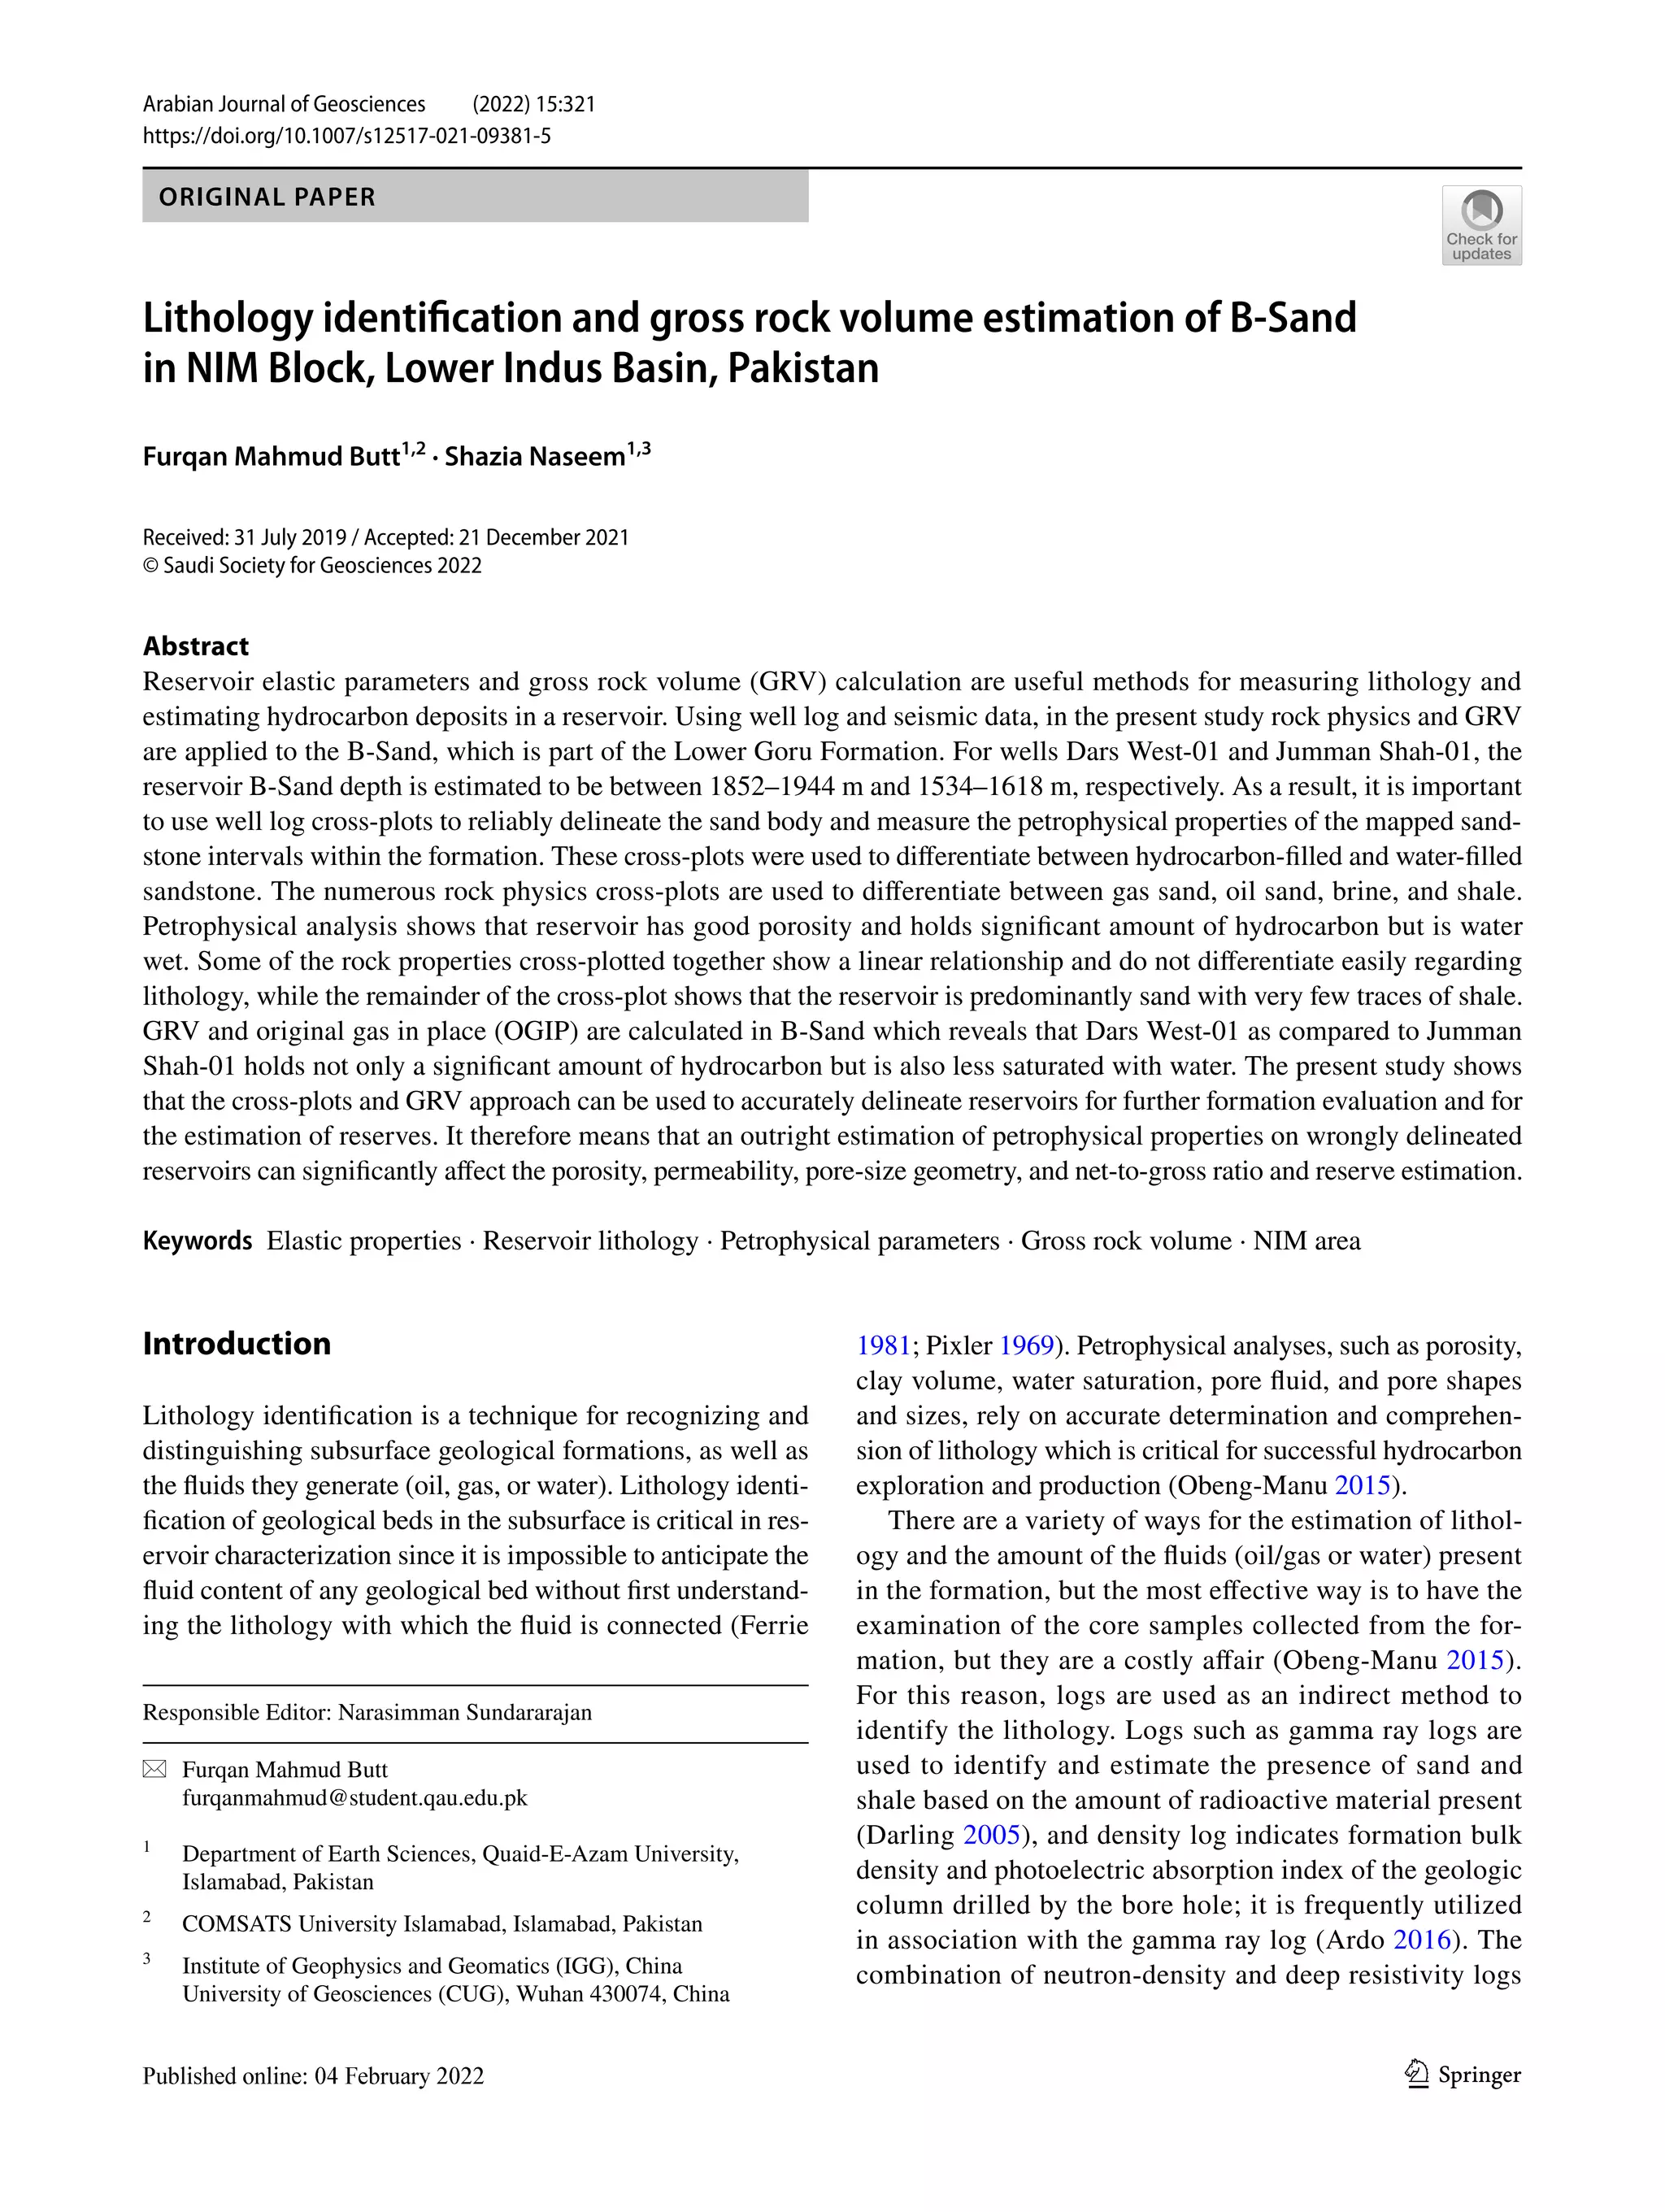
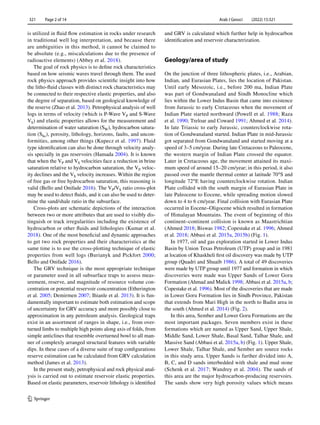
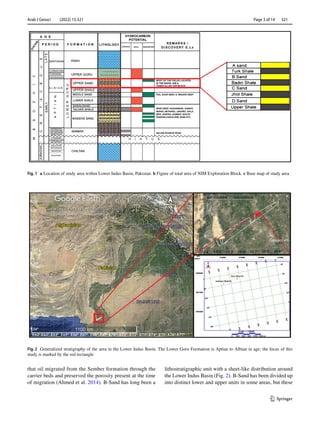
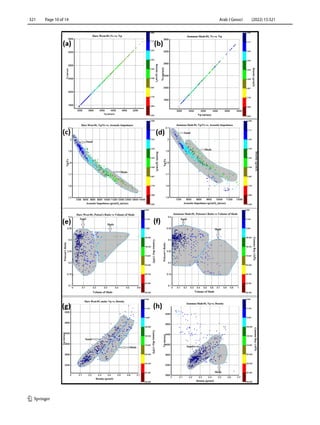
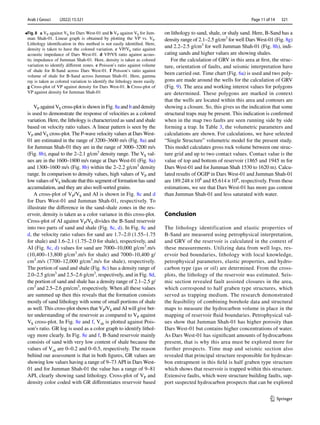
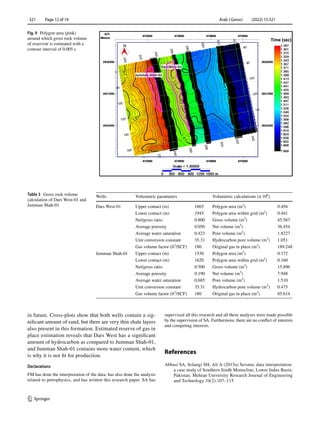
Vol.:(0123456789)
1 3
Arabian Journal of Geosciences (2022) 15:321
https://doi.org/10.1007/s12517-021-09381-5
ORIGINAL PAPER
Lithology identification and gross rock volume estimation of B‑Sand
in NIM Block, Lower Indus Basin, Pakistan
Furqan Mahmud Butt1,2
 · Shazia Naseem1,3
Received: 31 July 2019 / Accepted: 21 December 2021
© Saudi Society for Geosciences 2022
Abstract
Reservoir elastic parameters and gross rock volume (GRV) calculation are useful methods for measuring lithology and
estimating hydrocarbon deposits in a reservoir. Using well log and seismic data, in the present study rock physics and GRV
are applied to the B-Sand, which is part of the Lower Goru Formation. For wells Dars West-01 and Jumman Shah-01, the
reservoir B-Sand depth is estimated to be between 1852–1944 m and 1534–1618 m, respectively. As a result, it is important
to use well log cross-plots to reliably delineate the sand body and measure the petrophysical properties of the mapped sand-
stone intervals within the formation. These cross-plots were used to differentiate between hydrocarbon-filled and water-filled
sandstone. The numerous rock physics cross-plots are used to differentiate between gas sand, oil sand, brine, and shale.
Petrophysical analysis shows that reservoir has good porosity and holds significant amount of hydrocarbon but is water
wet. Some of the rock properties cross-plotted together show a linear relationship and do not differentiate easily regarding
lithology, while the remainder of the cross-plot shows that the reservoir is predominantly sand with very few traces of shale.
GRV and original gas in place (OGIP) are calculated in B-Sand which reveals that Dars West-01 as compared to Jumman
Shah-01 holds not only a significant amount of hydrocarbon but is also less saturated with water. The present study shows
that the cross-plots and GRV approach can be used to accurately delineate reservoirs for further formation evaluation and for
the estimation of reserves. It therefore means that an outright estimation of petrophysical properties on wrongly delineated
reservoirs can significantly affect the porosity, permeability, pore-size geometry, and net-to-gross ratio and reserve estimation.
Keywords  Elastic properties · Reservoir lithology · Petrophysical parameters · Gross rock volume · NIM area
Introduction
Lithology identification is a technique for recognizing and
distinguishing subsurface geological formations, as well as
the fluids they generate (oil, gas, or water). Lithology identi-
fication of geological beds in the subsurface is critical in res-
ervoir characterization since it is impossible to anticipate the
fluid content of any geological bed without first understand-
ing the lithology with which the fluid is connected (Ferrie
1981; Pixler 1969). Petrophysical analyses, such as porosity,
clay volume, water saturation, pore fluid, and pore shapes
and sizes, rely on accurate determination and comprehen-
sion of lithology which is critical for successful hydrocarbon
exploration and production (Obeng-Manu 2015).
There are a variety of ways for the estimation of lithol-
ogy and the amount of the fluids (oil/gas or water) present
in the formation, but the most effective way is to have the
examination of the core samples collected from the for-
mation, but they are a costly affair (Obeng-Manu 2015).
For this reason, logs are used as an indirect method to
identify the lithology. Logs such as gamma ray logs are
used to identify and estimate the presence of sand and
shale based on the amount of radioactive material present
(Darling 2005), and density log indicates formation bulk
density and photoelectric absorption index of the geologic
column drilled by the bore hole; it is frequently utilized
in association with the gamma ray log (Ardo 2016). The
combination of neutron-density and deep resistivity logs
Responsible Editor: Narasimman Sundararajan
*	 Furqan Mahmud Butt
	furqanmahmud@student.qau.edu.pk
1
	 Department of Earth Sciences, Quaid-E-Azam University,
Islamabad, Pakistan
2
	 COMSATS University Islamabad, Islamabad, Pakistan
3
	 Institute of Geophysics and Geomatics (IGG), China
University of Geosciences (CUG), Wuhan 430074, China
Arab J Geosci (2022) 15:321
1 3
321   Page 2 of 14
is utilized in fluid flow estimation in rocks under research
in traditional well log interpretation, and because there
are ambiguities in this method, it cannot be claimed to
be absolute (e.g., miscalculations due to the presence of
radioactive elements) (Abbey et al. 2018).
The goal of rock physics is to define rock characteristics
based on how seismic waves travel through them. The used
rock physics approach provides scientific insight into how
the litho-fluid classes with distinct rock characteristics may
be connected to their respective elastic properties, and also
the degree of separation, based on geological knowledge of
the reserve (Zhao et al. 2013). Petrophysical analysis of well
logs in terms of velocity (which is P-Wave ­
VP and S-Wave
­VS) and elastic properties allows for the measurement and
determination of water saturation ­
(SW), hydrocarbon satura-
tion ­(Shc), porosity, lithology, horizons, faults, and uncon-
formities, among other things (Kupecz et al. 1997). Fluid
type identification can also be done through velocity analy-
sis specially in gas reservoirs (Hamada 2004). It is known
that when the ­
VP and ­
VS velocities face a reduction in brine
saturation relative to hydrocarbon saturation, the ­
VP veloc-
ity declines and the ­
VS velocity increases. Within the region
of free gas or free hydrocarbon saturation, this reasoning is
valid (Bello and Onifade 2016). The ­
VP/VS ratio cross-plot
may be used to detect fluids, and it can also be used to deter-
mine the sand/shale ratio in the subsurface.
Cross-plots are schematic depictions of the interaction
between two or more attributes that are used to visibly dis-
tinguish or track irregularities including the existence of
hydrocarbon or other fluids and lithologies (Kumar et al.
2018). One of the most beneficial and dynamic approaches
to get two rock properties and their characteristics at the
same time is to use the cross-plotting technique of elastic
properties from well logs (Burianyk and Pickfort 2000;
Bello and Onifade 2016).
The GRV technique is the most appropriate technique
or parameter used in all subsurface traps to assess meas-
urement, reserve, and magnitude of resource volume con-
centration or potential reservoir concentration (Etherington
et al. 2005; Demirmen 2007; Ihianle et al. 2013). It is fun-
damentally important to estimate both estimation and scope
of uncertainty for GRV accuracy and more possibly close to
approximation in any petroleum analysis. Geological traps
exist in an assortment of ranges in shape, i.e., from over-
turned limbs to multiple high points along axis of folds, from
simple anticlines that resemble overturned bowl to all man-
ner of complexly arranged structural features with variable
dips. In these cases of a diverse suite of trap configurations
reserve estimation can be calculated from GRV calculation
method (James et al. 2013).
In the present study, petrophysical and rock physical anal-
ysis is carried out to estimate reservoir elastic properties.
Based on elastic parameters, reservoir lithology is identified
and GRV is calculated which further help in hydrocarbon
identification and reservoir characterization.
Geology/area of study
On the junction of three lithospheric plates, i.e., Arabian,
Indian, and Eurasian Plates, lies the location of Pakistan.
Until early Mesozoic, i.e., before 200 ma, Indian Plate
was part of Gondwanaland and Sindh Monocline which
lies within the Lower Indus Basin that came into existence
from Jurassic to early Cretaceous when the movement of
Indian Plate started northward (Powell et al. 1988; Raza
et al. 1990; Treloar and Coward 1991; Ahmed et al. 2014).
In late Triassic to early Jurassic, counterclockwise rota-
tion of Gondwanaland started. Indian Plate in mid-Jurassic
got separated from Gondwanaland and started moving at a
speed of 3–5 cm/year. During late Cretaceous to Paleocene,
the western margin of Indian Plate crossed the equator.
Later in Cretaceous age, the movement attained its maxi-
mum speed of around 15–20 cm/year; in this period, it also
passed over the mantle thermal center at latitude 70°S and
longitude 72°E having counterclockwise rotation. Indian
Plate collided with the south margin of Eurasian Plate in
late Paleocene to Eocene, while spreading motion slowed
down to 4 to 6 cm/year. Final collision with Eurasian Plate
occurred in Eocene–Oligocene which resulted in formation
of Himalayan Mountains. The event of beginning of this
continent–continent collision is known as Maastrichtian
(Ahmed 2018; Biswas 1982; Copestake et al. 1996; Ahmed
et al. 2018; Abbasi et al. 2015a, 2015b) (Fig. 1).
In 1977, oil and gas exploration started in Lower Indus
Basin by Union Texas Petroleum (UTP) group and in 1981
at location of Khaskheli first oil discovery was made by UTP
group (Quadri and Shuaib 1986). A total of 49 discoveries
were made by UTP group until 1977 and formation in which
discoveries were made was Upper Sands of Lower Goru
Formation (Ahmad and Malick 1998; Abbasi et al. 2015a, b;
Copestake et al. 1996). Most of the discoveries that are made
in Lower Goru Formation lies in Sindh Province, Pakistan
that extends from Mari High in the north to Badin area in
the south (Ahmed et al. 2014) (Fig. 2).
In this area, Sember and Lower Goru Formations are the
most important packages. Seven members exist in these
formations which are named as Upper Sand, Upper Shale,
Middle Sand, Lower Shale, Basal Sand, Talhar Shale, and
Massive Sand (Abbasi et al. 2015a, b) (Fig. 1). Upper Shale,
Lower Shale, Talhar Shale, and Sember are source rocks
in this study area. Upper Sands is further divided into A,
B, C, and D sands interbedded with shale and mud stone
(Schenk et al. 2017; Wandrey et al. 2004). The sands of
this area are the major hydrocarbon-producing reservoirs.
The sands show very high porosity values which means
Arab J Geosci (2022) 15:321 	
1 3
Page 3 of 14  321
that oil migrated from the Sember formation through the
carrier beds and preserved the porosity present at the time
of migration (Ahmed et al. 2014). B-Sand has long been a
lithostratigraphic unit with a sheet-like distribution around
the Lower Indus Basin (Fig. 2). B-Sand has been divided up
into distinct lower and upper units in some areas, but these
Fig. 1  a Location of study area within Lower Indus Basin, Pakistan. b Figure of total area of NIM Exploration Block. c Base map of study area
Fig. 2  Generalized stratigraphy of the area in the Lower Indus Basin. The Lower Goru Formation is Aptian to Albian in age; the focus of this
study is marked by the red rectangle
Arab J Geosci (2022) 15:321
1 3
321   Page 4 of 14
have not been formed everywhere, and the restrictions on
the creation of these units are uncertain (Ebdon et al. 2004).
Chiltan Limestone which lies beneath Sember formation has
a conformable contact (Khalid et al. 2018). The project area
“NIM Block” is situated in districts of Hyderabad and Tando
Allahyar, Sindh Province, Pakistan (Fig. 2) with a total area
of 235.26 ­
km2
and is operated jointly by the Oil and Gas
Development Company (OGDC) (95%) and Government
Holdings Private Limited (GHPL) (5%). Geologically, it
lies in the Lower Indus Basin and to the south of Southern
Sindh Monocline.
Methodology
The reservoir description in a typical seismic interpretation
approach is based primarily on the mapping and detection
of horizons and faults in a 3D seismic survey, which may
lead to a more comprehensive interpretation on a regional
and local scale within the reservoir of interest (Masaferro
et al. 2004). The methodology involved in seismic interpre-
tation is to determine, evaluate, and discover hydrocarbon
prospects in the subsurface which also define the nature of
the reservoir on the area of interest (Abd El_Kader 2016).
For the present research, 3D seismic reflection data (15
­km2
) and two wells’ data were provided from OGDC by
Directorate General Petroleum Concessions (DGPC) of
Pakistan. To do seismic interpretation of any specific area,
we rely on available information that can be from old jour-
nals and on the stratigraphy of the field area. After this study
is done, we do correlation of seismic section with available
formation tops (Table 1) from wells that are being drilled.
The interpretational process of seismic data includes impor-
tant geological structure correspondence to reflectors of
seismic section. In tracing reflector processes, we must do
seismic line to line tie points, and it requires very accurate
phase correlation of the events.
Faults, folds, any sedimentation characteristics, or any
stratigraphic feature are examined during the present study.
The times associated with each of the interpreted reflectors
are then converted from time section to depth sections using
this model. To find dominant lithology, first petrophysical
analysis is done and considering these analysis elastic prop-
erties of formation is determined. In the present study, petro-
physics, elastic properties, and GRV are estimated using data
obtained from seismic and well logs of two wells, namely,
Jumman Shah-01 and Dars West-01. From petrophysical
analysis, volume of shale ­
(Vsh), density porosity (PHID),
effective porosity (PHIE), sonic porosity (PORS), ­
Sw, and
­Sh are determined. In elastic properties, ­
Vp and ­
Vs are cal-
culated from delay time (DT) log, and from these velocities,
­Vp/Vs, σ, and acoustic impedance (AI) are calculated. After
those different cross-plots are generated, it gives us clear
insight of lithology patterns. When the above analysis is
completed, volumetric estimates (GRV) are made by analyz-
ing contours and faults on time map. From GRV net-to-gross
ratio, gross, net, pore, hydrocarbon pore volume, and OGIP
information of reservoir are calculated. In the end, all results
are summed up and complied given that this area is suitable
for more exploration or not.
The objectives and purpose of the petrophysical analysis
is to determine different physical properties and behavior of
reservoir rocks that exist within the reservoir zone (Fig. 3).
To depict pay zones which are present in reservoir and to
quantify hydrocarbon saturation present in the reservoir,
log techniques are applied in Jumman Shah-01 and Dars
West-01. The following steps are followed to achieve these
objectives.
1.	 Carrying out log interpretation to mark the suitable res-
ervoir zones
2.	 Computation of reservoir rocks characteristics using
wireline logs
3.	 Interpretation of the measured parameters for the evalu-
ation of the hydrocarbon potential of the study area.
Figure 3 describes the workflow of the petrophysical
interpretation that is discussed above.
Shale is a rock which has more radioactivity than sands
and carbonate rocks. ­
Vsh is the amount of shale that is
present in the formation of sand or in carbonates (Mehana
Table 1  Information about formation tops in Jumman Shah-01 and
Dars West-01
Well name: Jumman Shah-01 Dars West-01
Latitude: 25°28′32.75ʺ N 25°28′41.2ʺ N
Longitude: 68°43′50.86ʺ E 68°44′16.5ʺ E
Total depth (m): 3802 2102
Formation name Depth (m) Depth (m)
Laki NA 470
Ranikot 823 825
Khadro 1096 1079
Parh 1155 1134
Upper Goru 1250 1204
B-Sand 1534 1852
Badin Shale 1618 1944
C-Sand 1669
Jhol Shale 1778
D-Sand 1829
Upper Shale 1875
Middle Sand 2315
Lower Shale 2394
Basal Sand 2578
Sember 3019
Chiltan 3737
Arab J Geosci (2022) 15:321 	
1 3
Page 5 of 14  321
and El-monier 2016; Moradi et al. 2016). ­Vsh is calculated
using the following formula (Asquith and Gibson 1982):
where ­GRmax is maximum gamma ray and ­
GRmin is mini-
mum gamma ray (in API).
Porosity is the function of matrix density and bulk den-
sity of formation along with the density of the saturation
of fluid in rock called density porosity (PHID). Formula
for calculation of PHID is as follows (Foster and Beau-
mont 1999):
where ­RHOma is matrix density, ­
RHOb is formation bulk
density (log value), and ­
RHOf is density of fluid saturating
the rock immediately surrounding the borehole.
Effective porosity (PHIE) is the total porosity less the
fraction of the pore space occupied by shale or clay. PHIE
is calculated in the following manner (Owolabi et al. 2019):
where PHIE is effective porosity and NPHI is neutron
porosity.
(1)
Vsh =
(
GR − GRmin
)
(
GRmax − GRmin
)
(2)
PHID =
(
RHOma − RHOb
)
(
RHOb − RHOf
)
(3)
PHIE =
(PHID + NPHI)
2
×
(
1 − Vsh
)
The Hydrogen Index (HI) in a reservoir is directly related
to porosity, and neutron porosity calculation uses a neutron
source to calculate it. The ratio of the concentration of
hydrogen atoms per cubic centimeter in a sample to that of
pure water at 75°F is known as the HI. Since hydrogen atoms
can be found in both water- and oil-filled tanks, measuring
their concentration can be used to estimate the volume of
liquid-filled porosity (Asquith et al. 2004).
Porosity that is calculated from the interval transit time of
the wave is called the PORS. It is calculated from formula
derived from Wyllie et al. (1956) given as follows:
where ∆tlog is measured interval transit time (s), ∆tmatrix is
interval transit time of rock matrix (s), and ∆tf is interval
transit time of rock matrix (s).
SW is the amount of water that is present in the pore
spaces in the formation. ­
SW can be calculated by Archie
Equation (Archie 1952) which is mentioned as
where A is cementation constant, M is cementation expo-
nent, N is saturation exponent, ­
Rt is resistivity of formation,
and ­Rw is resistivity of water (Ω.m).
(4)
PORS =
Δtlog − Δtmatrix
Δtf − Δtmatrix
(5)
Sw =
{
A × Rw
PHIEm
× Rt
} 1
N
Fig. 3  Petrophysical interpreta-
tion workflow that is followed
in the present study
Arab J Geosci (2022) 15:321
1 3
321   Page 6 of 14
Saturation of reservoir is equal to ­
Shc plus ­
Sw (Dake 1983);
from this, we can get ­
Shc which is mathematically expressed as
VP, also known as primary velocity, is the first wave that
is recorded in a seismograph (Milsom 2003). ­VP can be cal-
culated by simply taking reverse of DT log multiplied by ­
106
.
Formula for calculation of ­
VP is as follows:
where DT is delay time (DT) log (µs/ft).
VS is also known as secondary wave; it tends to move in the
direction which is perpendicular to the motion of propagation
of the wave (Xie 2015). Here, ­
VS is calculated from the equa-
tion (Castagna et al. 1985) which is given as
where ­VS and Vp are S- and P-wave velocity (km/s).
Poisson’s ratio (σ) is the measure of the amount of trans-
verse distortion compared to longitudinal distortion; here, we
have determined σ from ­
VP/VS ratio (Sheriff 2002; Hamilton
1979) mathematically expressed as
AI is the image or depiction of the properties of rocks that
lie in the subsurface (Farfour et al. 2015). It is resolved when
density of formation is multiplied by velocity with which it
travels in the formation given as (Rogers 2015; Andreassen
et al. 2007)
where V is velocity (m/s) and Rho is density (g/cm3
).
Gross rock volume (GRV) is the calculation of how much
volume or quantity of fluids, whether oil or gas, are present in
the subsurface. Method and equations regarding calculation
of GRV are mentioned as (Sustakoski and Morton-Thompson
1992; Jahn et al. 2008)
(6)
Shc = 1 − Sw
(7)
Vp =
106
DT
(8)
Vs =
(
Vp − 1.36
)
1.16
(9)
σ =
⎧
⎪
⎪
⎨
⎪
⎪
⎩
0.5 ×
�
V2
p
V2
s
�
�V2
p
V2
s
�
− 1
⎫
⎪
⎪
⎬
⎪
⎪
⎭
(10)
AI = Rho × V
(11)
Gv = A × Zvalue
(12)
Pv = Nv − ϕ
(13)
HPv = Pv −
(
1 × Sw
)
where
Gv	gross volume ­(m3
) (calculated based on structure
grid whether single or dual).
A	
area of reservoir ­
(m2
) from map data.
Zvalue	
a depth value or a zone attribute within the grid cell.
Pv	pore volume ­(m3
).
Nv	net volume ­(m3
) (volume between two surfaces
within an area).
ϕ	
porosity (decimal) from log and/or core data.
HPv	
hydrocarbon pore volume ­
(m3
).
OGIP	
original gas in place ­
(m3
).
h	
height or thickness of pay zone (m) from log and/
or core data.
Sw	
water saturation (decimal) from log and/or core
data.
Bgi	
formation volume factor for gas at initial conditions
­(m3
/m3
).
Results and discussion
The horizon (B-Sand) that is marked here is based on the well
data, formation tops (Table 1), and generation of synthetic
seismogram (Fig. 4). Here, B-Sand is marked by green color
(Fig. 5) and shows the Inline No. 71; four faults are marked
as Fault-1, Fault-2, Fault-3, and Fault-4. The faults that are
marked are normal faults which clearly show that the area
is experiencing the extensional forces. In Fig. 5, we see half
graben structures, and these structures are responsible for the
accumulation of hydrocarbons in B-Sand. For the construc-
tion of time contour maps, B-Sand is picked throughout the
project area by creating a time grid map (Fig. 6a). Here, the
time section reveals an increase in time from west to east. To
generate the depth contour map (Fig. 6b), first the velocity is
calculated by taking time from the seismic section and depth
from the well data to convert the time grid into depth grid.
The surface maps represent the lateral and vertical distribution
of the formation. Amplitude map of B-Sand has been prepared
and is shown in Fig. 6c. Greenish yellow to red show high
amplitude zones and Dars West-01 lies in this zone and the
status of this well is gas condensate and producing. Jumman
Shah-01 also lies in this zone, but the status of this well is
plugged and abandoned because of the structural implications
(Fig. 6b) and secondly quite possibly due to shallow depth.
Light blue to blue color shows the medium amplitude and
dark blue color shows low amplitude zones. Low amplitude
zones exist on the eastern and western part of the area.
(14)
OGIP =
{
A × h × ϕ ×
(
1 − Sw
)}/
Bgi
Arab J Geosci (2022) 15:321 	
1 3
Page 7 of 14  321
For petrophysics, we have analyzed well logs and from
that a hydrocarbon-bearing zone B-Sand is identified from
the two wells given. Results of these calculations are given
in Table 2 and petrophysical interpretation of B-Sand is given
in Fig. 7a and b for Dars West-01 and Jumman Shah-01,
respectively. This argument can be identified in Fig. 7a and b
as average values of these wells are corresponding to 35 API
(Jumman Shah-01) and 40 API (Dars West-01) presuming that
this reservoir consists of mostly sand. From Table 2, ­Vsh in
Jumman Shah-01 and Dars West-01 is 18% and 20%, respec-
tively. This shows that B-Sand consists of mostly sand and
very small concentrations of shale in both wells (Fig. 7a, b).
In Jumman Shah-01, PHID, PHIE, and PORS values
are approximately 22%, 16%, and 22%, respectively, and
Fig. 4  The synthetic seismogram is created using the Jumman Shah-01 well data
Fig. 5  Seismic section (In-line
71) presenting the marked
B-Sand (green), faults and wells
Arab J Geosci (2022) 15:321
1 3
321   Page 8 of 14
Fig. 6  a Time contour map of
B-Sand with contour of interval
0.005 s. b Depth contour map of
B-Sand with contour interval of
5 m. c Amplitude contour map
of B-Sand with contour interval
of 5 m
Arab J Geosci (2022) 15:321 	
1 3
Page 9 of 14  321
in Dars West-01 values are approximately 18%, 11%, and
18%, respectively (Table 2), which shows that both wells
have fair to good porosity. From this, we can also assume
that reservoir has good quality sand (Fig. 7a, b). In the
end, we calculated ­
Sw. The value of ­
Sw in Jumman Shah-01
is greater than 79% which shows that despite having fair to
good porosity, this well has high concentration of water; in
Dars West-01, ­
Sw is greater than 43%, and this shows that
it has a very good concentration of hydrocarbons present
in reservoir (Fig. 7a, b).
Table 2  Petrophysical values
of parameters in B-Sand
encountered in wells under
study
Sr. no Well name Depth
(m)
Vsh (%) PHID (%) PHIE (%) PORS (%) Sw (%) Shc (%)
1 Dars West-01 1852–1944 20.5 18.6 11.0 18.42 43.7 56.3
2 Jumman Shah-01 1534–1618 18.6 22.6 16.98 22.48 79.75 20.2
Fig. 7  a Petrophysical interpretation for Dars Wes-01. b Petrophysical interpretation for Jumman Shah-01 showing the estimation and calcula-
tion of volume of shale ­
(Vsh), porosities (PHID and PHIE), water saturation ­
(SW), and hydrocarbon saturation ­
(Shc)
Arab J Geosci (2022) 15:321
1 3
321   Page 10 of 14
Arab J Geosci (2022) 15:321 	
1 3
Page 11 of 14  321
VP against ­
VS cross-plot is shown in Fig. 8a and b and density
is used to demonstrate the response of velocities as a colored
variation. Here, the lithology is characterized as sand and shale
based on velocity ratio values. A linear pattern is seen by the
­VP and ­
VS cross-plot. The P-wave velocity values at Dars West-
01 are estimated in the range of 3200–3600 m/s (Fig. 8a) and
for Jumman Shah-01 they are in the range of 3000–3200 m/s
(Fig. 8b), equal to the 2–2.1 g/cm3
density range. The ­
VS val-
ues are in the 1600–1800 m/s range at Dars West-01 (Fig. 8a)
and 1300–1600 m/s (Fig. 8b) within the 2–2.2 g/cm3
density
range. In comparison to density values, high values of ­
VP and
low values of ­
VS indicate that this segment of formation has sand
accumulation, and they are also well-sorted grains.
A cross-plot of ­
VP/VS and AI is shown in Fig. 8c and d
for Dars West-01 and Jumman Shah-01, respectively. To
illustrate the difference in the sand-shale zones in the res-
ervoir, density is taken as a color variance in this cross-plot.
Cross-plot of AI against ­
VP/VS divides the B-Sand reservoir
into two parts of sand and shale (Fig. 8c, d). In Fig. 8c and
d, the velocity ratio values for sand are 1.7–2.0 (1.55–1.75
for shale) and 1.6–2.1 (1.75–2.0 for shale), respectively, and
AI (Fig. 8c, d) values for sand are 7000–10,000 g/cm3
.m/s
(10,400–13,800 g/cm3
.m/s for shale) and 7000–10,400 g/
cm3
.m/s (7700–12,000 g/cm3
.m/s for shale), respectively.
The portion of sand and shale (Fig. 8c) has a density range of
2.0–2.5 g/cm3
and 2.5–2.6 g/cm3
, respectively, and in Fig. 8d,
the portion of sand and shale has a density range of 2.1–2.5 g/
cm3
and 2.5–2.6 gm/cm3
, respectively. When all these values
are summed up then this reveals that the formation consists
mostly of sand lithology with some of small portions of shale
as well. This cross-plot shows that ­
VP/VS and AI will give bet-
ter understanding of the reservoir as compared to ­
VP against
­VS cross-plot. In Fig. 8e and f, ­Vsh is plotted against Pois-
son’s ratio. GR log is used as a color graph to identify lithol-
ogy more clearly. In Fig. 8e and f, B-Sand reservoir mainly
consists of sand with very low content of shale because the
values of ­
Vsh are 0–0.2 and 0–0.5, respectively. The reason
behind our assessment is that in both figures, GR values are
showing low values having a range of 9–73 API in Dars West-
01 and for Jumman Shah-01 the value has a range of 9–81
API, clearly showing sand lithology. Cross-plot of ­
VP and
density color coded with GR differentiates reservoir based
on lithology to sand, shale, or shaly sand. Here, B-Sand has a
density range of 2.1–2.5 g/cm3
for well Dars West-01 (Fig. 8g)
and 2.2–2.5 g/cm3
for well Jumman Shah-01 (Fig. 8h), indi-
cating sands and higher values are showing shales.
For the calculation of GRV in this area at first, the struc-
ture, orientation of faults, and seismic interpretation have
been carried out. Time chart (Fig. 6a) is used and two poly-
gons are made around the wells for the calculation of GRV
(Fig. 9). The area and working interest values for polygons
are determined. These polygons are marked in context
that the wells are located within this area and contours are
showing a closure. So, this gives us the indication that some
structural traps may be present. This indication is confirmed
when in the map two faults are seen running side by side
forming a trap. In Table 3, the volumetric parameters and
calculations are shown. For calculations, we have selected
“Single Structure” volumetric model for the present study.
This model calculates gross rock volume between one struc-
ture grid and up to two contact values. Contact value is the
value of top and bottom of reservoir (1865 and 1945 m for
Dars West-01 and for Jumman Shah 1530 to 1620 m). Calcu-
lated results of OGIP in Dars West-01 and Jumman Shah-01
are 189.248 × ­106
and 85.614 × ­106
, respectively. From these
estimations, we see that Dars West-01 has more gas content
than Jumman Shah-01 and less saturated with water.
Conclusion
The lithology identification and elastic properties of
B-Sand are measured using petrophysical interpretation,
and GRV of the reservoir is calculated in the context of
these measurements. Utilizing data from well logs, res-
ervoir bed boundaries, lithology with local knowledge,
petrophysical parameters, elastic properties, and hydro-
carbon type (gas or oil) are determined. From the cross-
plots, the lithology of the reservoir was estimated. Seis-
mic section revealed fault assisted closures in the area,
which correspond to half graben type structures, which
served as trapping medium. The research demonstrated
the feasibility of combining borehole data and structural
maps to measure the hydrocarbon volume in place in the
mapping of reservoir fluid boundaries. Petrophysical val-
ues show that Jumman Shah-01 has higher porosity than
Dars West-01 but contains higher concentrations of water.
As Dars West-01 has significant amounts of hydrocarbons
present, that is why this area must be explored more for
further prospects. Time map and seismic section also
revealed that principal structure responsible for hydrocar-
bon entrapment in this field is half graben type structure
which shows that reservoir is trapped within this structure.
Extensive faults, which were structure building faults, sup-
port suspected hydrocarbon prospects that can be explored
Fig. 8  a ­VP against ­
VS for Dars West-01 and b ­VP against ­
VS for Jum-
man Shah-01. Linear graph is obtained by plotting the VP vs. ­
VS.
Lithology identification in this method is not easily identified. Here,
density is taken to have the colored variation. c VP/VS ratio against
acoustic impedance of Dars West-01. d VP/VS ratio against acous-
tic impedance of Jumman Shah-01. Here, density is taken as colored
variation to identify different zones. e Poisson’s ratio against volume
of shale for B-Sand across Dars West-01. f Poisson’s ratio against
volume of shale for B-Sand across Jumman Shah-01. Here, gamma
ray is taken as colored variation to identify the lithology more easily.
g Cross-plot of VP against density for Dars West-01. h Cross-plot of
VP against density for Jumman Shah-01
◂
Arab J Geosci (2022) 15:321
1 3
321   Page 12 of 14
in future. Cross-plots show that both wells contain a sig-
nificant amount of sand, but there are very thin shale layers
also present in this formation. Estimated reserve of gas in
place estimation reveals that Dars West has a significant
amount of hydrocarbon as compared to Jumman Shah-01,
and Jumman Shah-01 contains more water content, which
is why it is not fit for production.
Declarations 
FM has done the interpretation of the data, has also done the analysis
related to petrophysics, and has written this research paper. SA has
supervised all this research and all these analyses were made possible
by the supervision of SA. Furthermore, there are no conflict of interests
and competing interests.
References
Abbasi SA, Solangi SH, Ali A (2015a) Seismic data interpretation:
a case study of Southern Sindh Monocline, Lower Indus Basin,
Pakistan. Mehran University Research Journal of Engineering
and Technology 34(2):107–115
Fig. 9  Polygon area (pink)
around which gross rock volume
of reservoir is estimated with a
contour interval of 0.005 s
Table 3  Gross rock volume
calculation of Dars West-01 and
Jumman Shah-01
Wells Volumetric parameters Volumetric calculations (× ­
106
)
Dars West-01 Upper contact (m) 1865 Polygon area ­
(m2
) 0.494
Lower contact (m) 1945 Polygon area within grid ­
(m2
) 0.441
Net/gross ratio 0.800 Gross volume ­
(m3
) 45.567
Average porosity 0.050 Net volume ­
(m3
) 36.454
Average water saturation 0.423 Pore volume ­
(m3
) 1.8227
Unit conversion constant 35.31 Hydrocarbon pore volume ­
(m3
) 1.051
Gas volume factor ­
(ft3
/SCF) 180 Original gas in place ­
(m3
) 189.248
Jumman Shah-01 Upper contact (m) 1530 Polygon area ­
(m2
) 0.172
Lower contact (m) 1620 Polygon area within grid ­
(m2
) 0.160
Net/gross ratio 0.500 Gross volume ­
(m3
) 15.896
Average porosity 0.190 Net volume ­
(m3
) 7.948
Average water saturation 0.685 Pore volume ­
(m3
) 1.510
Unit conversion constant 35.31 Hydrocarbon pore volume ­
(m3
) 0.475
Gas volume factor ­
(ft3
/SCF) 180 Original gas in place ­
(m3
) 85.614
Arab J Geosci (2022) 15:321 	
1 3
Page 13 of 14  321
Abbasi SA, Solangi SH, Nazeer A, Asim S, Habib W, Solangi IA
(2015b) An overview of structural style and hydrocarbon poten-
tial of Jabo Field, Southern Sindh Monocline, Southern Indus
Basin. Pakistan Sindh University Research Journal-SURJ (sci-
ence Series) 47(2):347–354
Abbey CP, Okpogo EU, Atueyi IO (2018) Application of rock phys-
ics parameters for lithology and fluid prediction of ‘TN’ field
of Niger Delta basin. Nigeria Egyptian Journal of Petroleum
27(4):853–866
Abd El_Kader A (2016) The use of seismic interpretations to dis-
cover and evaluate the new hydrocarbon prospects of Juras-
sic formations in JG field, NEAG concession, North Western
Desert. J Petrol Sci Eng 147:654-671.
Ahmad SM, Malick KL (1998) Khaskheli Field–an explanation of
structural complexity by field performance. Proceedings SPE/
PAPG ATC. 176–213
Ahmed S (2018) Study of tectonic evolution of structures and their
hydrocarbon potential using seismic data, Southern Sindh Mon-
ocline, Pakistan (Doctoral dissertation, University of Sindh,
Jamshoro)
Ahmed S, Solangi SH, Brohi IA, Lashari KQD, RA (2014) Study of
stratigraphy and structural styles in the subsurface of Southern
Sindh Monocline, Pakistan: using seismic and well data. Sindh
Univ Res J-SURJ (Sci Ser) 46(4):439–446
Ahmed S, Solangi SH, Jadoon MSK, Nazeer A (2018) Tectonic evo-
lution of structures in Southern Sindh Monocline, Indus Basin,
Pakistan formed in multi-extensional tectonic episodes of Indian
Plate. Geodesy Geodyn 9(5):358–366
Andreassen K, Nilssen EG, Ødegaard CM (2007) Analysis of shal-
low gas and fluid migration within the Plio-Pleistocene sedi-
mentary succession of the SW Barents Sea continental margin
using 3D seismic data. Geo-Mar Lett 27(2–4):155–171
Archie GE (1952) Classification of carbonate reservoir rocks and
petrophysical considerations. AAPG Bull 36(2):278–298
Ardo BU (2016) Correlating core analysis and well logging. Oil 
Gas Research Publication
Asquith GB, Gibson CR (1982) Basic well log analysis for geolo-
gists. AAPG Methods in Exploration Series. Am Assoc Petrol
Geol, Oklahoma. 216p
Asquith GB, Krygowski D, Gibson CR (2004)  Basic well log
analysis (Vol. 16). Tulsa: American Association of Petroleum
Geologists
Bello R, Onifade YS (2016) Discrimination of reservoir fluid con-
tacts using compressional and shear wave velocity. Global J
Pure Appl Sci 22(2):177–190
Biswas SK (1982) Rift basins in western margin of India and their
hydrocarbon prospects with special reference to Kutch basin.
AAPG Bull 66(10):1497–1513
Burianyk M, Pickfort S (2000) Amplitude-vs-offset and seismic rock
property analysis: a primer. CSEG Recorder 25(9):6–16
Castagna JP, Batzle ML, Eastwood RL (1985) Relationships between
compressional-wave and shear-wave velocities in clastic silicate
rocks. Geophysics 50(4):571–581
Copestake P, Cooper BA, Slatford M, Vanstone S, Maqsood T,
Ashraf M. (1996) Sequence stratigraphy of the Upper Jurassic-
mid Cretaceous of the Indus Basin, Pakistan and the Rajasthan
area of India. Proceedings of the International Symposium on
Sequence Stratigraphy in S.E. Asia Pages. 477–481
Dake LP (1983) Fundamentals of reservoir engineering (Vol. 8). Elsevier
Darling T (2005) Well logging and formation evaluation. Elsevier
Demirmen F (2007) Reserves estimation: the challenge for the indus-
try. J Petrol Technol 59(05):80–89
Ebdon C, Wasimuddin M, Malik AH, Akhter S (2004) Sequence stra-
tigraphy of the B Sand (upper sand, Lower Goru Formation) in
the Badin area: implication for development and exploitation.
In Annual Technical Conference, Islamabad, Pakistan. 179–197
Etherington J, Pollen T, Zuccolo L (2005) Comparison of selected
reserves and resource classifications and associated defini-
tions, Mapping Subcommittee, Final Report-December. Soci-
ety of Petroleum Engineers, Oil and Gas Reserves Committee
(OGRC)
Farfour M, Yoon WJ, Kim J (2015) Seismic attributes and acoustic
impedance inversion in interpretation of complex hydrocarbon
reservoirs. J Appl Geophys 114:68–80
Ferrie GH (1981) Well-site formation evaluation by analysis of hydro-
carbon ratios. In Annual Technical Meeting. Petroleum Society
of Canada
Foster NH, Beaumont EA (eds) (1999) Exploring for oil and gas traps.
American Association of Petroleum Geologists
Hamada GM (2004) Reservoir fluids identification using Vp/Vs ratio?
Oil Gas Sci Technol 59(6):649–654
Hamilton EL (1979) Vp/Vs and Poisson’s ratios in marine sediments
and rocks. J Acoust Soc Am 66(4):1093–1101
Ihianle OE, Alile OM, Azi SO, Airen JO, Osuoji OU (2013) Three
dimensional seismic/well logs and structural interpretation
over ‘X-Y’ field in the Niger Delta area of Nigeria. Sci Technol
3(2):47–54
Jahn F, Cook M, Graham M (2008) Volumetric estimation. Dev Pet
Sci. 55173–189
James B, Grundy AT, Sykes MA (2013) The depth-area-thickness
(DAT) method for calculating gross rock volume: a better way
to model hydrocarbon contact uncertainty. AAPG International
Conference  Exhibition. AAPG Search and Discovery Article
#90166©2013 Cartagena, Colombia 8–11 September
Khalid P, Ehsan MI, Akram S, Din ZU, Ghazi S (2018) Integrated
reservoir characterization and petrophysical analysis of Creta-
ceous Sands in Lower Indus Basin, Pakistan. J Geol Soc India
92(4):465–470
Kumar M, Dasgupta R, Singha DK, Singh NP (2018) Petrophysical
evaluation of well log data and rock physics modeling for charac-
terization of Eocene reservoir in Chandmari oil field of Assam-
Arakan basin, India. J Pet Explor Prod Technol 8(2):323–340
Kupecz JA, Gluyas J, Bloch S (1997) Reservoir quality prediction in
sandstones and carbonates: an overview
Masaferro JL, Bourne R, Jauffred JC (2004) Three-dimensional seis-
mic volume visualization of carbonate reservoirs and structures.
AAPG Mem 81:11–41
Mehana M, El-monier I (2016) Shale characteristics impact on nuclear
magnetic resonance (NMR) fluid typing methods and correlations.
Petroleum 2(2):138–147
Milsom J (2003) Field geophysics (Vol. 25). John Wiley and Sons
Moradi S, Moeini M, al-Askari MKG, Mahvelati EH (2016) Deter-
mination of shale volume and distribution patterns and effective
porosity from well log data based on cross-plot approach for a
shaly carbonate gas reservoir. In IOP Conference Series: Earth
and Environmental Science (Vol. 44, No. 4, p. 042002). IOP
Publishing
Obeng-Manu OM (2015) Lithology and pore fluid prediction of a res-
ervoir using density, compressional and shear wave logs: a case
study of the Tano basin (Doctoral dissertation)
Owolabi AO, Omang BO, Oyetade OP, Akindele OB (2019) Reservoir
evaluation and volumetric analysis of Rancho Field, Niger Delta,
using well log and 3D seismic data. Open J Geol 9(13):974
Pixler BO (1969) Formation evaluation by analysis of hydrocarbon
ratios. J Petrol Technol 21(06):665–670
Powell CM, Roots SR, Veevers JJ (1988) Pre-breakup continental
extension in East Gondwanaland and the early opening of the
eastern Indian Ocean. Tectonophysics 155(1–4):261–283
Quadri VUN, Shuaib SM (1986) Hydrocarbon prospects of southern
Indus basin. Pak AAPG Bull 70(6):730–747
Raza HA, Ali SM, Ahmed R (1990) Petroleum geology of Kirthar sub-
basin and part of Kutch Basin. Pak J Hydrocarb Res 2(1):27–73
Arab J Geosci (2022) 15:321
1 3
321   Page 14 of 14
Rogers R (2015) Offshore gas hydrates: origins, development, and pro-
duction. Gulf Professional Publishing
Schenk CJ, Tennyson ME, Klett TR, Finn TM, Mercier TJ, Gas-
wirth SB, Marra KR, Le PA, Hawkins SJ, Leathers-Miller HM
(2017) Assessment of undiscovered oil and gas resources in the
Lower Indus Basin, Pakistan, 2017 (No. 2017–3034). US Geo-
logical Survey
Sheriff RE (2002) Encyclopedic dictionary of applied geophysics. Soci-
ety of exploration geophysicists
Sustakoski, RJ, Morton-Thompson D (1992) Reserves Estimation: Part
10. Reservoir Engineering Methods
Treloar PJ, Coward MP (1991) Indian Plate motion and shape: con-
straints on the geometry of the Himalayan orogen. Tectonophysics
191(3–4):189–198
Wandrey CJ, Law BE, Shah HA (2004) Sembar Goru/Ghazij compos-
ite total petroleum system, Indus and Sulaiman-Kirthar geologic
provinces, Pakistan and India (No. 2208-C)
Wyllie MRJ, Gregory AR, Gardner LW (1956) Elastic wave veloci-
ties in heterogeneous and porous media. Geophysics 21(1):41–70
Xie CG (2015) Applications of tomography in oil-gas industry–Part 1.
In Industrial Tomography (pp. 591–632). Woodhead Publishing
Zhao L, Geng J, Han DH, Cheng J, Guo T (2013, September) Rock
physics based probabilistic lithology and fluid prediction in a het-
erogeneous carbonate reservoir. In 2013 SEG Annual Meeting.
OnePetro

Furqan article

  • 1.
    Vol.:(0123456789) 1 3 Arabian Journalof Geosciences (2022) 15:321 https://doi.org/10.1007/s12517-021-09381-5 ORIGINAL PAPER Lithology identification and gross rock volume estimation of B‑Sand in NIM Block, Lower Indus Basin, Pakistan Furqan Mahmud Butt1,2  · Shazia Naseem1,3 Received: 31 July 2019 / Accepted: 21 December 2021 © Saudi Society for Geosciences 2022 Abstract Reservoir elastic parameters and gross rock volume (GRV) calculation are useful methods for measuring lithology and estimating hydrocarbon deposits in a reservoir. Using well log and seismic data, in the present study rock physics and GRV are applied to the B-Sand, which is part of the Lower Goru Formation. For wells Dars West-01 and Jumman Shah-01, the reservoir B-Sand depth is estimated to be between 1852–1944 m and 1534–1618 m, respectively. As a result, it is important to use well log cross-plots to reliably delineate the sand body and measure the petrophysical properties of the mapped sand- stone intervals within the formation. These cross-plots were used to differentiate between hydrocarbon-filled and water-filled sandstone. The numerous rock physics cross-plots are used to differentiate between gas sand, oil sand, brine, and shale. Petrophysical analysis shows that reservoir has good porosity and holds significant amount of hydrocarbon but is water wet. Some of the rock properties cross-plotted together show a linear relationship and do not differentiate easily regarding lithology, while the remainder of the cross-plot shows that the reservoir is predominantly sand with very few traces of shale. GRV and original gas in place (OGIP) are calculated in B-Sand which reveals that Dars West-01 as compared to Jumman Shah-01 holds not only a significant amount of hydrocarbon but is also less saturated with water. The present study shows that the cross-plots and GRV approach can be used to accurately delineate reservoirs for further formation evaluation and for the estimation of reserves. It therefore means that an outright estimation of petrophysical properties on wrongly delineated reservoirs can significantly affect the porosity, permeability, pore-size geometry, and net-to-gross ratio and reserve estimation. Keywords  Elastic properties · Reservoir lithology · Petrophysical parameters · Gross rock volume · NIM area Introduction Lithology identification is a technique for recognizing and distinguishing subsurface geological formations, as well as the fluids they generate (oil, gas, or water). Lithology identi- fication of geological beds in the subsurface is critical in res- ervoir characterization since it is impossible to anticipate the fluid content of any geological bed without first understand- ing the lithology with which the fluid is connected (Ferrie 1981; Pixler 1969). Petrophysical analyses, such as porosity, clay volume, water saturation, pore fluid, and pore shapes and sizes, rely on accurate determination and comprehen- sion of lithology which is critical for successful hydrocarbon exploration and production (Obeng-Manu 2015). There are a variety of ways for the estimation of lithol- ogy and the amount of the fluids (oil/gas or water) present in the formation, but the most effective way is to have the examination of the core samples collected from the for- mation, but they are a costly affair (Obeng-Manu 2015). For this reason, logs are used as an indirect method to identify the lithology. Logs such as gamma ray logs are used to identify and estimate the presence of sand and shale based on the amount of radioactive material present (Darling 2005), and density log indicates formation bulk density and photoelectric absorption index of the geologic column drilled by the bore hole; it is frequently utilized in association with the gamma ray log (Ardo 2016). The combination of neutron-density and deep resistivity logs Responsible Editor: Narasimman Sundararajan * Furqan Mahmud Butt furqanmahmud@student.qau.edu.pk 1 Department of Earth Sciences, Quaid-E-Azam University, Islamabad, Pakistan 2 COMSATS University Islamabad, Islamabad, Pakistan 3 Institute of Geophysics and Geomatics (IGG), China University of Geosciences (CUG), Wuhan 430074, China
  • 2.
    Arab J Geosci(2022) 15:321 1 3 321   Page 2 of 14 is utilized in fluid flow estimation in rocks under research in traditional well log interpretation, and because there are ambiguities in this method, it cannot be claimed to be absolute (e.g., miscalculations due to the presence of radioactive elements) (Abbey et al. 2018). The goal of rock physics is to define rock characteristics based on how seismic waves travel through them. The used rock physics approach provides scientific insight into how the litho-fluid classes with distinct rock characteristics may be connected to their respective elastic properties, and also the degree of separation, based on geological knowledge of the reserve (Zhao et al. 2013). Petrophysical analysis of well logs in terms of velocity (which is P-Wave ­ VP and S-Wave ­VS) and elastic properties allows for the measurement and determination of water saturation ­ (SW), hydrocarbon satura- tion ­(Shc), porosity, lithology, horizons, faults, and uncon- formities, among other things (Kupecz et al. 1997). Fluid type identification can also be done through velocity analy- sis specially in gas reservoirs (Hamada 2004). It is known that when the ­ VP and ­ VS velocities face a reduction in brine saturation relative to hydrocarbon saturation, the ­ VP veloc- ity declines and the ­ VS velocity increases. Within the region of free gas or free hydrocarbon saturation, this reasoning is valid (Bello and Onifade 2016). The ­ VP/VS ratio cross-plot may be used to detect fluids, and it can also be used to deter- mine the sand/shale ratio in the subsurface. Cross-plots are schematic depictions of the interaction between two or more attributes that are used to visibly dis- tinguish or track irregularities including the existence of hydrocarbon or other fluids and lithologies (Kumar et al. 2018). One of the most beneficial and dynamic approaches to get two rock properties and their characteristics at the same time is to use the cross-plotting technique of elastic properties from well logs (Burianyk and Pickfort 2000; Bello and Onifade 2016). The GRV technique is the most appropriate technique or parameter used in all subsurface traps to assess meas- urement, reserve, and magnitude of resource volume con- centration or potential reservoir concentration (Etherington et al. 2005; Demirmen 2007; Ihianle et al. 2013). It is fun- damentally important to estimate both estimation and scope of uncertainty for GRV accuracy and more possibly close to approximation in any petroleum analysis. Geological traps exist in an assortment of ranges in shape, i.e., from over- turned limbs to multiple high points along axis of folds, from simple anticlines that resemble overturned bowl to all man- ner of complexly arranged structural features with variable dips. In these cases of a diverse suite of trap configurations reserve estimation can be calculated from GRV calculation method (James et al. 2013). In the present study, petrophysical and rock physical anal- ysis is carried out to estimate reservoir elastic properties. Based on elastic parameters, reservoir lithology is identified and GRV is calculated which further help in hydrocarbon identification and reservoir characterization. Geology/area of study On the junction of three lithospheric plates, i.e., Arabian, Indian, and Eurasian Plates, lies the location of Pakistan. Until early Mesozoic, i.e., before 200 ma, Indian Plate was part of Gondwanaland and Sindh Monocline which lies within the Lower Indus Basin that came into existence from Jurassic to early Cretaceous when the movement of Indian Plate started northward (Powell et al. 1988; Raza et al. 1990; Treloar and Coward 1991; Ahmed et al. 2014). In late Triassic to early Jurassic, counterclockwise rota- tion of Gondwanaland started. Indian Plate in mid-Jurassic got separated from Gondwanaland and started moving at a speed of 3–5 cm/year. During late Cretaceous to Paleocene, the western margin of Indian Plate crossed the equator. Later in Cretaceous age, the movement attained its maxi- mum speed of around 15–20 cm/year; in this period, it also passed over the mantle thermal center at latitude 70°S and longitude 72°E having counterclockwise rotation. Indian Plate collided with the south margin of Eurasian Plate in late Paleocene to Eocene, while spreading motion slowed down to 4 to 6 cm/year. Final collision with Eurasian Plate occurred in Eocene–Oligocene which resulted in formation of Himalayan Mountains. The event of beginning of this continent–continent collision is known as Maastrichtian (Ahmed 2018; Biswas 1982; Copestake et al. 1996; Ahmed et al. 2018; Abbasi et al. 2015a, 2015b) (Fig. 1). In 1977, oil and gas exploration started in Lower Indus Basin by Union Texas Petroleum (UTP) group and in 1981 at location of Khaskheli first oil discovery was made by UTP group (Quadri and Shuaib 1986). A total of 49 discoveries were made by UTP group until 1977 and formation in which discoveries were made was Upper Sands of Lower Goru Formation (Ahmad and Malick 1998; Abbasi et al. 2015a, b; Copestake et al. 1996). Most of the discoveries that are made in Lower Goru Formation lies in Sindh Province, Pakistan that extends from Mari High in the north to Badin area in the south (Ahmed et al. 2014) (Fig. 2). In this area, Sember and Lower Goru Formations are the most important packages. Seven members exist in these formations which are named as Upper Sand, Upper Shale, Middle Sand, Lower Shale, Basal Sand, Talhar Shale, and Massive Sand (Abbasi et al. 2015a, b) (Fig. 1). Upper Shale, Lower Shale, Talhar Shale, and Sember are source rocks in this study area. Upper Sands is further divided into A, B, C, and D sands interbedded with shale and mud stone (Schenk et al. 2017; Wandrey et al. 2004). The sands of this area are the major hydrocarbon-producing reservoirs. The sands show very high porosity values which means
  • 3.
    Arab J Geosci(2022) 15:321 1 3 Page 3 of 14  321 that oil migrated from the Sember formation through the carrier beds and preserved the porosity present at the time of migration (Ahmed et al. 2014). B-Sand has long been a lithostratigraphic unit with a sheet-like distribution around the Lower Indus Basin (Fig. 2). B-Sand has been divided up into distinct lower and upper units in some areas, but these Fig. 1  a Location of study area within Lower Indus Basin, Pakistan. b Figure of total area of NIM Exploration Block. c Base map of study area Fig. 2  Generalized stratigraphy of the area in the Lower Indus Basin. The Lower Goru Formation is Aptian to Albian in age; the focus of this study is marked by the red rectangle
  • 4.
    Arab J Geosci(2022) 15:321 1 3 321   Page 4 of 14 have not been formed everywhere, and the restrictions on the creation of these units are uncertain (Ebdon et al. 2004). Chiltan Limestone which lies beneath Sember formation has a conformable contact (Khalid et al. 2018). The project area “NIM Block” is situated in districts of Hyderabad and Tando Allahyar, Sindh Province, Pakistan (Fig. 2) with a total area of 235.26 ­ km2 and is operated jointly by the Oil and Gas Development Company (OGDC) (95%) and Government Holdings Private Limited (GHPL) (5%). Geologically, it lies in the Lower Indus Basin and to the south of Southern Sindh Monocline. Methodology The reservoir description in a typical seismic interpretation approach is based primarily on the mapping and detection of horizons and faults in a 3D seismic survey, which may lead to a more comprehensive interpretation on a regional and local scale within the reservoir of interest (Masaferro et al. 2004). The methodology involved in seismic interpre- tation is to determine, evaluate, and discover hydrocarbon prospects in the subsurface which also define the nature of the reservoir on the area of interest (Abd El_Kader 2016). For the present research, 3D seismic reflection data (15 ­km2 ) and two wells’ data were provided from OGDC by Directorate General Petroleum Concessions (DGPC) of Pakistan. To do seismic interpretation of any specific area, we rely on available information that can be from old jour- nals and on the stratigraphy of the field area. After this study is done, we do correlation of seismic section with available formation tops (Table 1) from wells that are being drilled. The interpretational process of seismic data includes impor- tant geological structure correspondence to reflectors of seismic section. In tracing reflector processes, we must do seismic line to line tie points, and it requires very accurate phase correlation of the events. Faults, folds, any sedimentation characteristics, or any stratigraphic feature are examined during the present study. The times associated with each of the interpreted reflectors are then converted from time section to depth sections using this model. To find dominant lithology, first petrophysical analysis is done and considering these analysis elastic prop- erties of formation is determined. In the present study, petro- physics, elastic properties, and GRV are estimated using data obtained from seismic and well logs of two wells, namely, Jumman Shah-01 and Dars West-01. From petrophysical analysis, volume of shale ­ (Vsh), density porosity (PHID), effective porosity (PHIE), sonic porosity (PORS), ­ Sw, and ­Sh are determined. In elastic properties, ­ Vp and ­ Vs are cal- culated from delay time (DT) log, and from these velocities, ­Vp/Vs, σ, and acoustic impedance (AI) are calculated. After those different cross-plots are generated, it gives us clear insight of lithology patterns. When the above analysis is completed, volumetric estimates (GRV) are made by analyz- ing contours and faults on time map. From GRV net-to-gross ratio, gross, net, pore, hydrocarbon pore volume, and OGIP information of reservoir are calculated. In the end, all results are summed up and complied given that this area is suitable for more exploration or not. The objectives and purpose of the petrophysical analysis is to determine different physical properties and behavior of reservoir rocks that exist within the reservoir zone (Fig. 3). To depict pay zones which are present in reservoir and to quantify hydrocarbon saturation present in the reservoir, log techniques are applied in Jumman Shah-01 and Dars West-01. The following steps are followed to achieve these objectives. 1. Carrying out log interpretation to mark the suitable res- ervoir zones 2. Computation of reservoir rocks characteristics using wireline logs 3. Interpretation of the measured parameters for the evalu- ation of the hydrocarbon potential of the study area. Figure 3 describes the workflow of the petrophysical interpretation that is discussed above. Shale is a rock which has more radioactivity than sands and carbonate rocks. ­ Vsh is the amount of shale that is present in the formation of sand or in carbonates (Mehana Table 1  Information about formation tops in Jumman Shah-01 and Dars West-01 Well name: Jumman Shah-01 Dars West-01 Latitude: 25°28′32.75ʺ N 25°28′41.2ʺ N Longitude: 68°43′50.86ʺ E 68°44′16.5ʺ E Total depth (m): 3802 2102 Formation name Depth (m) Depth (m) Laki NA 470 Ranikot 823 825 Khadro 1096 1079 Parh 1155 1134 Upper Goru 1250 1204 B-Sand 1534 1852 Badin Shale 1618 1944 C-Sand 1669 Jhol Shale 1778 D-Sand 1829 Upper Shale 1875 Middle Sand 2315 Lower Shale 2394 Basal Sand 2578 Sember 3019 Chiltan 3737
  • 5.
    Arab J Geosci(2022) 15:321 1 3 Page 5 of 14  321 and El-monier 2016; Moradi et al. 2016). ­Vsh is calculated using the following formula (Asquith and Gibson 1982): where ­GRmax is maximum gamma ray and ­ GRmin is mini- mum gamma ray (in API). Porosity is the function of matrix density and bulk den- sity of formation along with the density of the saturation of fluid in rock called density porosity (PHID). Formula for calculation of PHID is as follows (Foster and Beau- mont 1999): where ­RHOma is matrix density, ­ RHOb is formation bulk density (log value), and ­ RHOf is density of fluid saturating the rock immediately surrounding the borehole. Effective porosity (PHIE) is the total porosity less the fraction of the pore space occupied by shale or clay. PHIE is calculated in the following manner (Owolabi et al. 2019): where PHIE is effective porosity and NPHI is neutron porosity. (1) Vsh = ( GR − GRmin ) ( GRmax − GRmin ) (2) PHID = ( RHOma − RHOb ) ( RHOb − RHOf ) (3) PHIE = (PHID + NPHI) 2 × ( 1 − Vsh ) The Hydrogen Index (HI) in a reservoir is directly related to porosity, and neutron porosity calculation uses a neutron source to calculate it. The ratio of the concentration of hydrogen atoms per cubic centimeter in a sample to that of pure water at 75°F is known as the HI. Since hydrogen atoms can be found in both water- and oil-filled tanks, measuring their concentration can be used to estimate the volume of liquid-filled porosity (Asquith et al. 2004). Porosity that is calculated from the interval transit time of the wave is called the PORS. It is calculated from formula derived from Wyllie et al. (1956) given as follows: where ∆tlog is measured interval transit time (s), ∆tmatrix is interval transit time of rock matrix (s), and ∆tf is interval transit time of rock matrix (s). SW is the amount of water that is present in the pore spaces in the formation. ­ SW can be calculated by Archie Equation (Archie 1952) which is mentioned as where A is cementation constant, M is cementation expo- nent, N is saturation exponent, ­ Rt is resistivity of formation, and ­Rw is resistivity of water (Ω.m). (4) PORS = Δtlog − Δtmatrix Δtf − Δtmatrix (5) Sw = { A × Rw PHIEm × Rt } 1 N Fig. 3  Petrophysical interpreta- tion workflow that is followed in the present study
  • 6.
    Arab J Geosci(2022) 15:321 1 3 321   Page 6 of 14 Saturation of reservoir is equal to ­ Shc plus ­ Sw (Dake 1983); from this, we can get ­ Shc which is mathematically expressed as VP, also known as primary velocity, is the first wave that is recorded in a seismograph (Milsom 2003). ­VP can be cal- culated by simply taking reverse of DT log multiplied by ­ 106 . Formula for calculation of ­ VP is as follows: where DT is delay time (DT) log (µs/ft). VS is also known as secondary wave; it tends to move in the direction which is perpendicular to the motion of propagation of the wave (Xie 2015). Here, ­ VS is calculated from the equa- tion (Castagna et al. 1985) which is given as where ­VS and Vp are S- and P-wave velocity (km/s). Poisson’s ratio (σ) is the measure of the amount of trans- verse distortion compared to longitudinal distortion; here, we have determined σ from ­ VP/VS ratio (Sheriff 2002; Hamilton 1979) mathematically expressed as AI is the image or depiction of the properties of rocks that lie in the subsurface (Farfour et al. 2015). It is resolved when density of formation is multiplied by velocity with which it travels in the formation given as (Rogers 2015; Andreassen et al. 2007) where V is velocity (m/s) and Rho is density (g/cm3 ). Gross rock volume (GRV) is the calculation of how much volume or quantity of fluids, whether oil or gas, are present in the subsurface. Method and equations regarding calculation of GRV are mentioned as (Sustakoski and Morton-Thompson 1992; Jahn et al. 2008) (6) Shc = 1 − Sw (7) Vp = 106 DT (8) Vs = ( Vp − 1.36 ) 1.16 (9) σ = ⎧ ⎪ ⎪ ⎨ ⎪ ⎪ ⎩ 0.5 × � V2 p V2 s � �V2 p V2 s � − 1 ⎫ ⎪ ⎪ ⎬ ⎪ ⎪ ⎭ (10) AI = Rho × V (11) Gv = A × Zvalue (12) Pv = Nv − ϕ (13) HPv = Pv − ( 1 × Sw ) where Gv gross volume ­(m3 ) (calculated based on structure grid whether single or dual). A area of reservoir ­ (m2 ) from map data. Zvalue a depth value or a zone attribute within the grid cell. Pv pore volume ­(m3 ). Nv net volume ­(m3 ) (volume between two surfaces within an area). ϕ porosity (decimal) from log and/or core data. HPv hydrocarbon pore volume ­ (m3 ). OGIP original gas in place ­ (m3 ). h height or thickness of pay zone (m) from log and/ or core data. Sw water saturation (decimal) from log and/or core data. Bgi formation volume factor for gas at initial conditions ­(m3 /m3 ). Results and discussion The horizon (B-Sand) that is marked here is based on the well data, formation tops (Table 1), and generation of synthetic seismogram (Fig. 4). Here, B-Sand is marked by green color (Fig. 5) and shows the Inline No. 71; four faults are marked as Fault-1, Fault-2, Fault-3, and Fault-4. The faults that are marked are normal faults which clearly show that the area is experiencing the extensional forces. In Fig. 5, we see half graben structures, and these structures are responsible for the accumulation of hydrocarbons in B-Sand. For the construc- tion of time contour maps, B-Sand is picked throughout the project area by creating a time grid map (Fig. 6a). Here, the time section reveals an increase in time from west to east. To generate the depth contour map (Fig. 6b), first the velocity is calculated by taking time from the seismic section and depth from the well data to convert the time grid into depth grid. The surface maps represent the lateral and vertical distribution of the formation. Amplitude map of B-Sand has been prepared and is shown in Fig. 6c. Greenish yellow to red show high amplitude zones and Dars West-01 lies in this zone and the status of this well is gas condensate and producing. Jumman Shah-01 also lies in this zone, but the status of this well is plugged and abandoned because of the structural implications (Fig. 6b) and secondly quite possibly due to shallow depth. Light blue to blue color shows the medium amplitude and dark blue color shows low amplitude zones. Low amplitude zones exist on the eastern and western part of the area. (14) OGIP = { A × h × ϕ × ( 1 − Sw )}/ Bgi
  • 7.
    Arab J Geosci(2022) 15:321 1 3 Page 7 of 14  321 For petrophysics, we have analyzed well logs and from that a hydrocarbon-bearing zone B-Sand is identified from the two wells given. Results of these calculations are given in Table 2 and petrophysical interpretation of B-Sand is given in Fig. 7a and b for Dars West-01 and Jumman Shah-01, respectively. This argument can be identified in Fig. 7a and b as average values of these wells are corresponding to 35 API (Jumman Shah-01) and 40 API (Dars West-01) presuming that this reservoir consists of mostly sand. From Table 2, ­Vsh in Jumman Shah-01 and Dars West-01 is 18% and 20%, respec- tively. This shows that B-Sand consists of mostly sand and very small concentrations of shale in both wells (Fig. 7a, b). In Jumman Shah-01, PHID, PHIE, and PORS values are approximately 22%, 16%, and 22%, respectively, and Fig. 4  The synthetic seismogram is created using the Jumman Shah-01 well data Fig. 5  Seismic section (In-line 71) presenting the marked B-Sand (green), faults and wells
  • 8.
    Arab J Geosci(2022) 15:321 1 3 321   Page 8 of 14 Fig. 6  a Time contour map of B-Sand with contour of interval 0.005 s. b Depth contour map of B-Sand with contour interval of 5 m. c Amplitude contour map of B-Sand with contour interval of 5 m
  • 9.
    Arab J Geosci(2022) 15:321 1 3 Page 9 of 14  321 in Dars West-01 values are approximately 18%, 11%, and 18%, respectively (Table 2), which shows that both wells have fair to good porosity. From this, we can also assume that reservoir has good quality sand (Fig. 7a, b). In the end, we calculated ­ Sw. The value of ­ Sw in Jumman Shah-01 is greater than 79% which shows that despite having fair to good porosity, this well has high concentration of water; in Dars West-01, ­ Sw is greater than 43%, and this shows that it has a very good concentration of hydrocarbons present in reservoir (Fig. 7a, b). Table 2  Petrophysical values of parameters in B-Sand encountered in wells under study Sr. no Well name Depth (m) Vsh (%) PHID (%) PHIE (%) PORS (%) Sw (%) Shc (%) 1 Dars West-01 1852–1944 20.5 18.6 11.0 18.42 43.7 56.3 2 Jumman Shah-01 1534–1618 18.6 22.6 16.98 22.48 79.75 20.2 Fig. 7  a Petrophysical interpretation for Dars Wes-01. b Petrophysical interpretation for Jumman Shah-01 showing the estimation and calcula- tion of volume of shale ­ (Vsh), porosities (PHID and PHIE), water saturation ­ (SW), and hydrocarbon saturation ­ (Shc)
  • 10.
    Arab J Geosci(2022) 15:321 1 3 321   Page 10 of 14
  • 11.
    Arab J Geosci(2022) 15:321 1 3 Page 11 of 14  321 VP against ­ VS cross-plot is shown in Fig. 8a and b and density is used to demonstrate the response of velocities as a colored variation. Here, the lithology is characterized as sand and shale based on velocity ratio values. A linear pattern is seen by the ­VP and ­ VS cross-plot. The P-wave velocity values at Dars West- 01 are estimated in the range of 3200–3600 m/s (Fig. 8a) and for Jumman Shah-01 they are in the range of 3000–3200 m/s (Fig. 8b), equal to the 2–2.1 g/cm3 density range. The ­ VS val- ues are in the 1600–1800 m/s range at Dars West-01 (Fig. 8a) and 1300–1600 m/s (Fig. 8b) within the 2–2.2 g/cm3 density range. In comparison to density values, high values of ­ VP and low values of ­ VS indicate that this segment of formation has sand accumulation, and they are also well-sorted grains. A cross-plot of ­ VP/VS and AI is shown in Fig. 8c and d for Dars West-01 and Jumman Shah-01, respectively. To illustrate the difference in the sand-shale zones in the res- ervoir, density is taken as a color variance in this cross-plot. Cross-plot of AI against ­ VP/VS divides the B-Sand reservoir into two parts of sand and shale (Fig. 8c, d). In Fig. 8c and d, the velocity ratio values for sand are 1.7–2.0 (1.55–1.75 for shale) and 1.6–2.1 (1.75–2.0 for shale), respectively, and AI (Fig. 8c, d) values for sand are 7000–10,000 g/cm3 .m/s (10,400–13,800 g/cm3 .m/s for shale) and 7000–10,400 g/ cm3 .m/s (7700–12,000 g/cm3 .m/s for shale), respectively. The portion of sand and shale (Fig. 8c) has a density range of 2.0–2.5 g/cm3 and 2.5–2.6 g/cm3 , respectively, and in Fig. 8d, the portion of sand and shale has a density range of 2.1–2.5 g/ cm3 and 2.5–2.6 gm/cm3 , respectively. When all these values are summed up then this reveals that the formation consists mostly of sand lithology with some of small portions of shale as well. This cross-plot shows that ­ VP/VS and AI will give bet- ter understanding of the reservoir as compared to ­ VP against ­VS cross-plot. In Fig. 8e and f, ­Vsh is plotted against Pois- son’s ratio. GR log is used as a color graph to identify lithol- ogy more clearly. In Fig. 8e and f, B-Sand reservoir mainly consists of sand with very low content of shale because the values of ­ Vsh are 0–0.2 and 0–0.5, respectively. The reason behind our assessment is that in both figures, GR values are showing low values having a range of 9–73 API in Dars West- 01 and for Jumman Shah-01 the value has a range of 9–81 API, clearly showing sand lithology. Cross-plot of ­ VP and density color coded with GR differentiates reservoir based on lithology to sand, shale, or shaly sand. Here, B-Sand has a density range of 2.1–2.5 g/cm3 for well Dars West-01 (Fig. 8g) and 2.2–2.5 g/cm3 for well Jumman Shah-01 (Fig. 8h), indi- cating sands and higher values are showing shales. For the calculation of GRV in this area at first, the struc- ture, orientation of faults, and seismic interpretation have been carried out. Time chart (Fig. 6a) is used and two poly- gons are made around the wells for the calculation of GRV (Fig. 9). The area and working interest values for polygons are determined. These polygons are marked in context that the wells are located within this area and contours are showing a closure. So, this gives us the indication that some structural traps may be present. This indication is confirmed when in the map two faults are seen running side by side forming a trap. In Table 3, the volumetric parameters and calculations are shown. For calculations, we have selected “Single Structure” volumetric model for the present study. This model calculates gross rock volume between one struc- ture grid and up to two contact values. Contact value is the value of top and bottom of reservoir (1865 and 1945 m for Dars West-01 and for Jumman Shah 1530 to 1620 m). Calcu- lated results of OGIP in Dars West-01 and Jumman Shah-01 are 189.248 × ­106 and 85.614 × ­106 , respectively. From these estimations, we see that Dars West-01 has more gas content than Jumman Shah-01 and less saturated with water. Conclusion The lithology identification and elastic properties of B-Sand are measured using petrophysical interpretation, and GRV of the reservoir is calculated in the context of these measurements. Utilizing data from well logs, res- ervoir bed boundaries, lithology with local knowledge, petrophysical parameters, elastic properties, and hydro- carbon type (gas or oil) are determined. From the cross- plots, the lithology of the reservoir was estimated. Seis- mic section revealed fault assisted closures in the area, which correspond to half graben type structures, which served as trapping medium. The research demonstrated the feasibility of combining borehole data and structural maps to measure the hydrocarbon volume in place in the mapping of reservoir fluid boundaries. Petrophysical val- ues show that Jumman Shah-01 has higher porosity than Dars West-01 but contains higher concentrations of water. As Dars West-01 has significant amounts of hydrocarbons present, that is why this area must be explored more for further prospects. Time map and seismic section also revealed that principal structure responsible for hydrocar- bon entrapment in this field is half graben type structure which shows that reservoir is trapped within this structure. Extensive faults, which were structure building faults, sup- port suspected hydrocarbon prospects that can be explored Fig. 8  a ­VP against ­ VS for Dars West-01 and b ­VP against ­ VS for Jum- man Shah-01. Linear graph is obtained by plotting the VP vs. ­ VS. Lithology identification in this method is not easily identified. Here, density is taken to have the colored variation. c VP/VS ratio against acoustic impedance of Dars West-01. d VP/VS ratio against acous- tic impedance of Jumman Shah-01. Here, density is taken as colored variation to identify different zones. e Poisson’s ratio against volume of shale for B-Sand across Dars West-01. f Poisson’s ratio against volume of shale for B-Sand across Jumman Shah-01. Here, gamma ray is taken as colored variation to identify the lithology more easily. g Cross-plot of VP against density for Dars West-01. h Cross-plot of VP against density for Jumman Shah-01 ◂
  • 12.
    Arab J Geosci(2022) 15:321 1 3 321   Page 12 of 14 in future. Cross-plots show that both wells contain a sig- nificant amount of sand, but there are very thin shale layers also present in this formation. Estimated reserve of gas in place estimation reveals that Dars West has a significant amount of hydrocarbon as compared to Jumman Shah-01, and Jumman Shah-01 contains more water content, which is why it is not fit for production. Declarations  FM has done the interpretation of the data, has also done the analysis related to petrophysics, and has written this research paper. SA has supervised all this research and all these analyses were made possible by the supervision of SA. Furthermore, there are no conflict of interests and competing interests. References Abbasi SA, Solangi SH, Ali A (2015a) Seismic data interpretation: a case study of Southern Sindh Monocline, Lower Indus Basin, Pakistan. Mehran University Research Journal of Engineering and Technology 34(2):107–115 Fig. 9  Polygon area (pink) around which gross rock volume of reservoir is estimated with a contour interval of 0.005 s Table 3  Gross rock volume calculation of Dars West-01 and Jumman Shah-01 Wells Volumetric parameters Volumetric calculations (× ­ 106 ) Dars West-01 Upper contact (m) 1865 Polygon area ­ (m2 ) 0.494 Lower contact (m) 1945 Polygon area within grid ­ (m2 ) 0.441 Net/gross ratio 0.800 Gross volume ­ (m3 ) 45.567 Average porosity 0.050 Net volume ­ (m3 ) 36.454 Average water saturation 0.423 Pore volume ­ (m3 ) 1.8227 Unit conversion constant 35.31 Hydrocarbon pore volume ­ (m3 ) 1.051 Gas volume factor ­ (ft3 /SCF) 180 Original gas in place ­ (m3 ) 189.248 Jumman Shah-01 Upper contact (m) 1530 Polygon area ­ (m2 ) 0.172 Lower contact (m) 1620 Polygon area within grid ­ (m2 ) 0.160 Net/gross ratio 0.500 Gross volume ­ (m3 ) 15.896 Average porosity 0.190 Net volume ­ (m3 ) 7.948 Average water saturation 0.685 Pore volume ­ (m3 ) 1.510 Unit conversion constant 35.31 Hydrocarbon pore volume ­ (m3 ) 0.475 Gas volume factor ­ (ft3 /SCF) 180 Original gas in place ­ (m3 ) 85.614
  • 13.
    Arab J Geosci(2022) 15:321 1 3 Page 13 of 14  321 Abbasi SA, Solangi SH, Nazeer A, Asim S, Habib W, Solangi IA (2015b) An overview of structural style and hydrocarbon poten- tial of Jabo Field, Southern Sindh Monocline, Southern Indus Basin. Pakistan Sindh University Research Journal-SURJ (sci- ence Series) 47(2):347–354 Abbey CP, Okpogo EU, Atueyi IO (2018) Application of rock phys- ics parameters for lithology and fluid prediction of ‘TN’ field of Niger Delta basin. Nigeria Egyptian Journal of Petroleum 27(4):853–866 Abd El_Kader A (2016) The use of seismic interpretations to dis- cover and evaluate the new hydrocarbon prospects of Juras- sic formations in JG field, NEAG concession, North Western Desert. J Petrol Sci Eng 147:654-671. Ahmad SM, Malick KL (1998) Khaskheli Field–an explanation of structural complexity by field performance. Proceedings SPE/ PAPG ATC. 176–213 Ahmed S (2018) Study of tectonic evolution of structures and their hydrocarbon potential using seismic data, Southern Sindh Mon- ocline, Pakistan (Doctoral dissertation, University of Sindh, Jamshoro) Ahmed S, Solangi SH, Brohi IA, Lashari KQD, RA (2014) Study of stratigraphy and structural styles in the subsurface of Southern Sindh Monocline, Pakistan: using seismic and well data. Sindh Univ Res J-SURJ (Sci Ser) 46(4):439–446 Ahmed S, Solangi SH, Jadoon MSK, Nazeer A (2018) Tectonic evo- lution of structures in Southern Sindh Monocline, Indus Basin, Pakistan formed in multi-extensional tectonic episodes of Indian Plate. Geodesy Geodyn 9(5):358–366 Andreassen K, Nilssen EG, Ødegaard CM (2007) Analysis of shal- low gas and fluid migration within the Plio-Pleistocene sedi- mentary succession of the SW Barents Sea continental margin using 3D seismic data. Geo-Mar Lett 27(2–4):155–171 Archie GE (1952) Classification of carbonate reservoir rocks and petrophysical considerations. AAPG Bull 36(2):278–298 Ardo BU (2016) Correlating core analysis and well logging. Oil Gas Research Publication Asquith GB, Gibson CR (1982) Basic well log analysis for geolo- gists. AAPG Methods in Exploration Series. Am Assoc Petrol Geol, Oklahoma. 216p Asquith GB, Krygowski D, Gibson CR (2004)  Basic well log analysis (Vol. 16). Tulsa: American Association of Petroleum Geologists Bello R, Onifade YS (2016) Discrimination of reservoir fluid con- tacts using compressional and shear wave velocity. Global J Pure Appl Sci 22(2):177–190 Biswas SK (1982) Rift basins in western margin of India and their hydrocarbon prospects with special reference to Kutch basin. AAPG Bull 66(10):1497–1513 Burianyk M, Pickfort S (2000) Amplitude-vs-offset and seismic rock property analysis: a primer. CSEG Recorder 25(9):6–16 Castagna JP, Batzle ML, Eastwood RL (1985) Relationships between compressional-wave and shear-wave velocities in clastic silicate rocks. Geophysics 50(4):571–581 Copestake P, Cooper BA, Slatford M, Vanstone S, Maqsood T, Ashraf M. (1996) Sequence stratigraphy of the Upper Jurassic- mid Cretaceous of the Indus Basin, Pakistan and the Rajasthan area of India. Proceedings of the International Symposium on Sequence Stratigraphy in S.E. Asia Pages. 477–481 Dake LP (1983) Fundamentals of reservoir engineering (Vol. 8). Elsevier Darling T (2005) Well logging and formation evaluation. Elsevier Demirmen F (2007) Reserves estimation: the challenge for the indus- try. J Petrol Technol 59(05):80–89 Ebdon C, Wasimuddin M, Malik AH, Akhter S (2004) Sequence stra- tigraphy of the B Sand (upper sand, Lower Goru Formation) in the Badin area: implication for development and exploitation. In Annual Technical Conference, Islamabad, Pakistan. 179–197 Etherington J, Pollen T, Zuccolo L (2005) Comparison of selected reserves and resource classifications and associated defini- tions, Mapping Subcommittee, Final Report-December. Soci- ety of Petroleum Engineers, Oil and Gas Reserves Committee (OGRC) Farfour M, Yoon WJ, Kim J (2015) Seismic attributes and acoustic impedance inversion in interpretation of complex hydrocarbon reservoirs. J Appl Geophys 114:68–80 Ferrie GH (1981) Well-site formation evaluation by analysis of hydro- carbon ratios. In Annual Technical Meeting. Petroleum Society of Canada Foster NH, Beaumont EA (eds) (1999) Exploring for oil and gas traps. American Association of Petroleum Geologists Hamada GM (2004) Reservoir fluids identification using Vp/Vs ratio? Oil Gas Sci Technol 59(6):649–654 Hamilton EL (1979) Vp/Vs and Poisson’s ratios in marine sediments and rocks. J Acoust Soc Am 66(4):1093–1101 Ihianle OE, Alile OM, Azi SO, Airen JO, Osuoji OU (2013) Three dimensional seismic/well logs and structural interpretation over ‘X-Y’ field in the Niger Delta area of Nigeria. Sci Technol 3(2):47–54 Jahn F, Cook M, Graham M (2008) Volumetric estimation. Dev Pet Sci. 55173–189 James B, Grundy AT, Sykes MA (2013) The depth-area-thickness (DAT) method for calculating gross rock volume: a better way to model hydrocarbon contact uncertainty. AAPG International Conference Exhibition. AAPG Search and Discovery Article #90166©2013 Cartagena, Colombia 8–11 September Khalid P, Ehsan MI, Akram S, Din ZU, Ghazi S (2018) Integrated reservoir characterization and petrophysical analysis of Creta- ceous Sands in Lower Indus Basin, Pakistan. J Geol Soc India 92(4):465–470 Kumar M, Dasgupta R, Singha DK, Singh NP (2018) Petrophysical evaluation of well log data and rock physics modeling for charac- terization of Eocene reservoir in Chandmari oil field of Assam- Arakan basin, India. J Pet Explor Prod Technol 8(2):323–340 Kupecz JA, Gluyas J, Bloch S (1997) Reservoir quality prediction in sandstones and carbonates: an overview Masaferro JL, Bourne R, Jauffred JC (2004) Three-dimensional seis- mic volume visualization of carbonate reservoirs and structures. AAPG Mem 81:11–41 Mehana M, El-monier I (2016) Shale characteristics impact on nuclear magnetic resonance (NMR) fluid typing methods and correlations. Petroleum 2(2):138–147 Milsom J (2003) Field geophysics (Vol. 25). John Wiley and Sons Moradi S, Moeini M, al-Askari MKG, Mahvelati EH (2016) Deter- mination of shale volume and distribution patterns and effective porosity from well log data based on cross-plot approach for a shaly carbonate gas reservoir. In IOP Conference Series: Earth and Environmental Science (Vol. 44, No. 4, p. 042002). IOP Publishing Obeng-Manu OM (2015) Lithology and pore fluid prediction of a res- ervoir using density, compressional and shear wave logs: a case study of the Tano basin (Doctoral dissertation) Owolabi AO, Omang BO, Oyetade OP, Akindele OB (2019) Reservoir evaluation and volumetric analysis of Rancho Field, Niger Delta, using well log and 3D seismic data. Open J Geol 9(13):974 Pixler BO (1969) Formation evaluation by analysis of hydrocarbon ratios. J Petrol Technol 21(06):665–670 Powell CM, Roots SR, Veevers JJ (1988) Pre-breakup continental extension in East Gondwanaland and the early opening of the eastern Indian Ocean. Tectonophysics 155(1–4):261–283 Quadri VUN, Shuaib SM (1986) Hydrocarbon prospects of southern Indus basin. Pak AAPG Bull 70(6):730–747 Raza HA, Ali SM, Ahmed R (1990) Petroleum geology of Kirthar sub- basin and part of Kutch Basin. Pak J Hydrocarb Res 2(1):27–73
  • 14.
    Arab J Geosci(2022) 15:321 1 3 321   Page 14 of 14 Rogers R (2015) Offshore gas hydrates: origins, development, and pro- duction. Gulf Professional Publishing Schenk CJ, Tennyson ME, Klett TR, Finn TM, Mercier TJ, Gas- wirth SB, Marra KR, Le PA, Hawkins SJ, Leathers-Miller HM (2017) Assessment of undiscovered oil and gas resources in the Lower Indus Basin, Pakistan, 2017 (No. 2017–3034). US Geo- logical Survey Sheriff RE (2002) Encyclopedic dictionary of applied geophysics. Soci- ety of exploration geophysicists Sustakoski, RJ, Morton-Thompson D (1992) Reserves Estimation: Part 10. Reservoir Engineering Methods Treloar PJ, Coward MP (1991) Indian Plate motion and shape: con- straints on the geometry of the Himalayan orogen. Tectonophysics 191(3–4):189–198 Wandrey CJ, Law BE, Shah HA (2004) Sembar Goru/Ghazij compos- ite total petroleum system, Indus and Sulaiman-Kirthar geologic provinces, Pakistan and India (No. 2208-C) Wyllie MRJ, Gregory AR, Gardner LW (1956) Elastic wave veloci- ties in heterogeneous and porous media. Geophysics 21(1):41–70 Xie CG (2015) Applications of tomography in oil-gas industry–Part 1. In Industrial Tomography (pp. 591–632). Woodhead Publishing Zhao L, Geng J, Han DH, Cheng J, Guo T (2013, September) Rock physics based probabilistic lithology and fluid prediction in a het- erogeneous carbonate reservoir. In 2013 SEG Annual Meeting. OnePetro