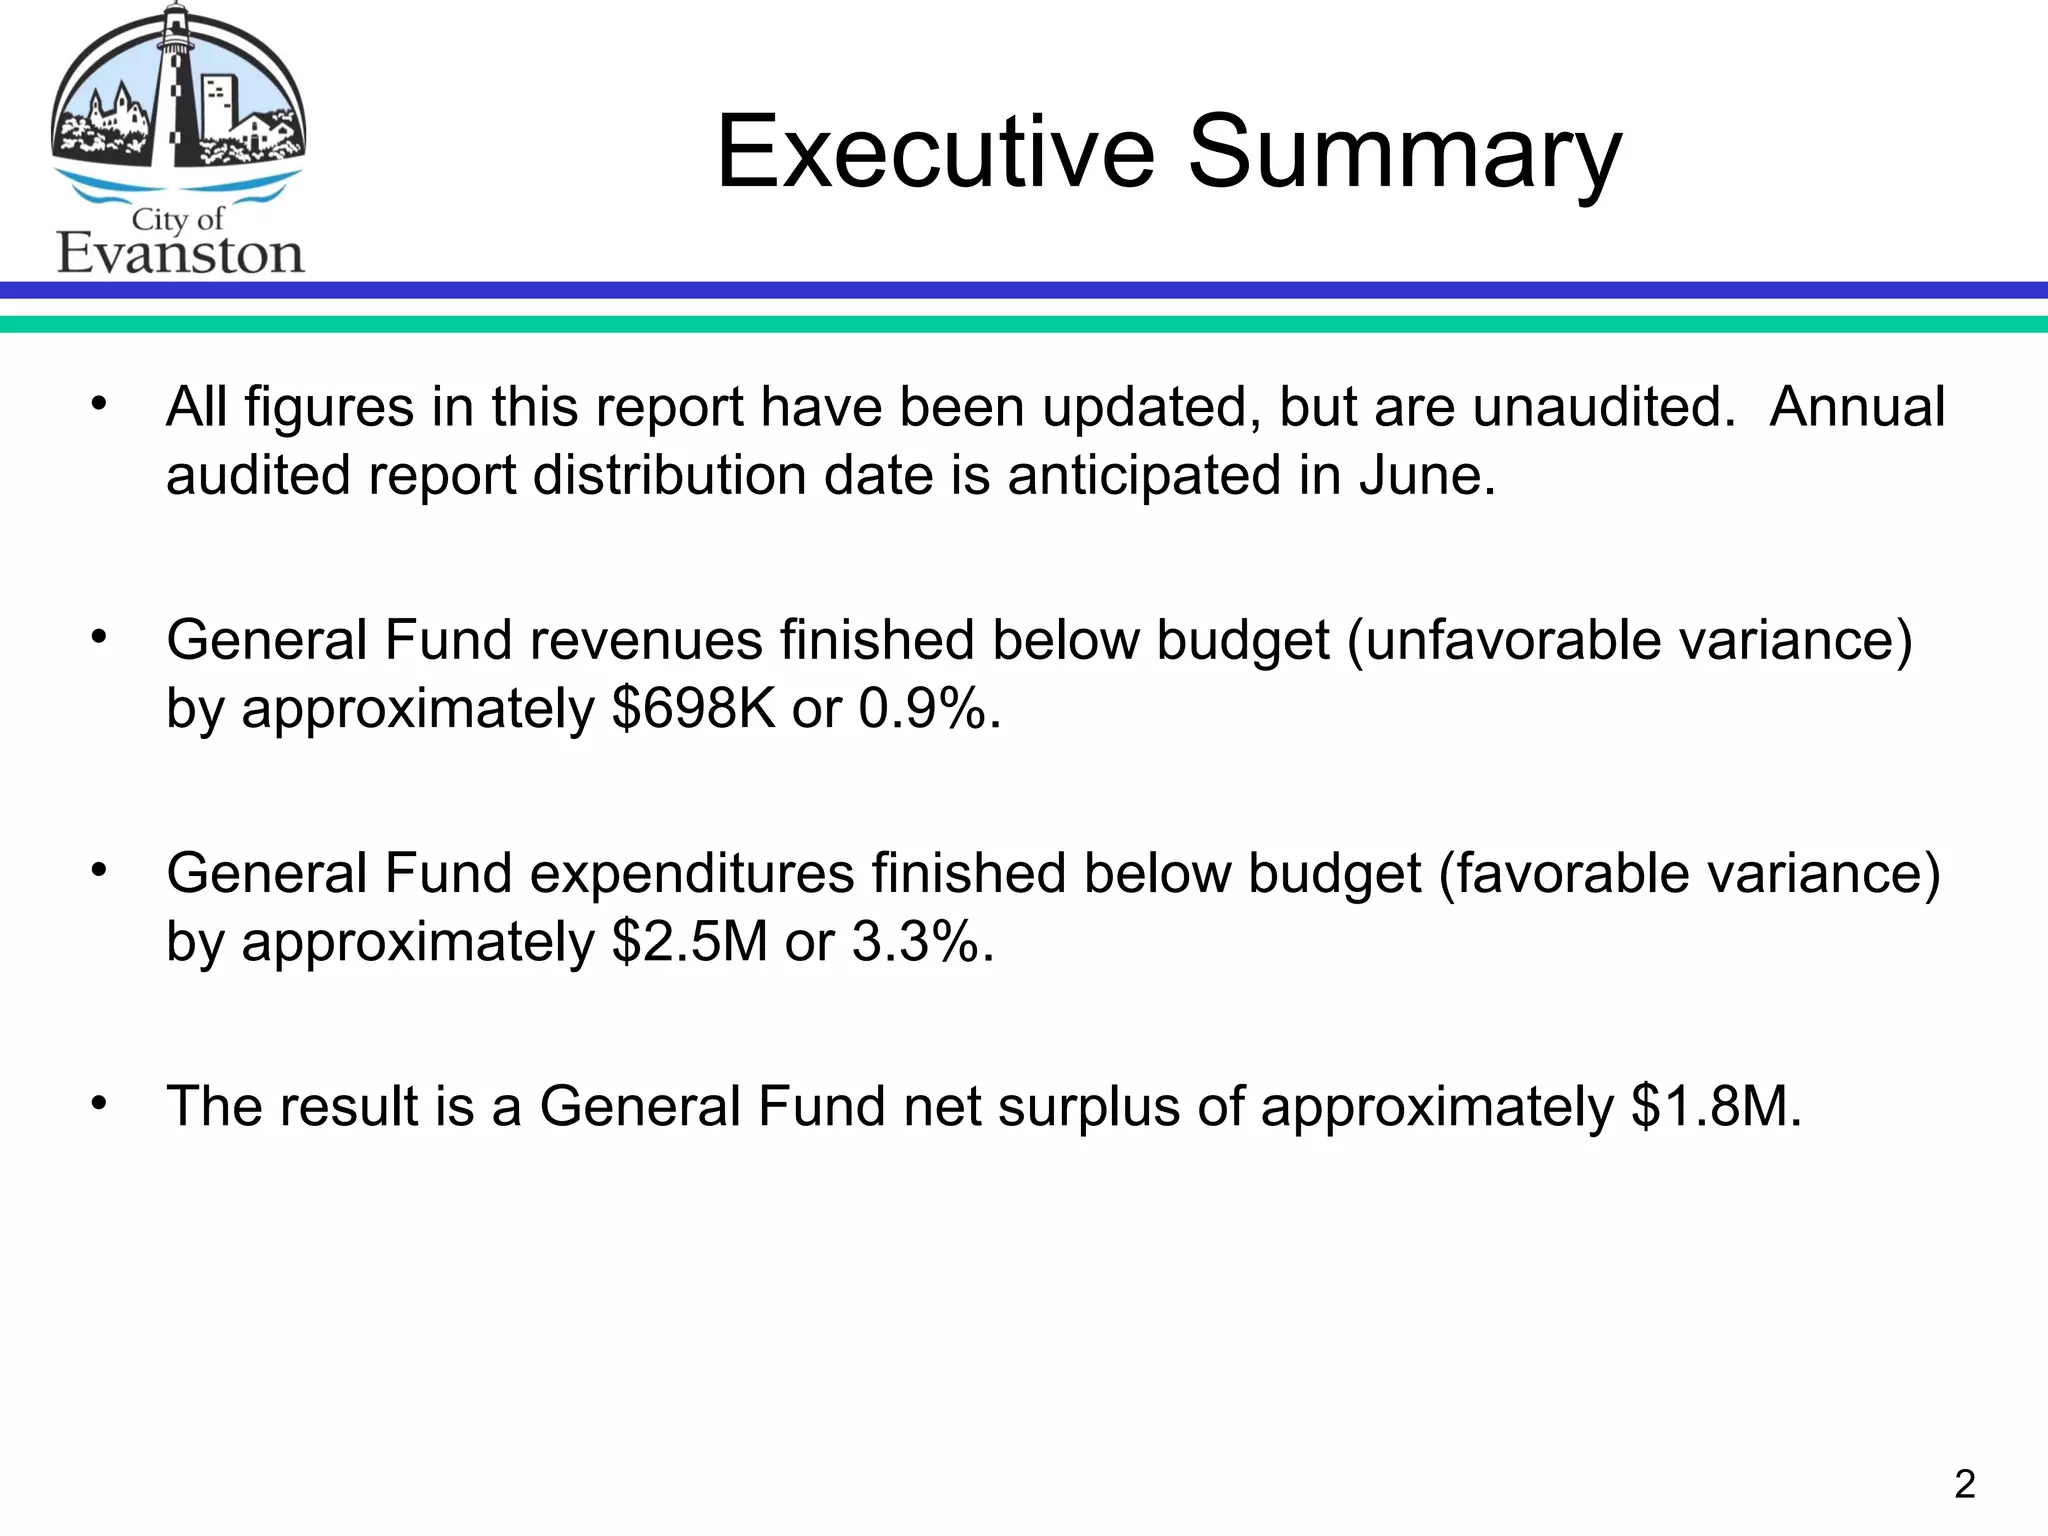
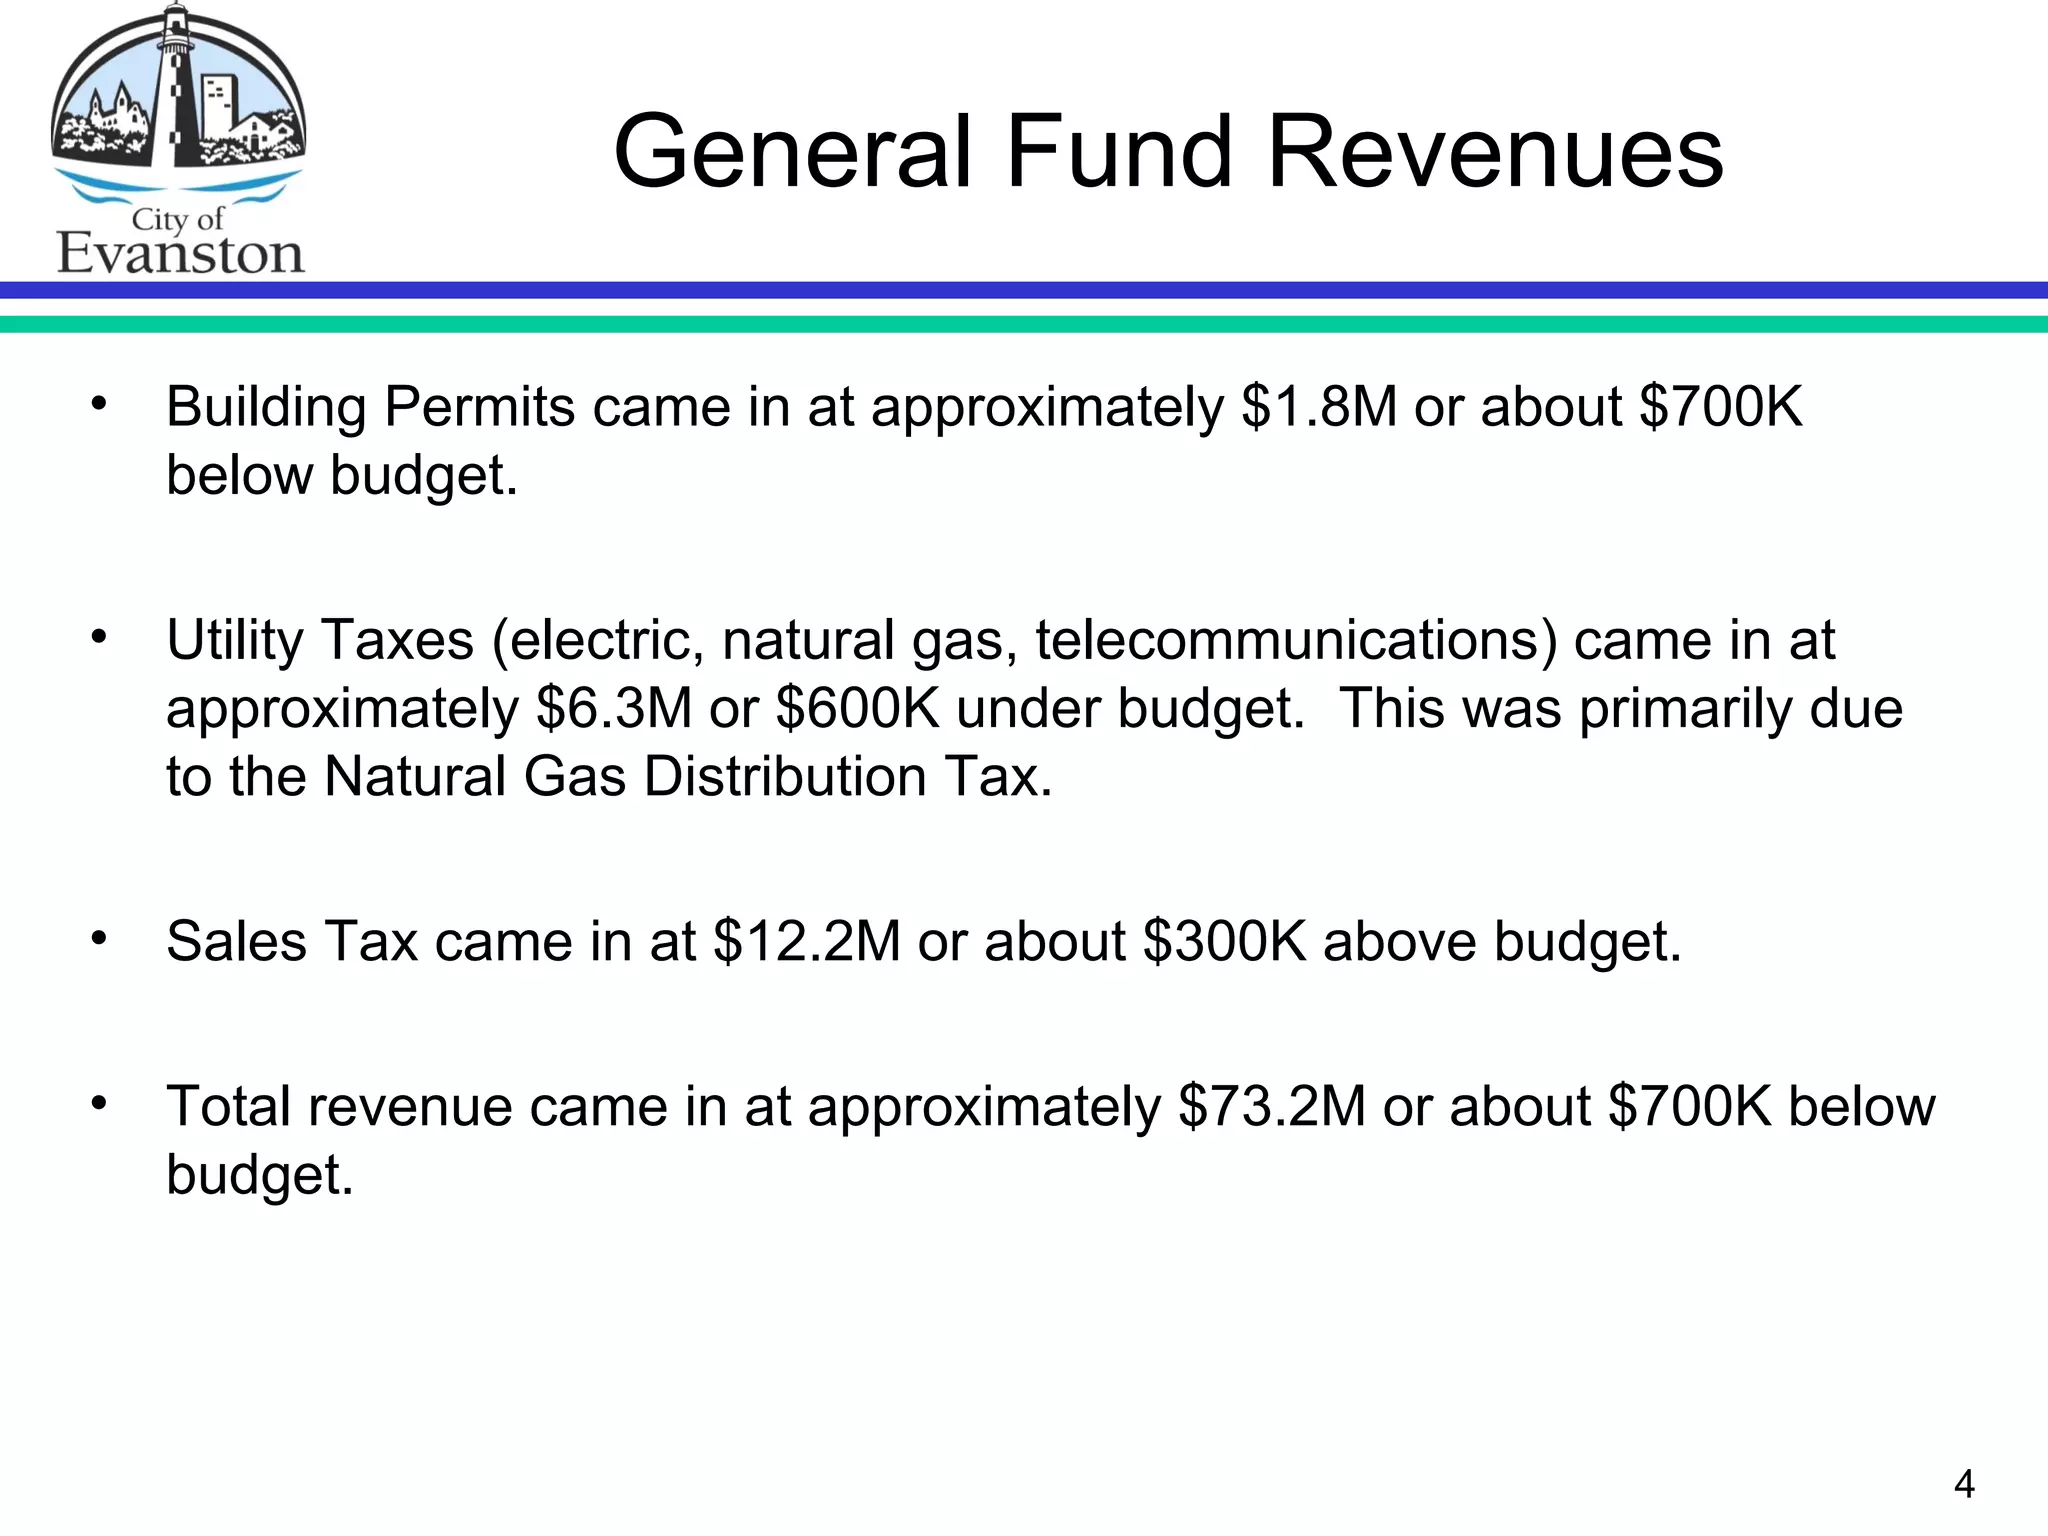
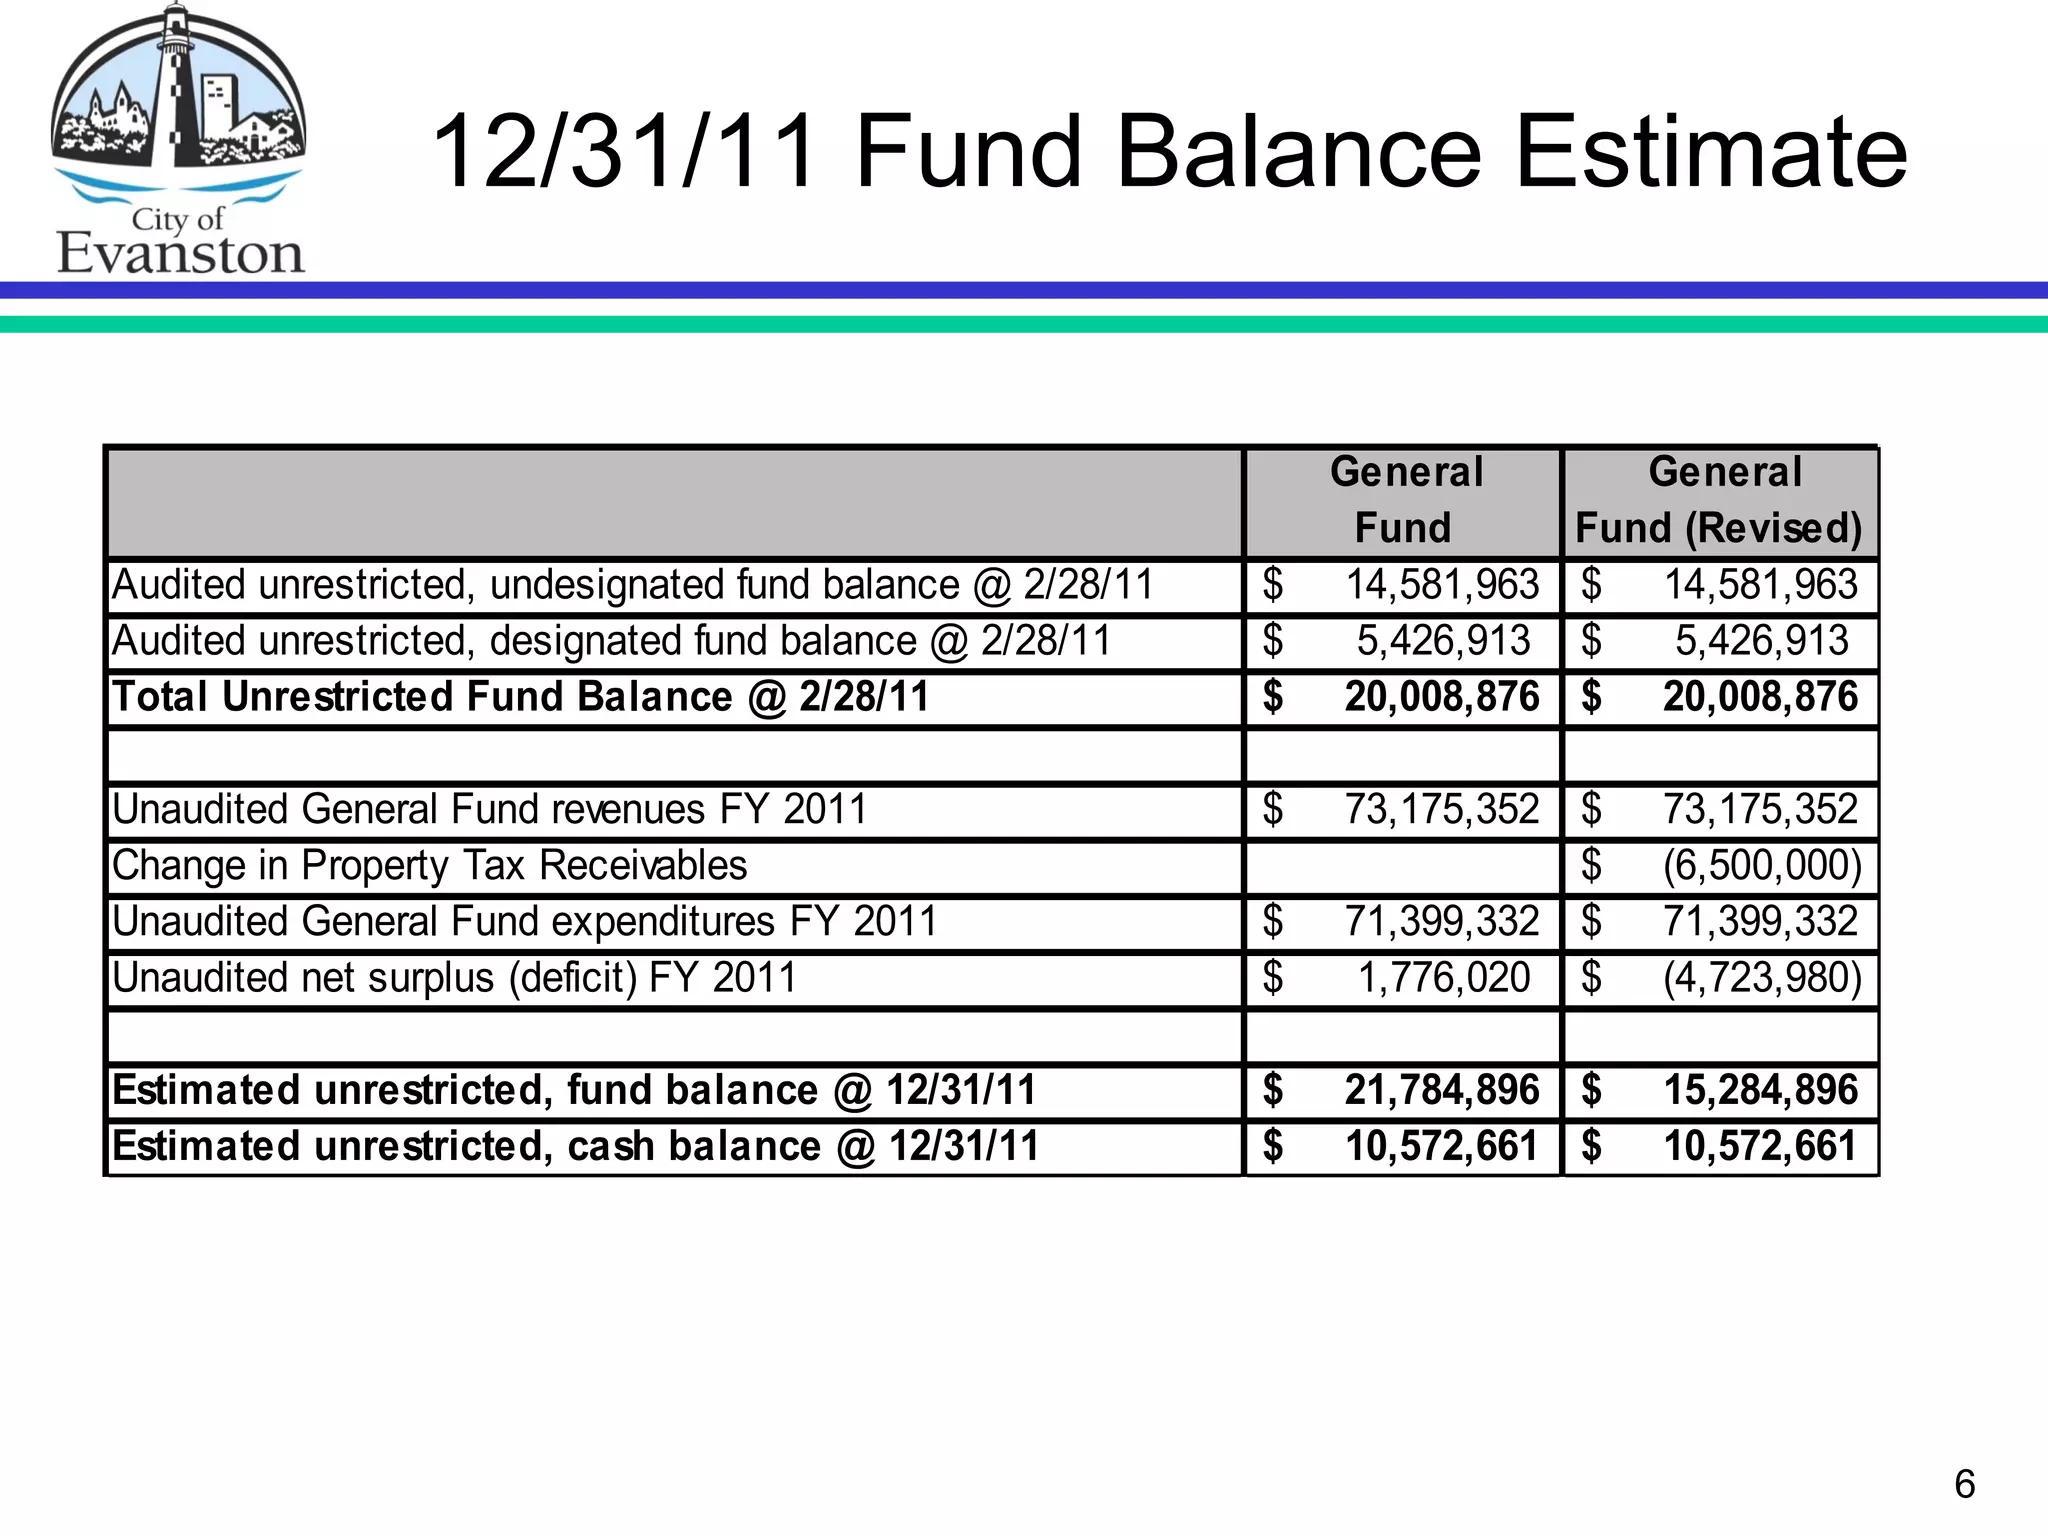
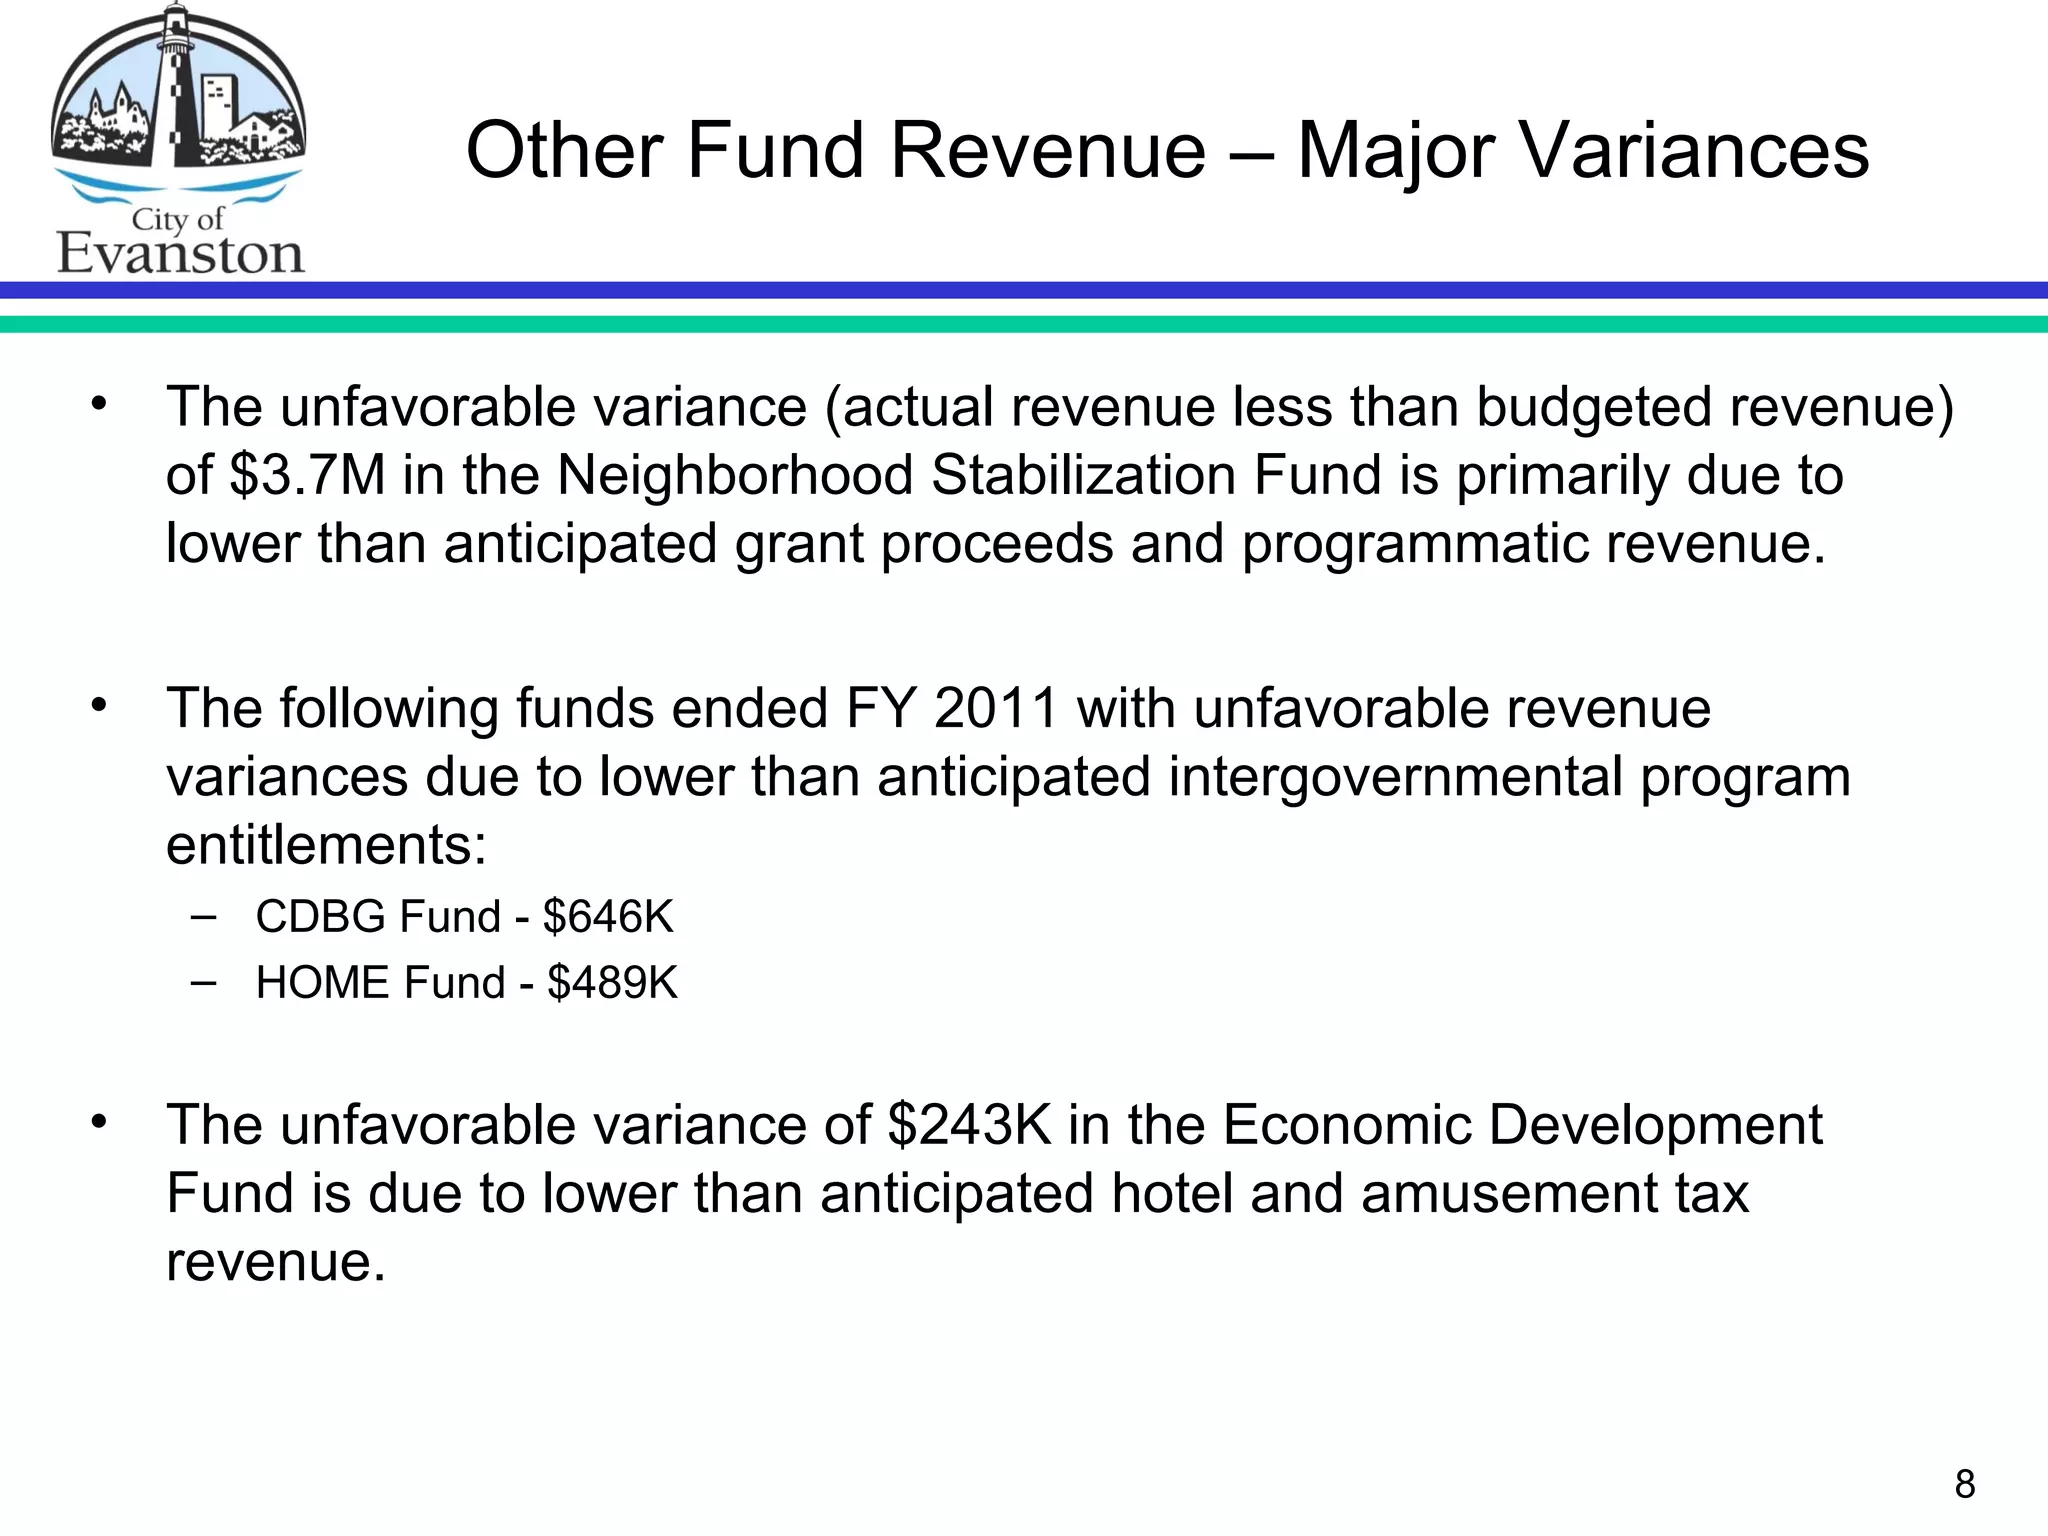
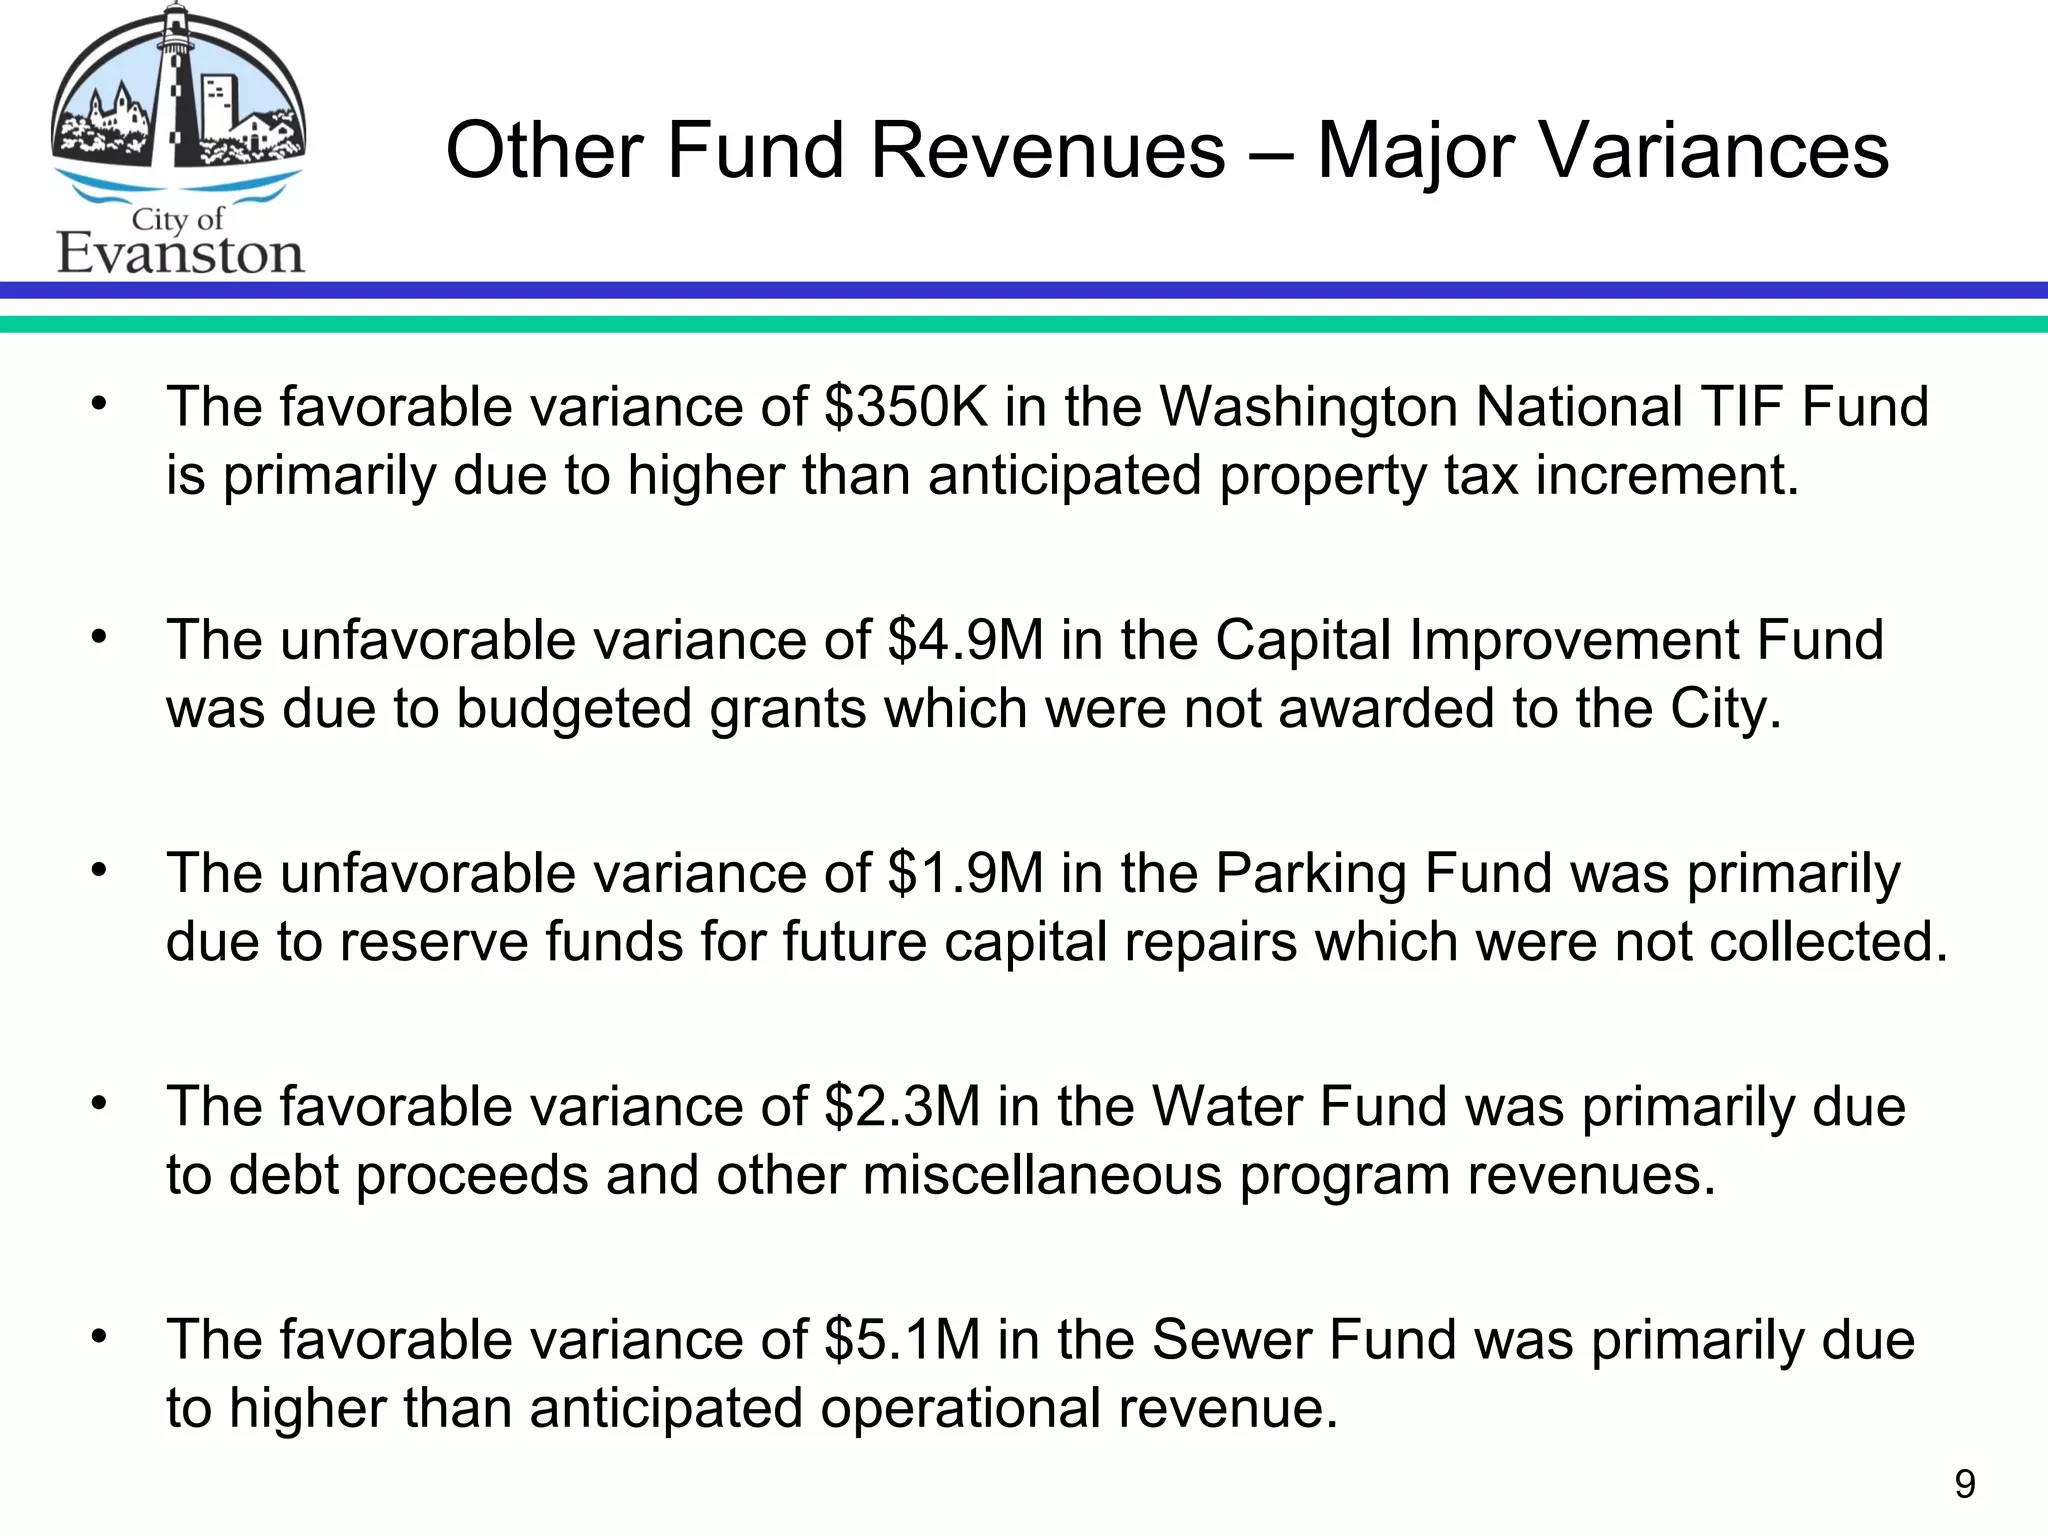
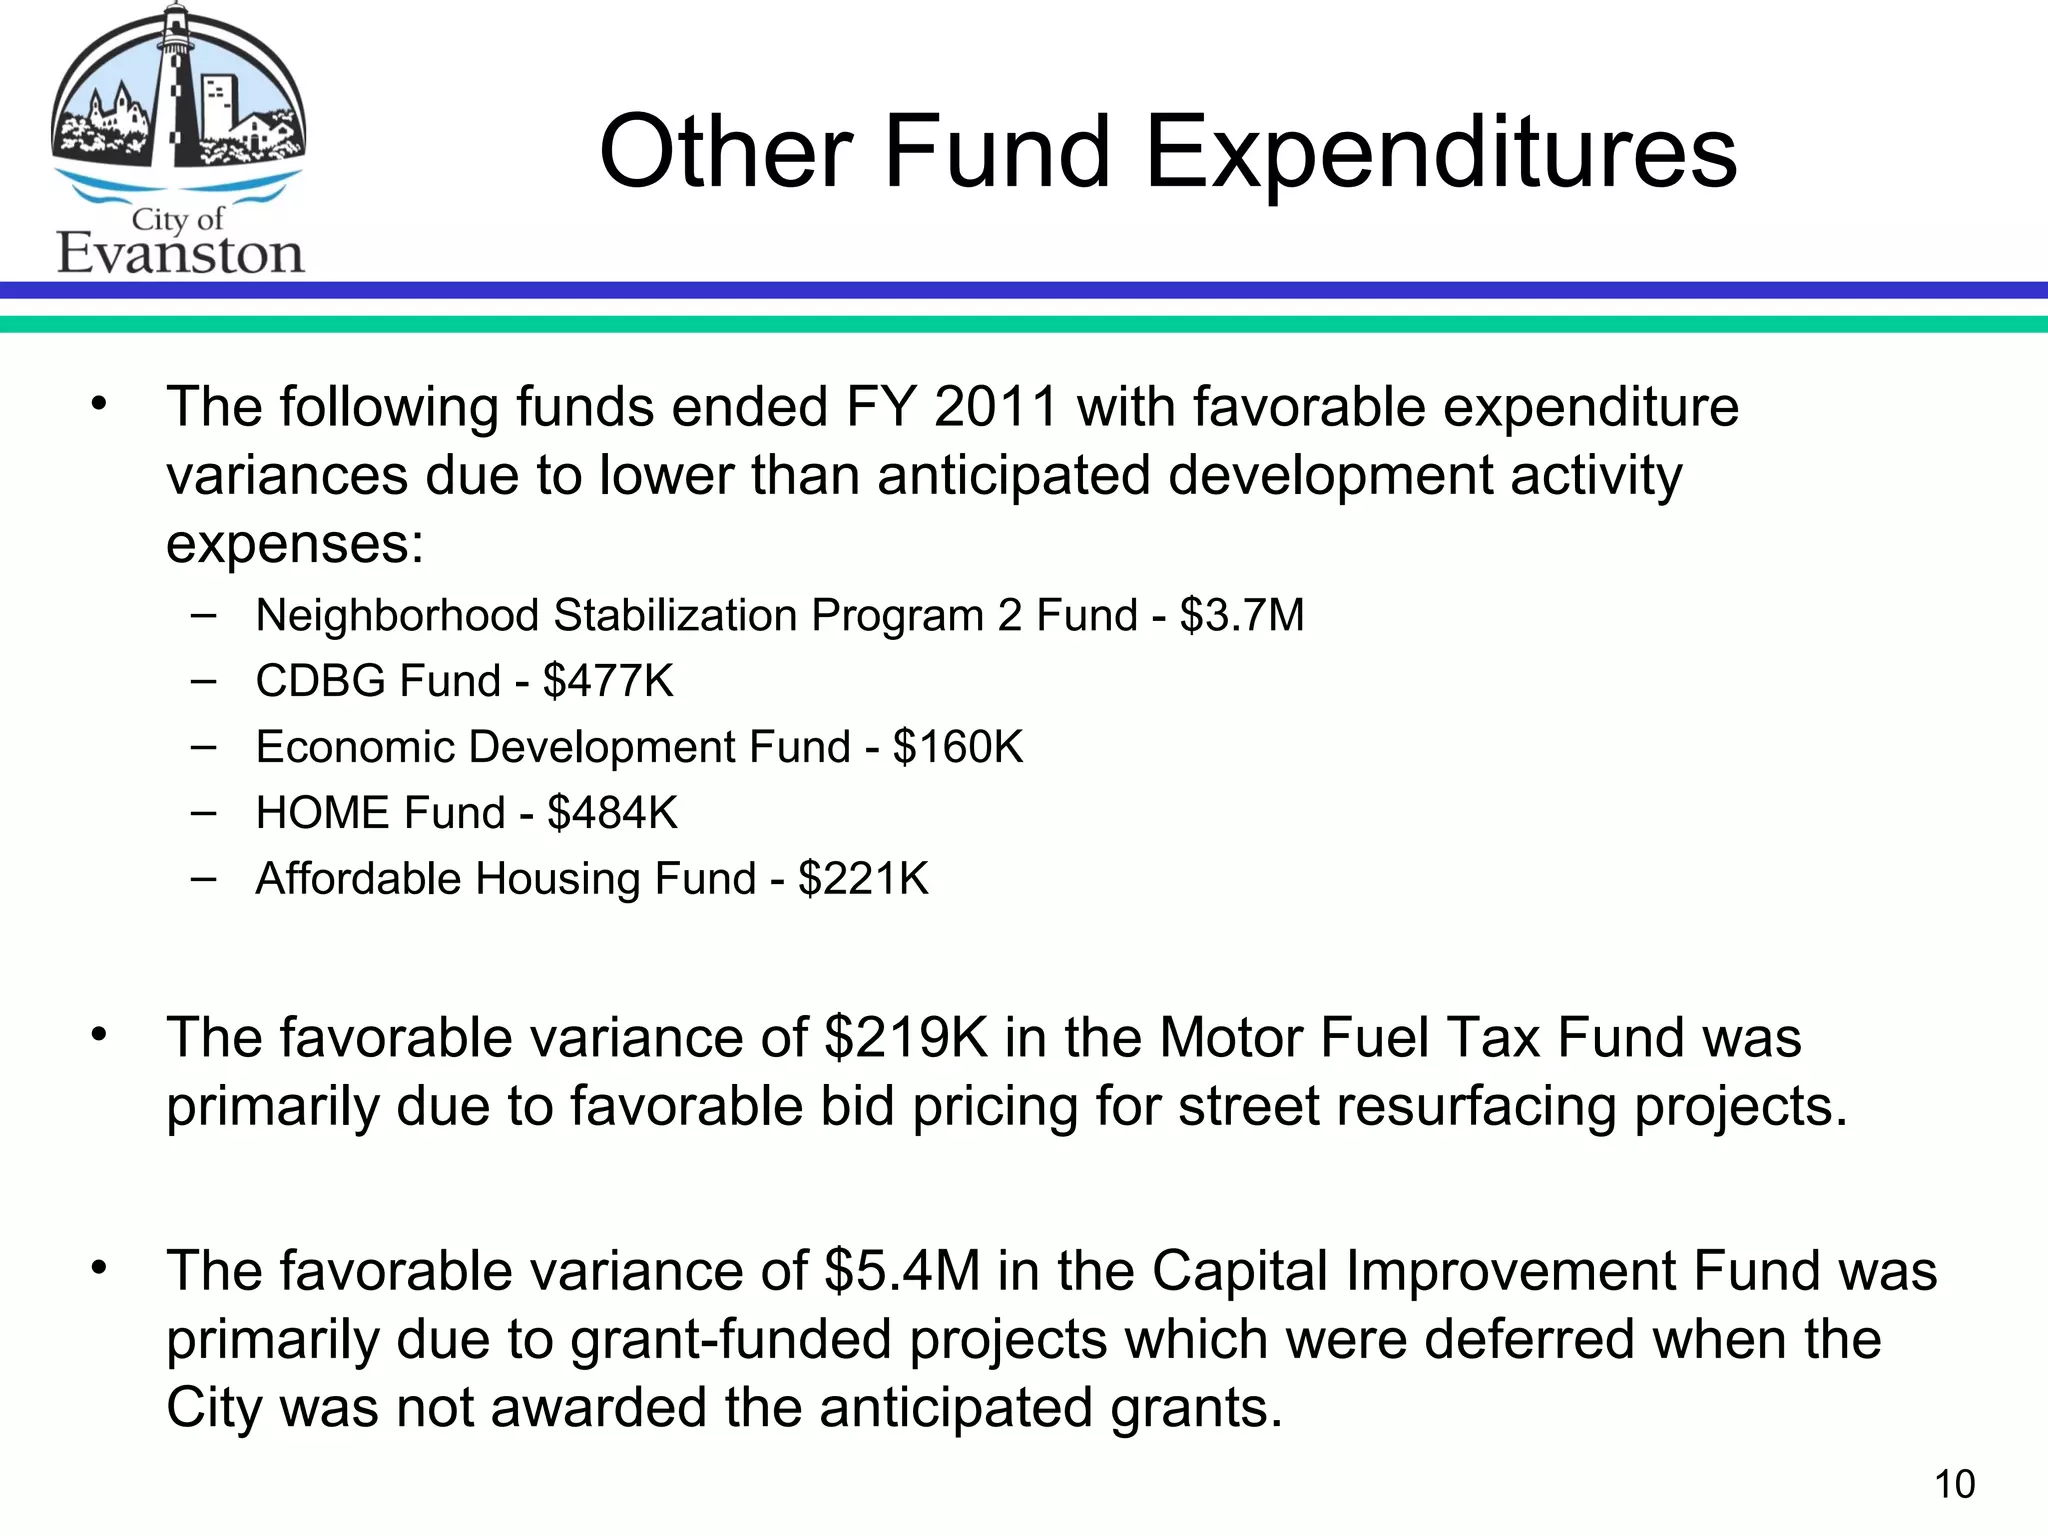
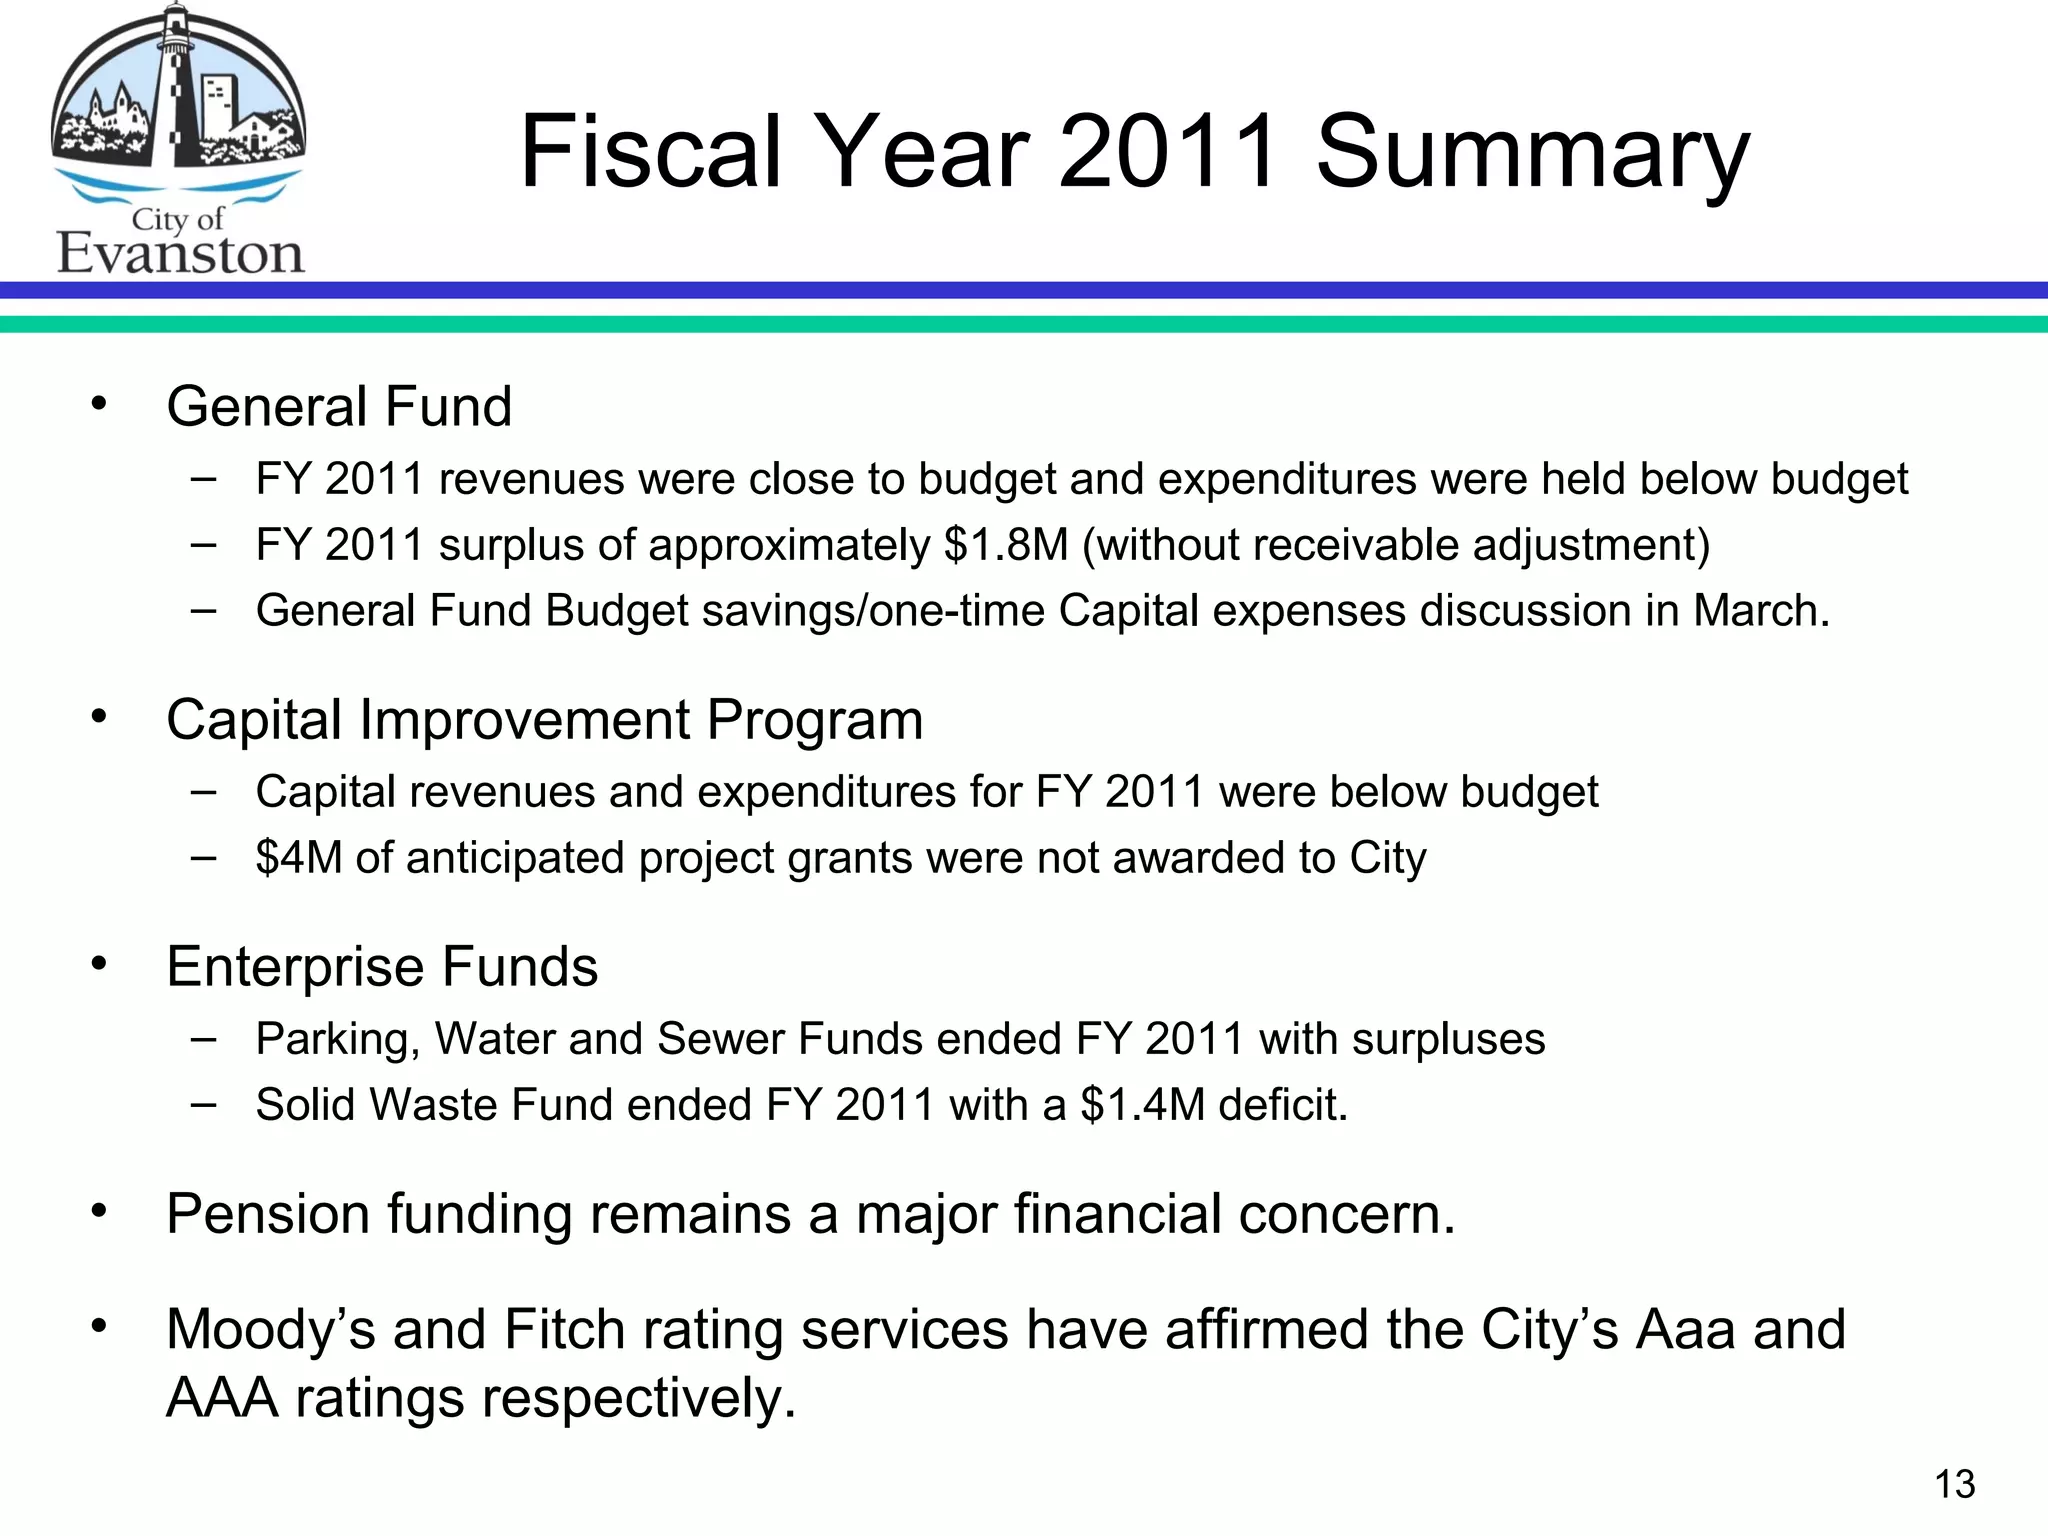
Fiscal Year 2011
Year-End Financial Review
February 28, 2012
Executive Summary
• All figures in this report have been updated, but are unaudited. Annual
audited report distribution date is anticipated in June.
• General Fund revenues finished below budget (unfavorable variance)
by approximately $698K or 0.9%.
• General Fund expenditures finished below budget (favorable variance)
by approximately $2.5M or 3.3%.
• The result is a General Fund net surplus of approximately $1.8M.
2
General Fund Revenues
• Property Taxes came in at approximately $16M compared to $16.5M
budgeted, or about $500K under budget.
• Approximately $750K of the $1.8M General Fund surplus was due to
revenue from the sale of land on Chicago Avenue, which is considered
one-time revenue.
• Real Estate Transfer Taxes came in at approximately $2M or about
$500K above budget.
• Income Taxes came in at approximately $4.9M or about $200K above
budget.
3
General Fund Revenues
• Building Permits came in at approximately $1.8M or about $700K
below budget.
• Utility Taxes (electric, natural gas, telecommunications) came in at
approximately $6.3M or $600K under budget. This was primarily due
to the Natural Gas Distribution Tax.
• Sales Tax came in at $12.2M or about $300K above budget.
• Total revenue came in at approximately $73.2M or about $700K below
budget.
4
General Fund Expenditures
5
• Total expenditures
came in at
approximately $71.4M
or 3.3% below budget.
• Police expenditures
exceeded budget by
0.7% primarily due to
higher than anticipated
payouts and overtime.
• The $1.8M General
Fund surplus for FY
2011 increased fund
balance from $14.6M to
$16.4M.
Expenditures Budget Actual
% of
Budget
Legislative 523,131$ 514,586$ 98.4%
City Administration 1,675,952 1,329,524 79.3%
Law Department 828,120 816,863 98.6%
Administrative Services 8,206,488 7,030,956 85.7%
Community and Economic Dev. 2,824,205 2,677,868 94.8%
Police Department 20,263,642 20,400,229 100.7%
Fire & Life Safety Services 11,192,783 11,005,350 98.3%
Health Department 2,135,313 1,989,997 93.2%
Public Works 6,862,268 6,576,242 95.8%
Public Library 3,708,359 3,650,508 98.4%
Parks, Rec. & Comm. Serv. 15,653,221 15,407,209 98.4%
Total Expenditures 73,873,482$ 71,399,332$ 96.7%
12/31/11 Fund Balance Estimate
6
General
Fund
General
Fund (Revised)
Audited unrestricted, undesignated fund balance @ 2/28/11 $ 14,581,963 $ 14,581,963
Audited unrestricted, designated fund balance @ 2/28/11 $ 5,426,913 $ 5,426,913
Total Unrestricted Fund Balance @ 2/28/11 $ 20,008,876 $ 20,008,876
Unaudited General Fund revenues FY 2011 $ 73,175,352 $ 73,175,352
Change in Property Tax Receivables $ (6,500,000)
Unaudited General Fund expenditures FY 2011 $ 71,399,332 $ 71,399,332
Unaudited net surplus (deficit) FY 2011 $ 1,776,020 $ (4,723,980)
Estimated unrestricted, fund balance @ 12/31/11 $ 21,784,896 $ 15,284,896
Estimated unrestricted, cash balance @ 12/31/11 $ 10,572,661 $ 10,572,661
Other Funds
7
Other Fund Revenue – Major Variances
• The unfavorable variance (actual revenue less than budgeted revenue)
of $3.7M in the Neighborhood Stabilization Fund is primarily due to
lower than anticipated grant proceeds and programmatic revenue.
• The following funds ended FY 2011 with unfavorable revenue
variances due to lower than anticipated intergovernmental program
entitlements:
– CDBG Fund - $646K
– HOME Fund - $489K
• The unfavorable variance of $243K in the Economic Development
Fund is due to lower than anticipated hotel and amusement tax
revenue.
8
Other Fund Revenues – Major Variances
• The favorable variance of $350K in the Washington National TIF Fund
is primarily due to higher than anticipated property tax increment.
• The unfavorable variance of $4.9M in the Capital Improvement Fund
was due to budgeted grants which were not awarded to the City.
• The unfavorable variance of $1.9M in the Parking Fund was primarily
due to reserve funds for future capital repairs which were not collected.
• The favorable variance of $2.3M in the Water Fund was primarily due
to debt proceeds and other miscellaneous program revenues.
• The favorable variance of $5.1M in the Sewer Fund was primarily due
to higher than anticipated operational revenue.
9
Other Fund Expenditures
• The following funds ended FY 2011 with favorable expenditure
variances due to lower than anticipated development activity
expenses:
– Neighborhood Stabilization Program 2 Fund - $3.7M
– CDBG Fund - $477K
– Economic Development Fund - $160K
– HOME Fund - $484K
– Affordable Housing Fund - $221K
• The favorable variance of $219K in the Motor Fuel Tax Fund was
primarily due to favorable bid pricing for street resurfacing projects.
• The favorable variance of $5.4M in the Capital Improvement Fund was
primarily due to grant-funded projects which were deferred when the
City was not awarded the anticipated grants.
10
Other Fund Expenditures
• The following funds ended FY 2011 with favorable variances primarily
due to lower than anticipated capital project expenditures:
– Emergency 911 Fund - $197K
– Washington National TIF Fund - $796K
– West Evanston TIF Fund - $426K
– Special Assessment Fund - $867K
– Fleet Fund - $1.2M
• The favorable variance of $732K in the Insurance Fund was primarily
due to the reduced premium costs for the City.
11
12
Other Fund Expenditures
• The following enterprise funds ended FY 2011 with favorable variances
due to lower than anticipated capital and operating expenditures:
– Parking Fund - $5.8M
– Water Fund - $3.6M
– Sewer Fund - $764K
• The unfavorable variance of $245K in the Solid Waste Fund was
primarily due to higher than anticipated expenditures associated with
the City’s refuse, recycling and yard waste program.
Fiscal Year 2011 Summary
• General Fund
– FY 2011 revenues were close to budget and expenditures were held below budget
– FY 2011 surplus of approximately $1.8M (without receivable adjustment)
– General Fund Budget savings/one-time Capital expenses discussion in March.
• Capital Improvement Program
– Capital revenues and expenditures for FY 2011 were below budget
– $4M of anticipated project grants were not awarded to City
• Enterprise Funds
– Parking, Water and Sewer Funds ended FY 2011 with surpluses
– Solid Waste Fund ended FY 2011 with a $1.4M deficit.
• Pension funding remains a major financial concern.
• Moody’s and Fitch rating services have affirmed the City’s Aaa and
AAA ratings respectively.
13
Questions?

Fy11 year end financial report - presentation - draft 2 02-22-12

  • 1.
    Fiscal Year 2011 Year-EndFinancial Review February 28, 2012
  • 2.
    Executive Summary • Allfigures in this report have been updated, but are unaudited. Annual audited report distribution date is anticipated in June. • General Fund revenues finished below budget (unfavorable variance) by approximately $698K or 0.9%. • General Fund expenditures finished below budget (favorable variance) by approximately $2.5M or 3.3%. • The result is a General Fund net surplus of approximately $1.8M. 2
  • 3.
    General Fund Revenues •Property Taxes came in at approximately $16M compared to $16.5M budgeted, or about $500K under budget. • Approximately $750K of the $1.8M General Fund surplus was due to revenue from the sale of land on Chicago Avenue, which is considered one-time revenue. • Real Estate Transfer Taxes came in at approximately $2M or about $500K above budget. • Income Taxes came in at approximately $4.9M or about $200K above budget. 3
  • 4.
    General Fund Revenues •Building Permits came in at approximately $1.8M or about $700K below budget. • Utility Taxes (electric, natural gas, telecommunications) came in at approximately $6.3M or $600K under budget. This was primarily due to the Natural Gas Distribution Tax. • Sales Tax came in at $12.2M or about $300K above budget. • Total revenue came in at approximately $73.2M or about $700K below budget. 4
  • 5.
    General Fund Expenditures 5 •Total expenditures came in at approximately $71.4M or 3.3% below budget. • Police expenditures exceeded budget by 0.7% primarily due to higher than anticipated payouts and overtime. • The $1.8M General Fund surplus for FY 2011 increased fund balance from $14.6M to $16.4M. Expenditures Budget Actual % of Budget Legislative 523,131$ 514,586$ 98.4% City Administration 1,675,952 1,329,524 79.3% Law Department 828,120 816,863 98.6% Administrative Services 8,206,488 7,030,956 85.7% Community and Economic Dev. 2,824,205 2,677,868 94.8% Police Department 20,263,642 20,400,229 100.7% Fire & Life Safety Services 11,192,783 11,005,350 98.3% Health Department 2,135,313 1,989,997 93.2% Public Works 6,862,268 6,576,242 95.8% Public Library 3,708,359 3,650,508 98.4% Parks, Rec. & Comm. Serv. 15,653,221 15,407,209 98.4% Total Expenditures 73,873,482$ 71,399,332$ 96.7%
  • 6.
    12/31/11 Fund BalanceEstimate 6 General Fund General Fund (Revised) Audited unrestricted, undesignated fund balance @ 2/28/11 $ 14,581,963 $ 14,581,963 Audited unrestricted, designated fund balance @ 2/28/11 $ 5,426,913 $ 5,426,913 Total Unrestricted Fund Balance @ 2/28/11 $ 20,008,876 $ 20,008,876 Unaudited General Fund revenues FY 2011 $ 73,175,352 $ 73,175,352 Change in Property Tax Receivables $ (6,500,000) Unaudited General Fund expenditures FY 2011 $ 71,399,332 $ 71,399,332 Unaudited net surplus (deficit) FY 2011 $ 1,776,020 $ (4,723,980) Estimated unrestricted, fund balance @ 12/31/11 $ 21,784,896 $ 15,284,896 Estimated unrestricted, cash balance @ 12/31/11 $ 10,572,661 $ 10,572,661
  • 7.
  • 8.
    Other Fund Revenue– Major Variances • The unfavorable variance (actual revenue less than budgeted revenue) of $3.7M in the Neighborhood Stabilization Fund is primarily due to lower than anticipated grant proceeds and programmatic revenue. • The following funds ended FY 2011 with unfavorable revenue variances due to lower than anticipated intergovernmental program entitlements: – CDBG Fund - $646K – HOME Fund - $489K • The unfavorable variance of $243K in the Economic Development Fund is due to lower than anticipated hotel and amusement tax revenue. 8
  • 9.
    Other Fund Revenues– Major Variances • The favorable variance of $350K in the Washington National TIF Fund is primarily due to higher than anticipated property tax increment. • The unfavorable variance of $4.9M in the Capital Improvement Fund was due to budgeted grants which were not awarded to the City. • The unfavorable variance of $1.9M in the Parking Fund was primarily due to reserve funds for future capital repairs which were not collected. • The favorable variance of $2.3M in the Water Fund was primarily due to debt proceeds and other miscellaneous program revenues. • The favorable variance of $5.1M in the Sewer Fund was primarily due to higher than anticipated operational revenue. 9
  • 10.
    Other Fund Expenditures •The following funds ended FY 2011 with favorable expenditure variances due to lower than anticipated development activity expenses: – Neighborhood Stabilization Program 2 Fund - $3.7M – CDBG Fund - $477K – Economic Development Fund - $160K – HOME Fund - $484K – Affordable Housing Fund - $221K • The favorable variance of $219K in the Motor Fuel Tax Fund was primarily due to favorable bid pricing for street resurfacing projects. • The favorable variance of $5.4M in the Capital Improvement Fund was primarily due to grant-funded projects which were deferred when the City was not awarded the anticipated grants. 10
  • 11.
    Other Fund Expenditures •The following funds ended FY 2011 with favorable variances primarily due to lower than anticipated capital project expenditures: – Emergency 911 Fund - $197K – Washington National TIF Fund - $796K – West Evanston TIF Fund - $426K – Special Assessment Fund - $867K – Fleet Fund - $1.2M • The favorable variance of $732K in the Insurance Fund was primarily due to the reduced premium costs for the City. 11
  • 12.
    12 Other Fund Expenditures •The following enterprise funds ended FY 2011 with favorable variances due to lower than anticipated capital and operating expenditures: – Parking Fund - $5.8M – Water Fund - $3.6M – Sewer Fund - $764K • The unfavorable variance of $245K in the Solid Waste Fund was primarily due to higher than anticipated expenditures associated with the City’s refuse, recycling and yard waste program.
  • 13.
    Fiscal Year 2011Summary • General Fund – FY 2011 revenues were close to budget and expenditures were held below budget – FY 2011 surplus of approximately $1.8M (without receivable adjustment) – General Fund Budget savings/one-time Capital expenses discussion in March. • Capital Improvement Program – Capital revenues and expenditures for FY 2011 were below budget – $4M of anticipated project grants were not awarded to City • Enterprise Funds – Parking, Water and Sewer Funds ended FY 2011 with surpluses – Solid Waste Fund ended FY 2011 with a $1.4M deficit. • Pension funding remains a major financial concern. • Moody’s and Fitch rating services have affirmed the City’s Aaa and AAA ratings respectively. 13
  • 14.