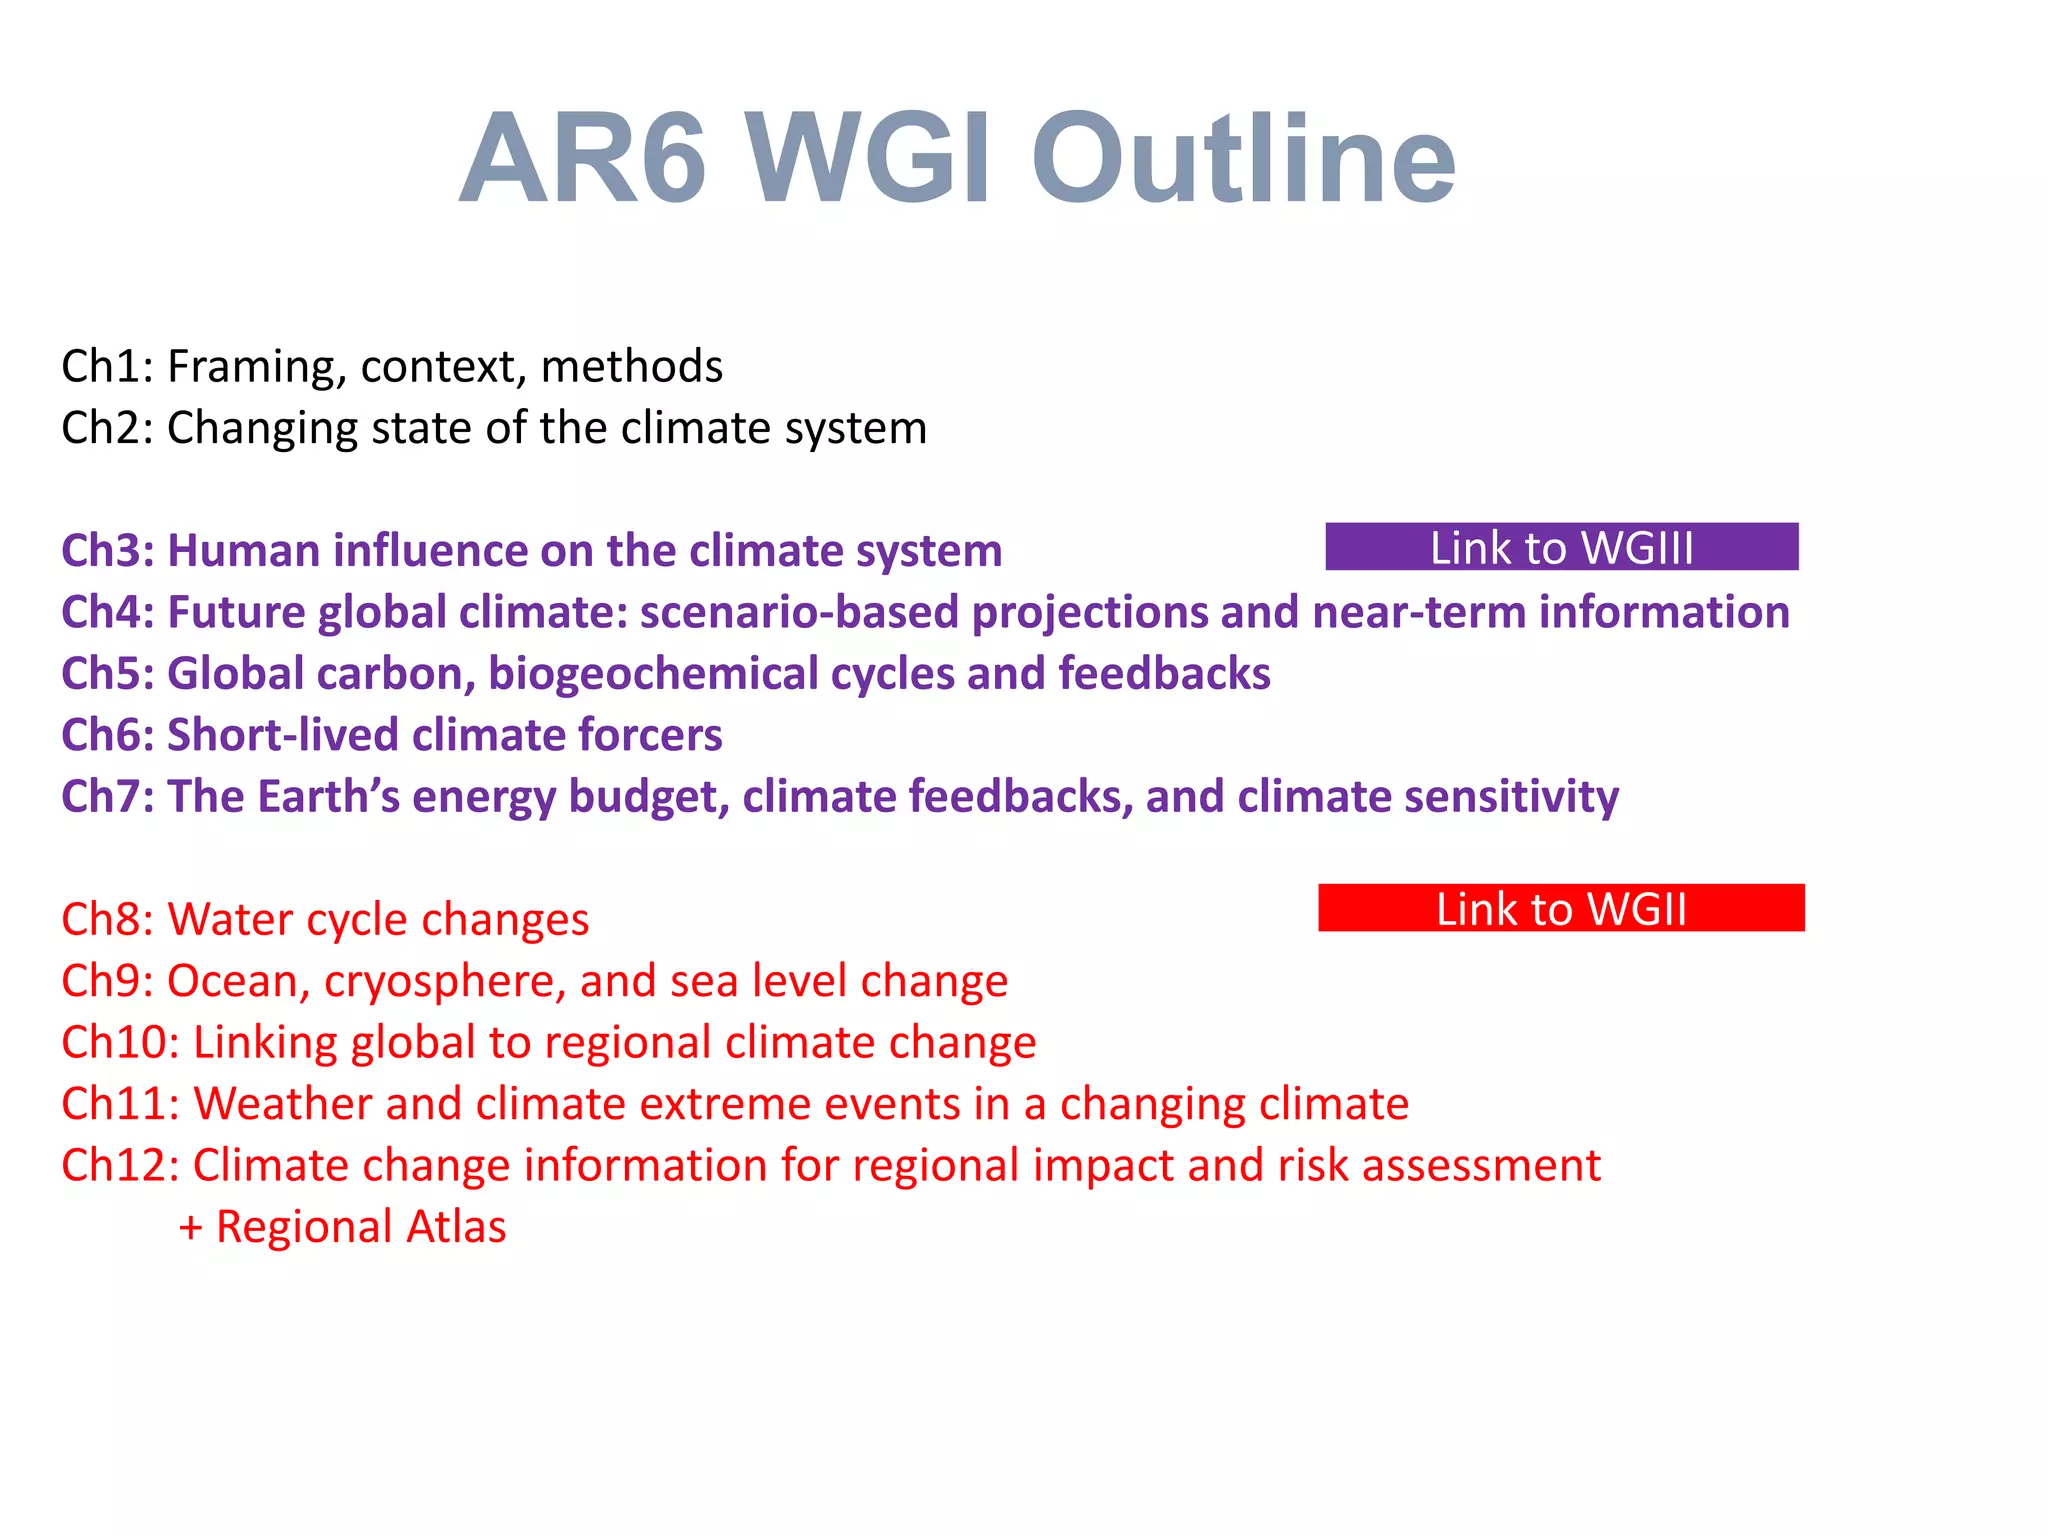
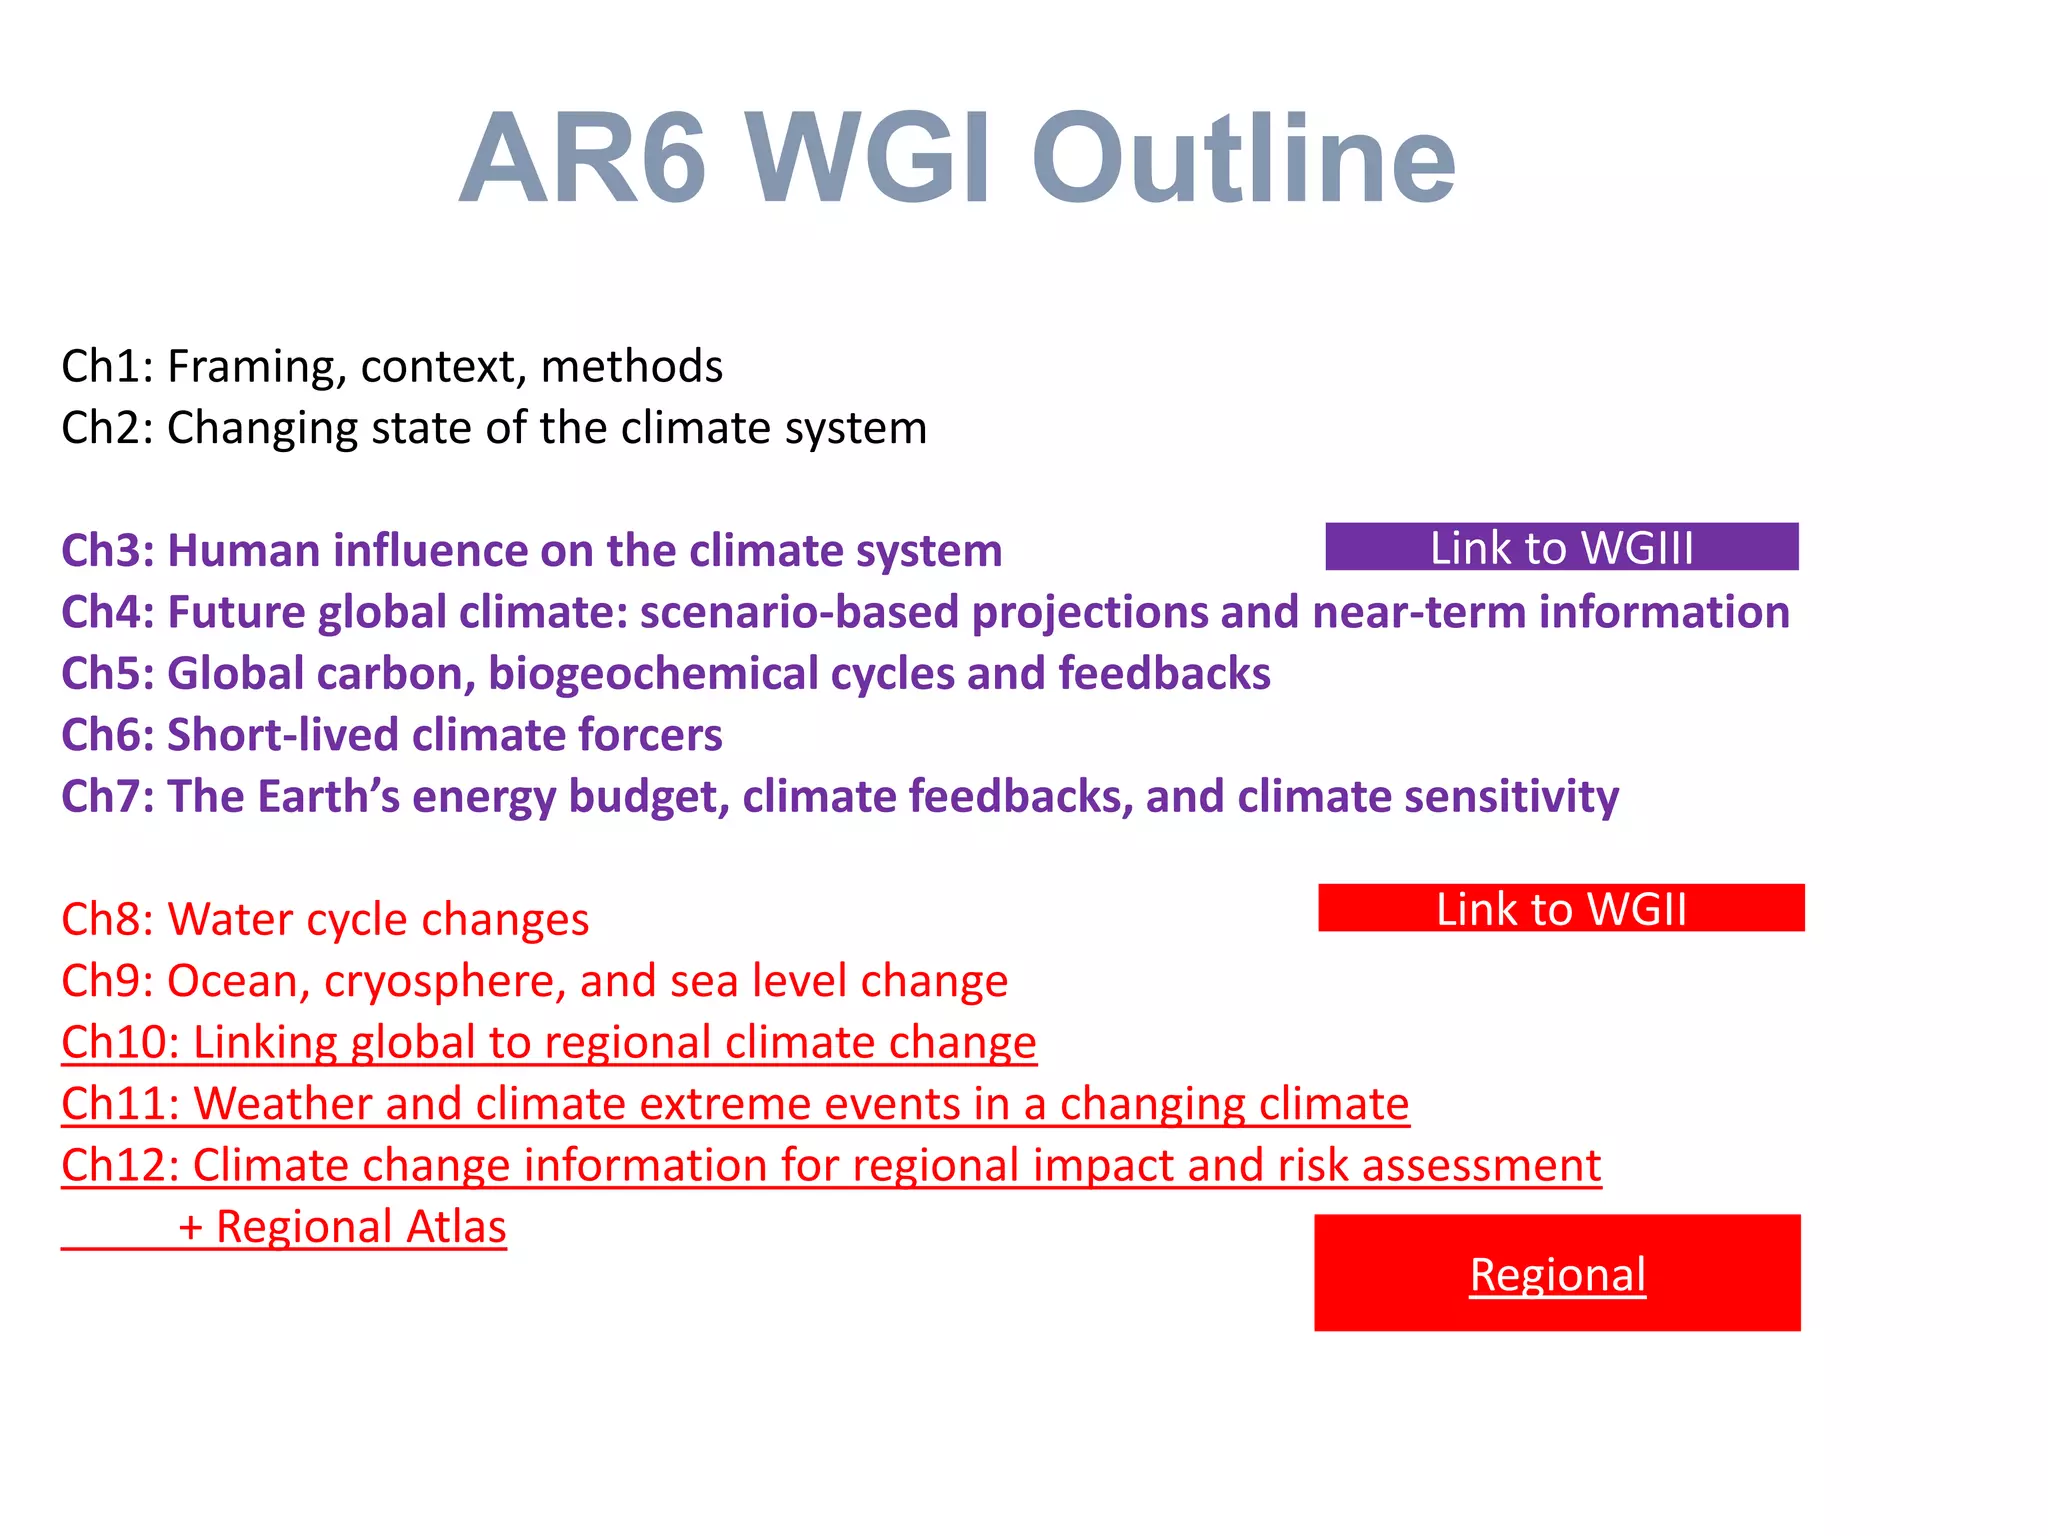
The document summarizes changes between the IPCC's 5th and 6th Assessment Reports. The AR6 will include more regional projections and linkages between climate change and other issues like air quality, water cycles, and short-lived climate pollutants. It will also improve attribution of extreme events and integrate cross-cutting issues. The AR6 outline was presented with 12 chapters addressing topics like future climate projections, carbon cycles, ocean and sea level change, regional impacts, and a new regional atlas. Strengthening links between working groups and a focus on regional information will help decision-makers assess climate risks.


![Fig.SPM.1b
Temperature Difference 1901 to 2012 based on trend (°C)
Warming of the climate system is unequivocal, [...]
Fig.SPM.2
Precipitation Trend (mm/yr per decade)
© IPCC 2013© IPCC 2013](https://image.slidesharecdn.com/1-190530150911/75/From-IPCC-WGI-AR5-to-AR6-5-2048.jpg)

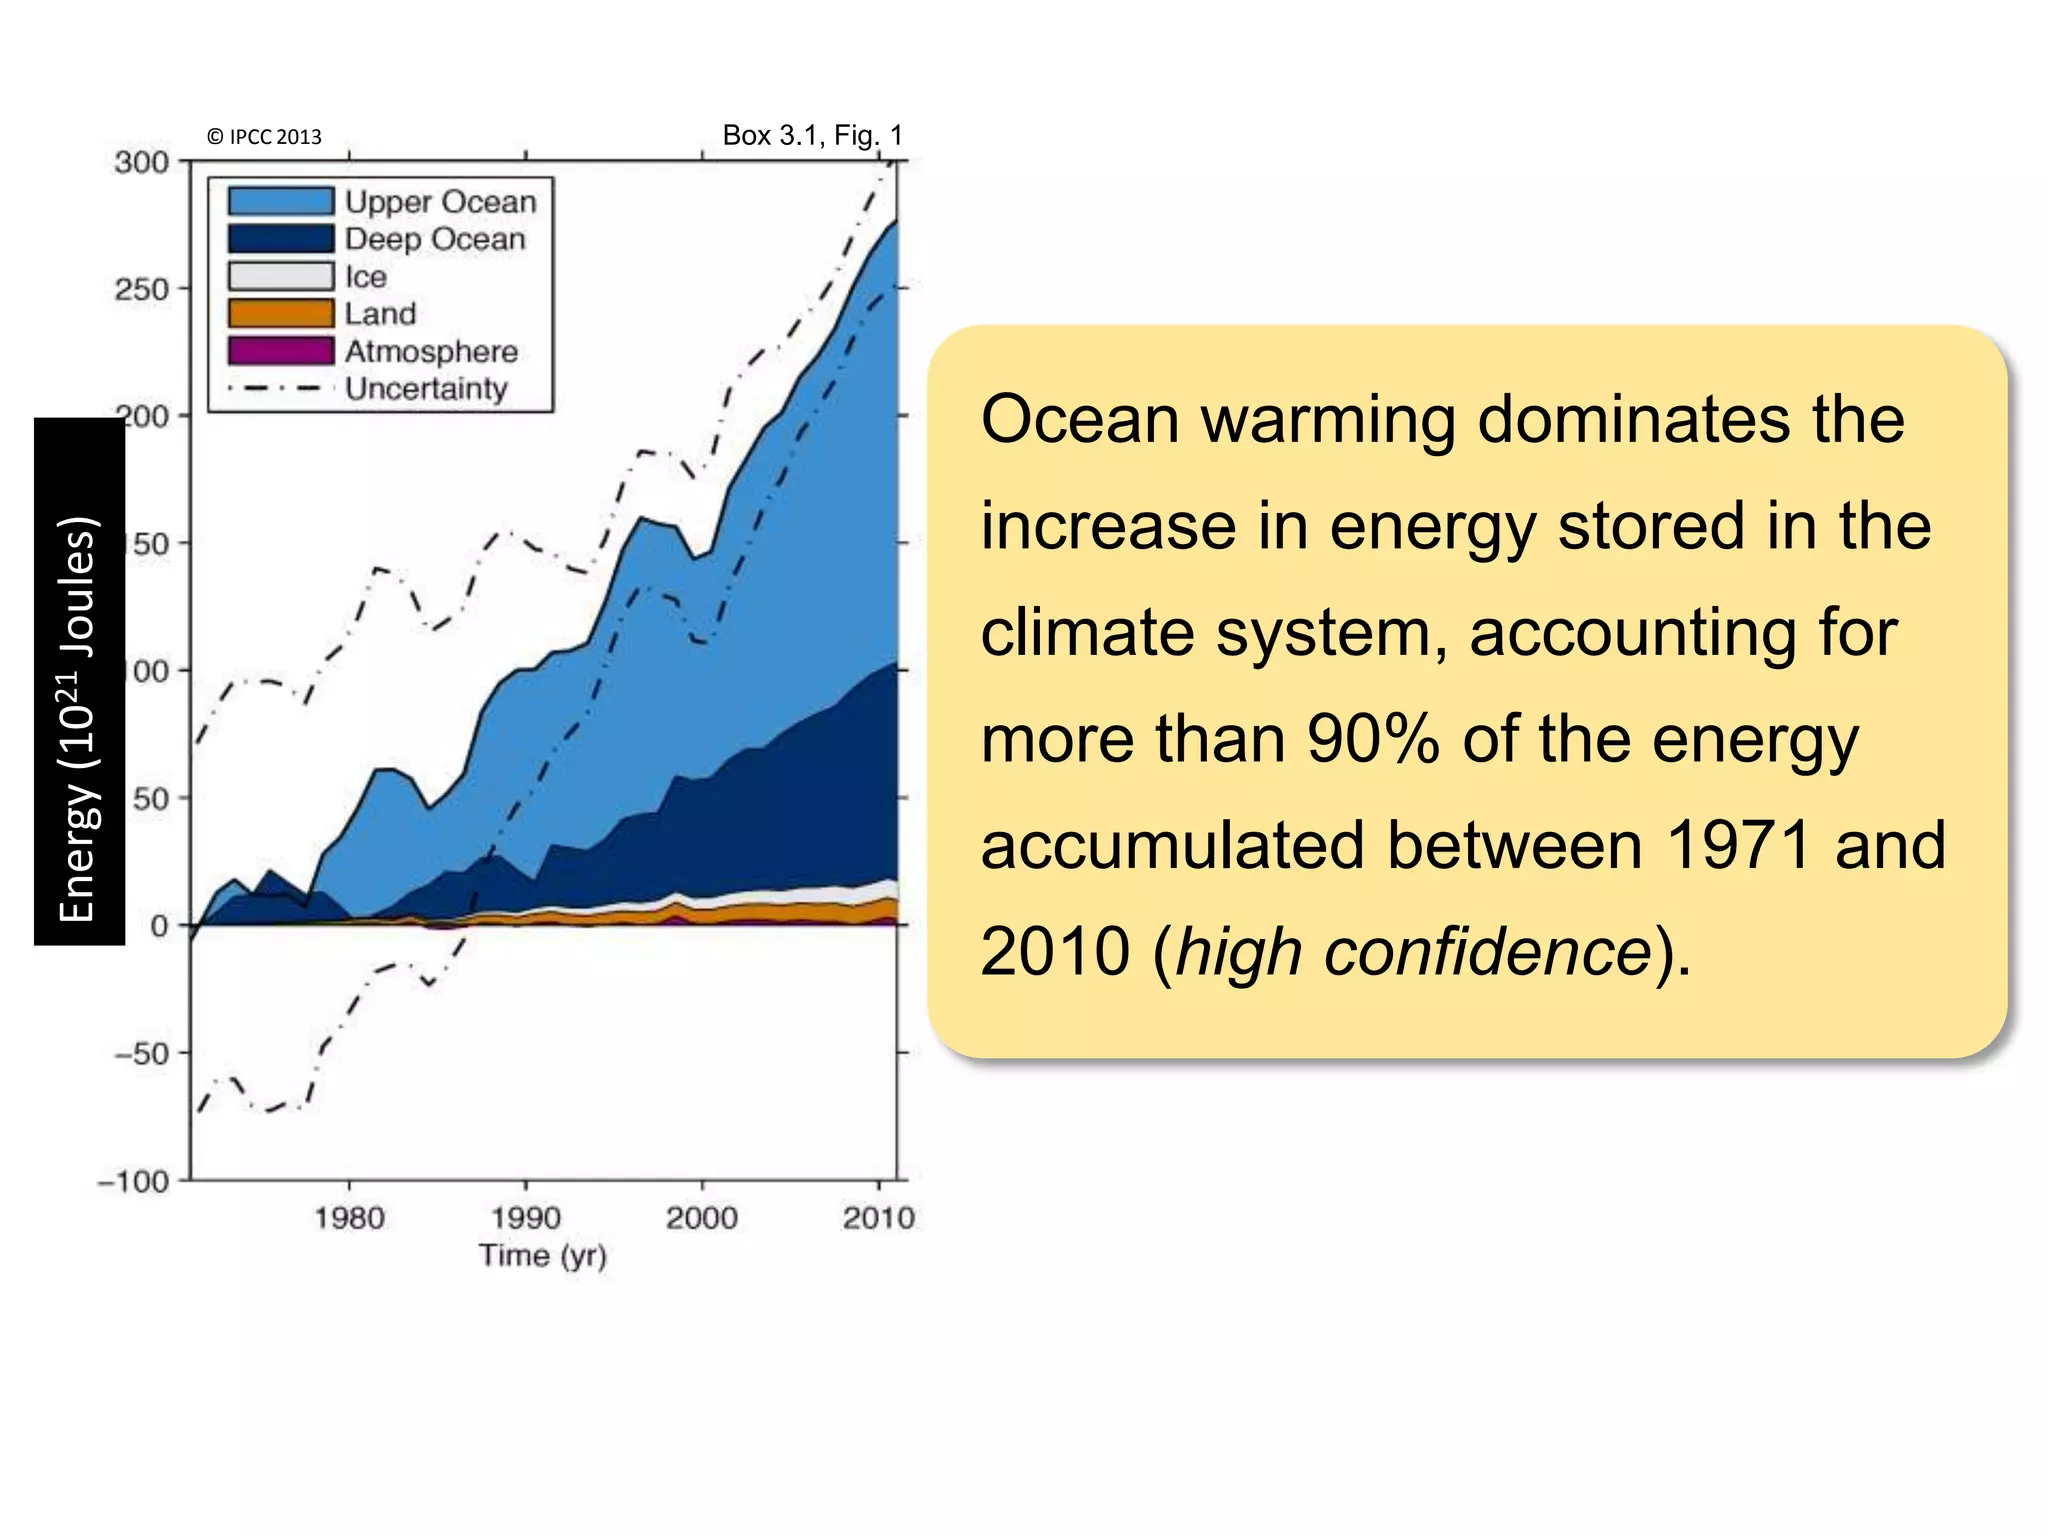
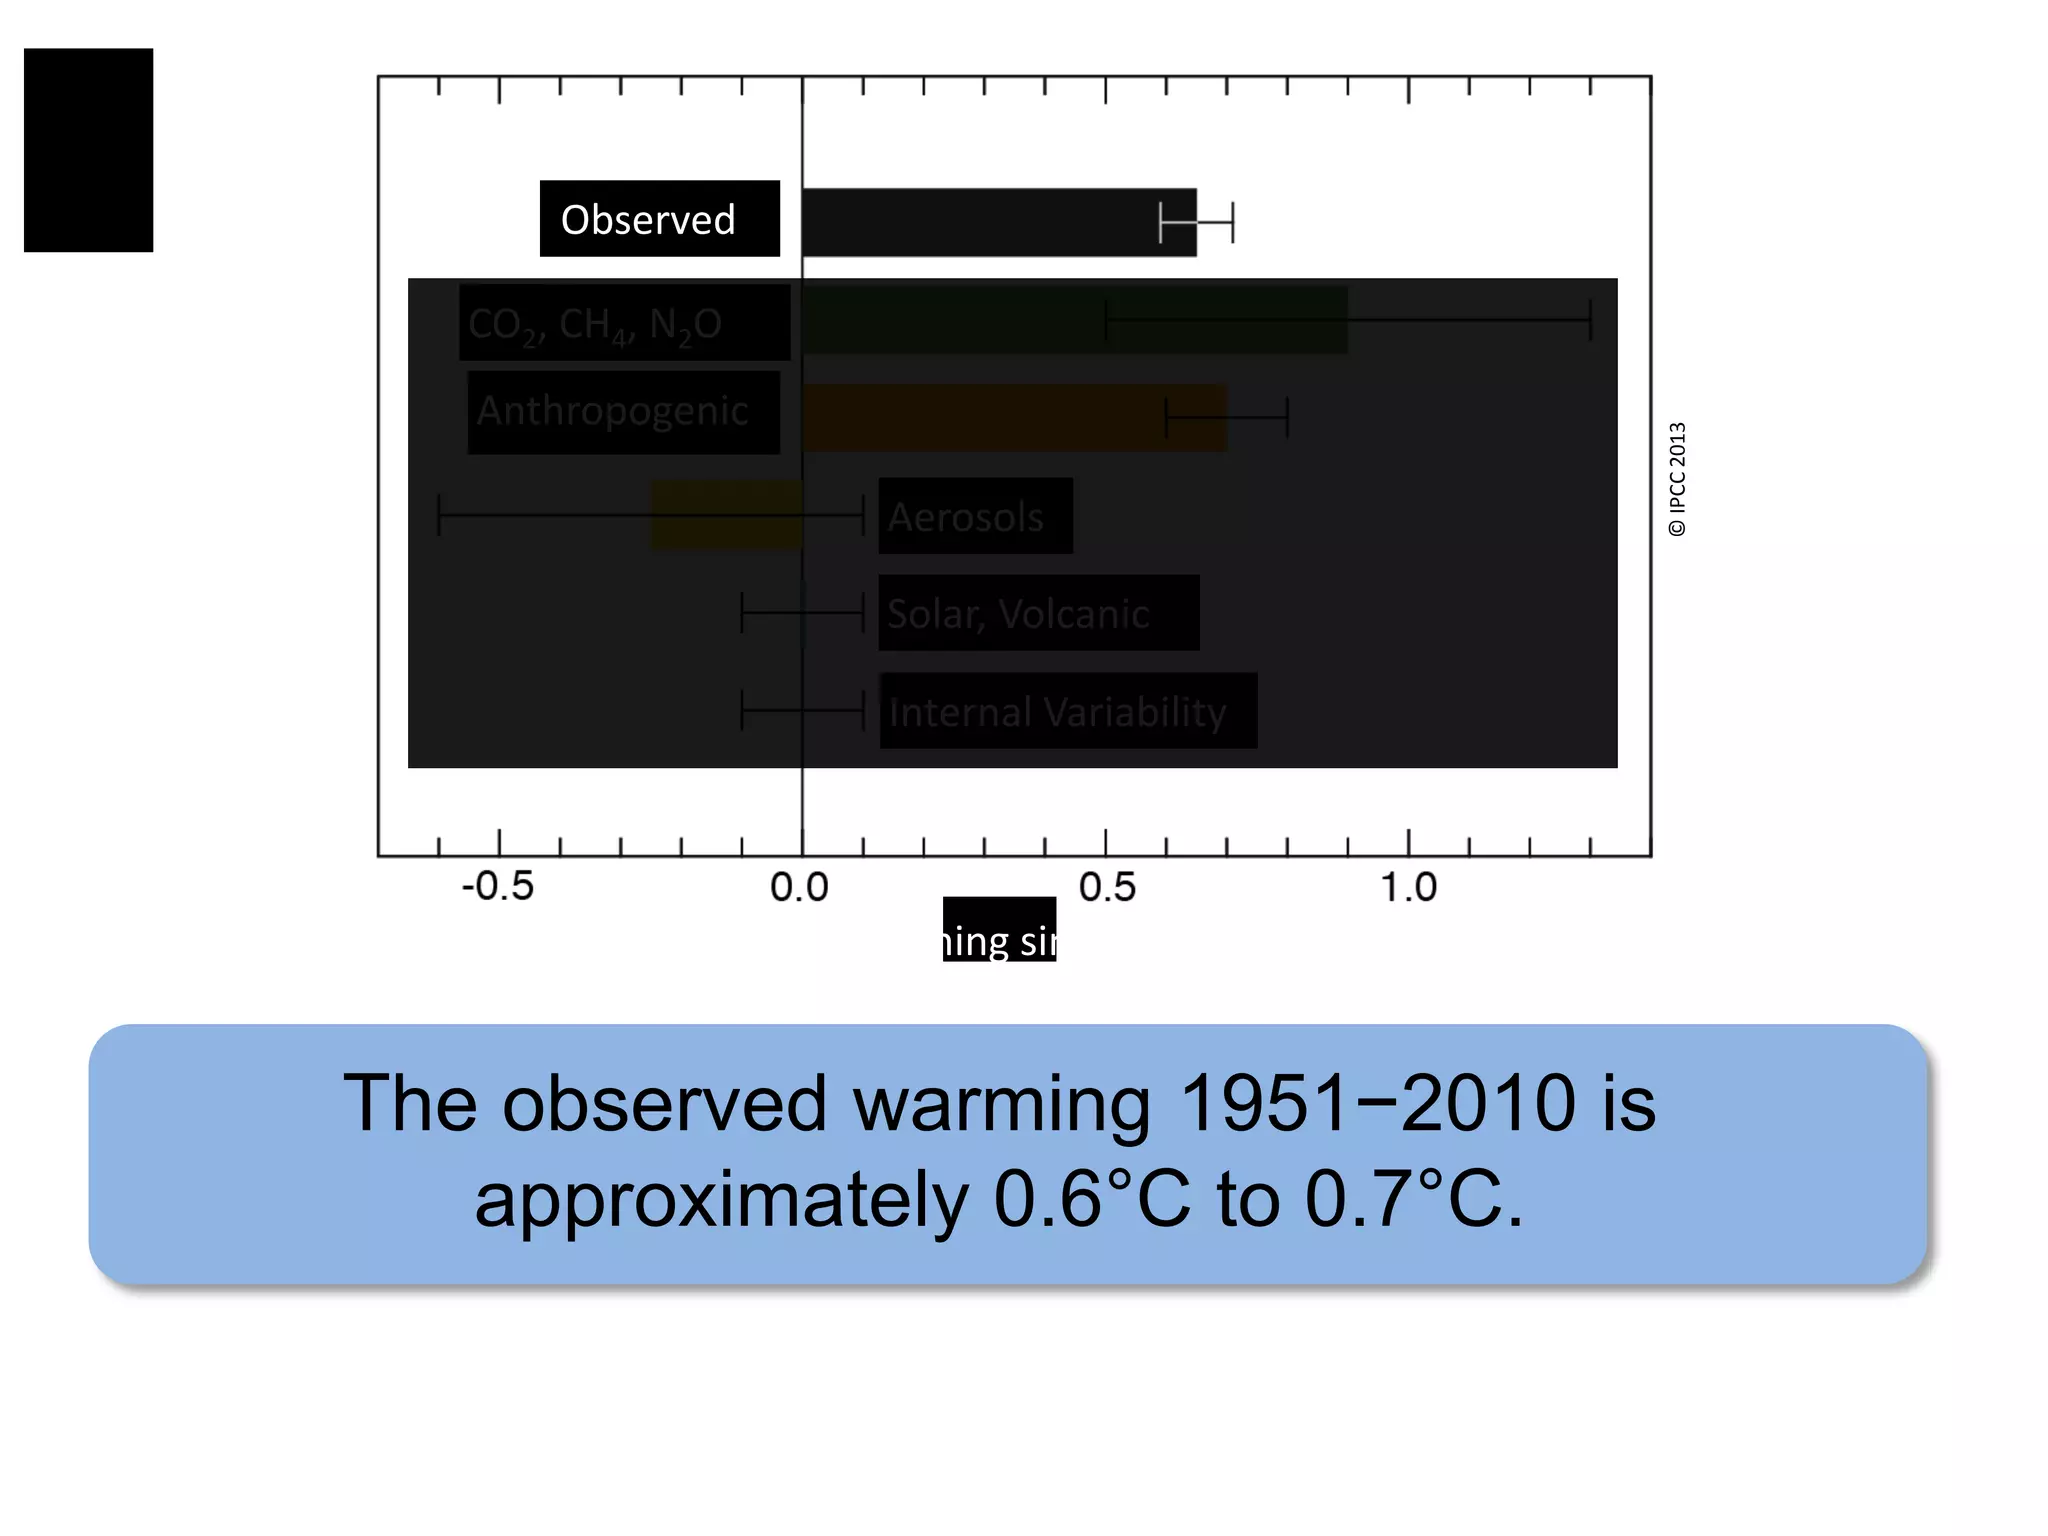
![Total radiative forcing is positive, and has led to an uptake
of energy in the climate system. The largest contribution [...]
is caused by the increase in the atmospheric concentration
of CO2 since 1750.
Fig.SPM.5
© IPCC 2013](https://image.slidesharecdn.com/1-190530150911/75/From-IPCC-WGI-AR5-to-AR6-9-2048.jpg)


![TSTFE.1,Fig.2
The contrast in precipitation between wet and dry regions
and between wet and dry seasons will increase, [...]
©IPCC2013
Change in water cycle properties from 1986-2005 to 2081-2100 in RCP8.5](https://image.slidesharecdn.com/1-190530150911/75/From-IPCC-WGI-AR5-to-AR6-14-2048.jpg)