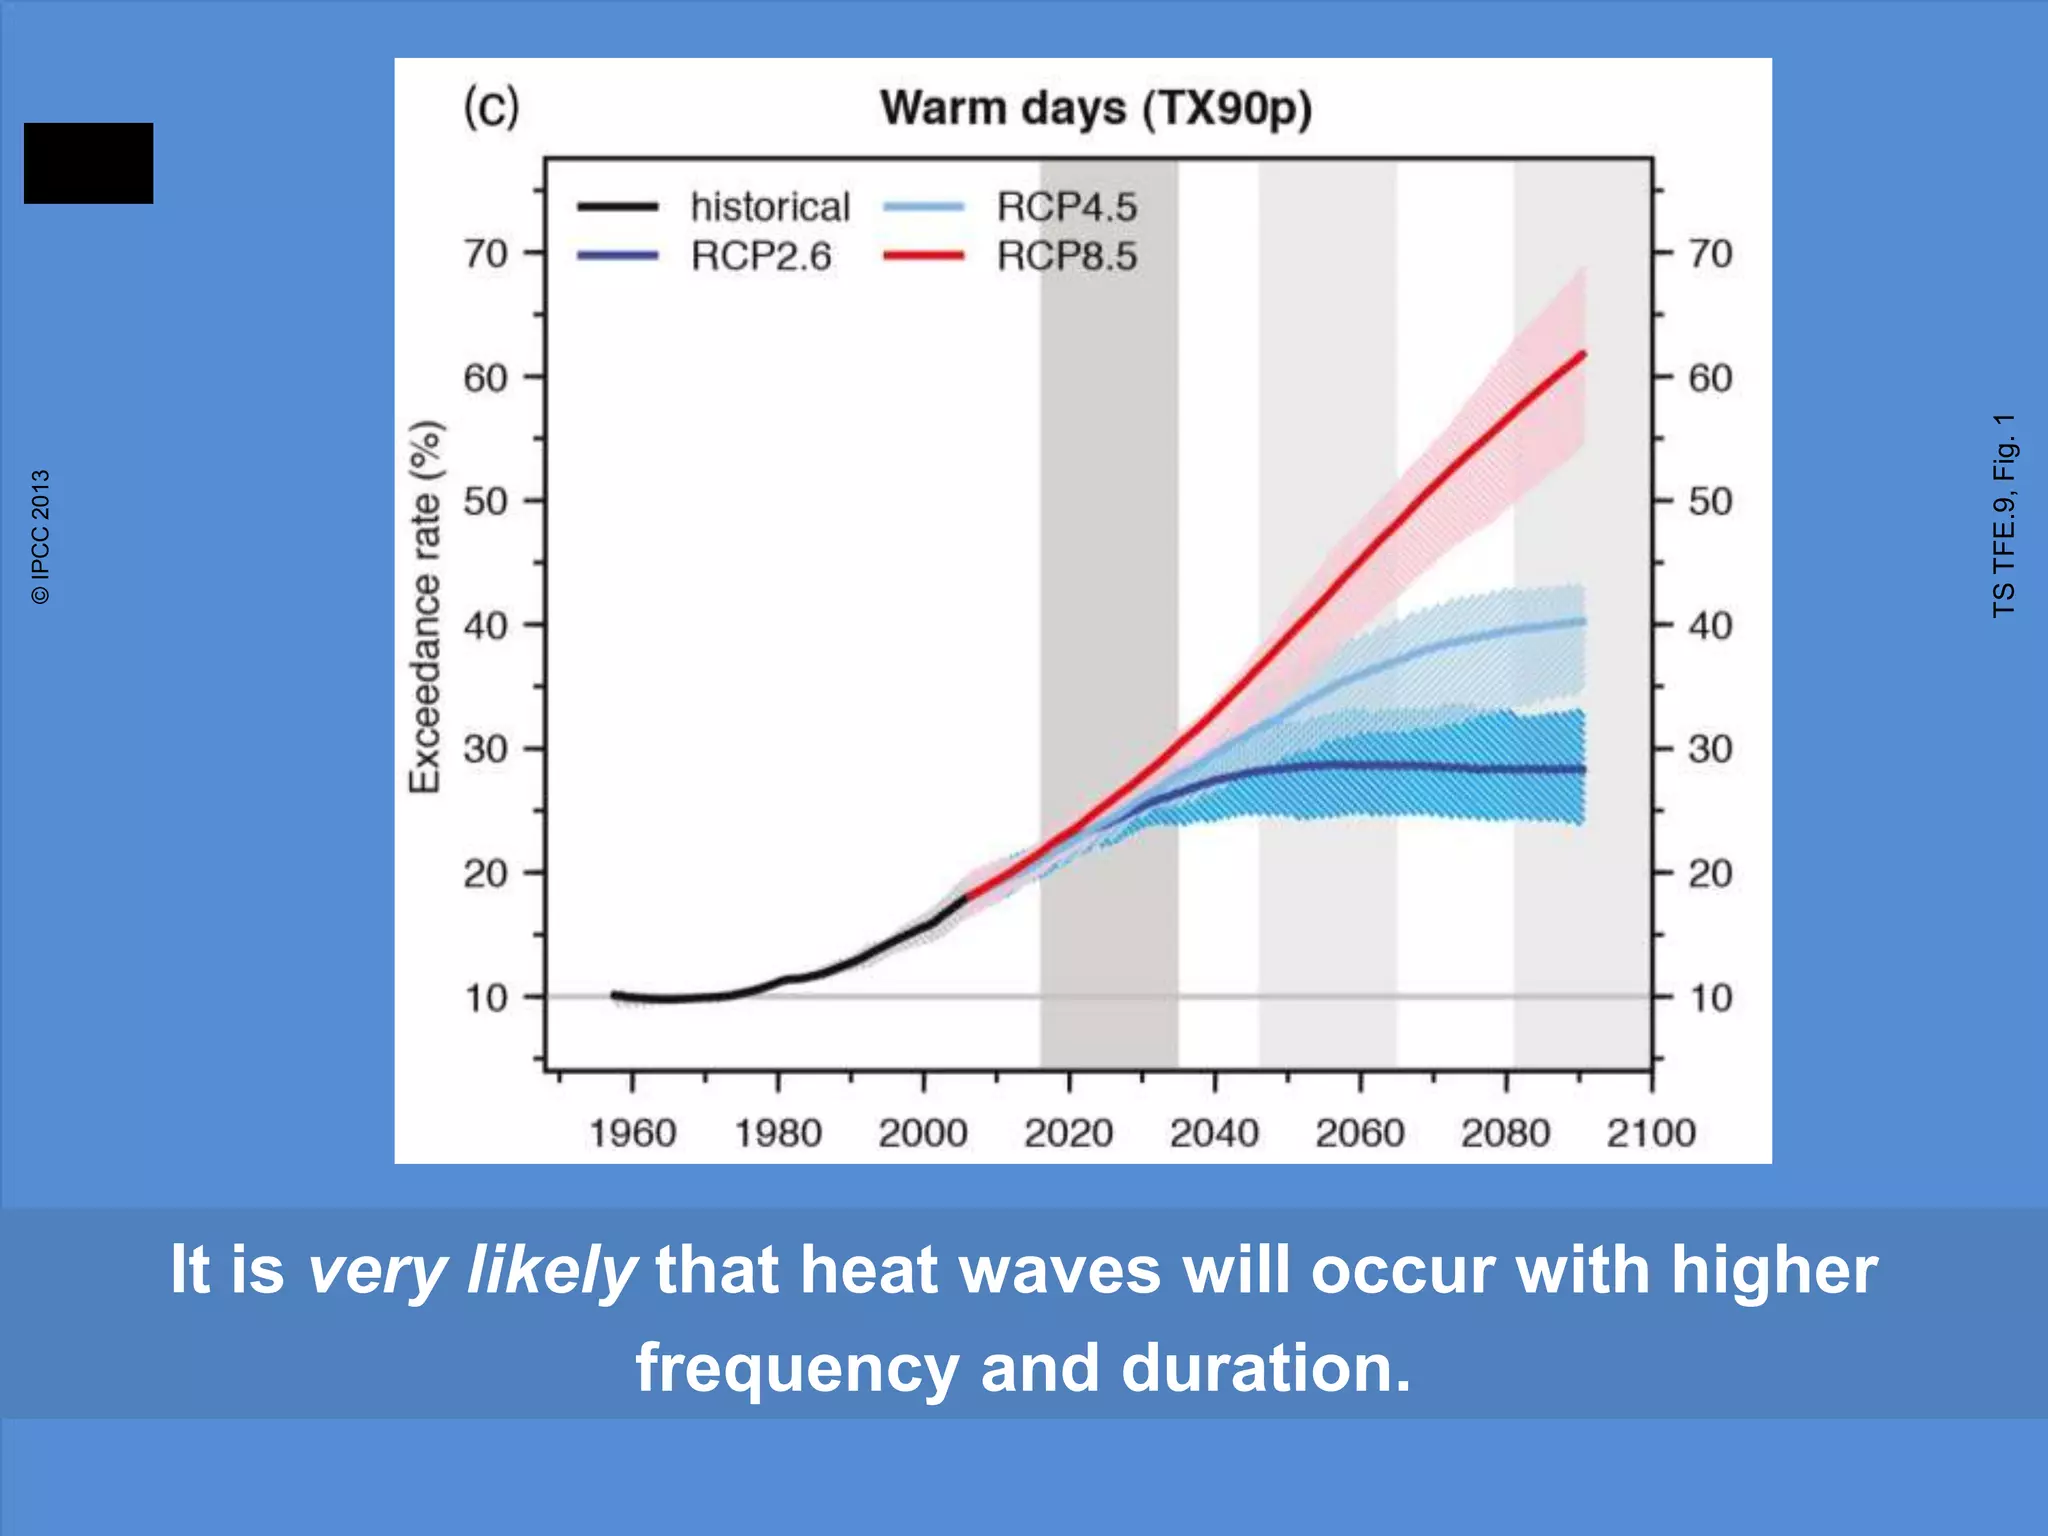
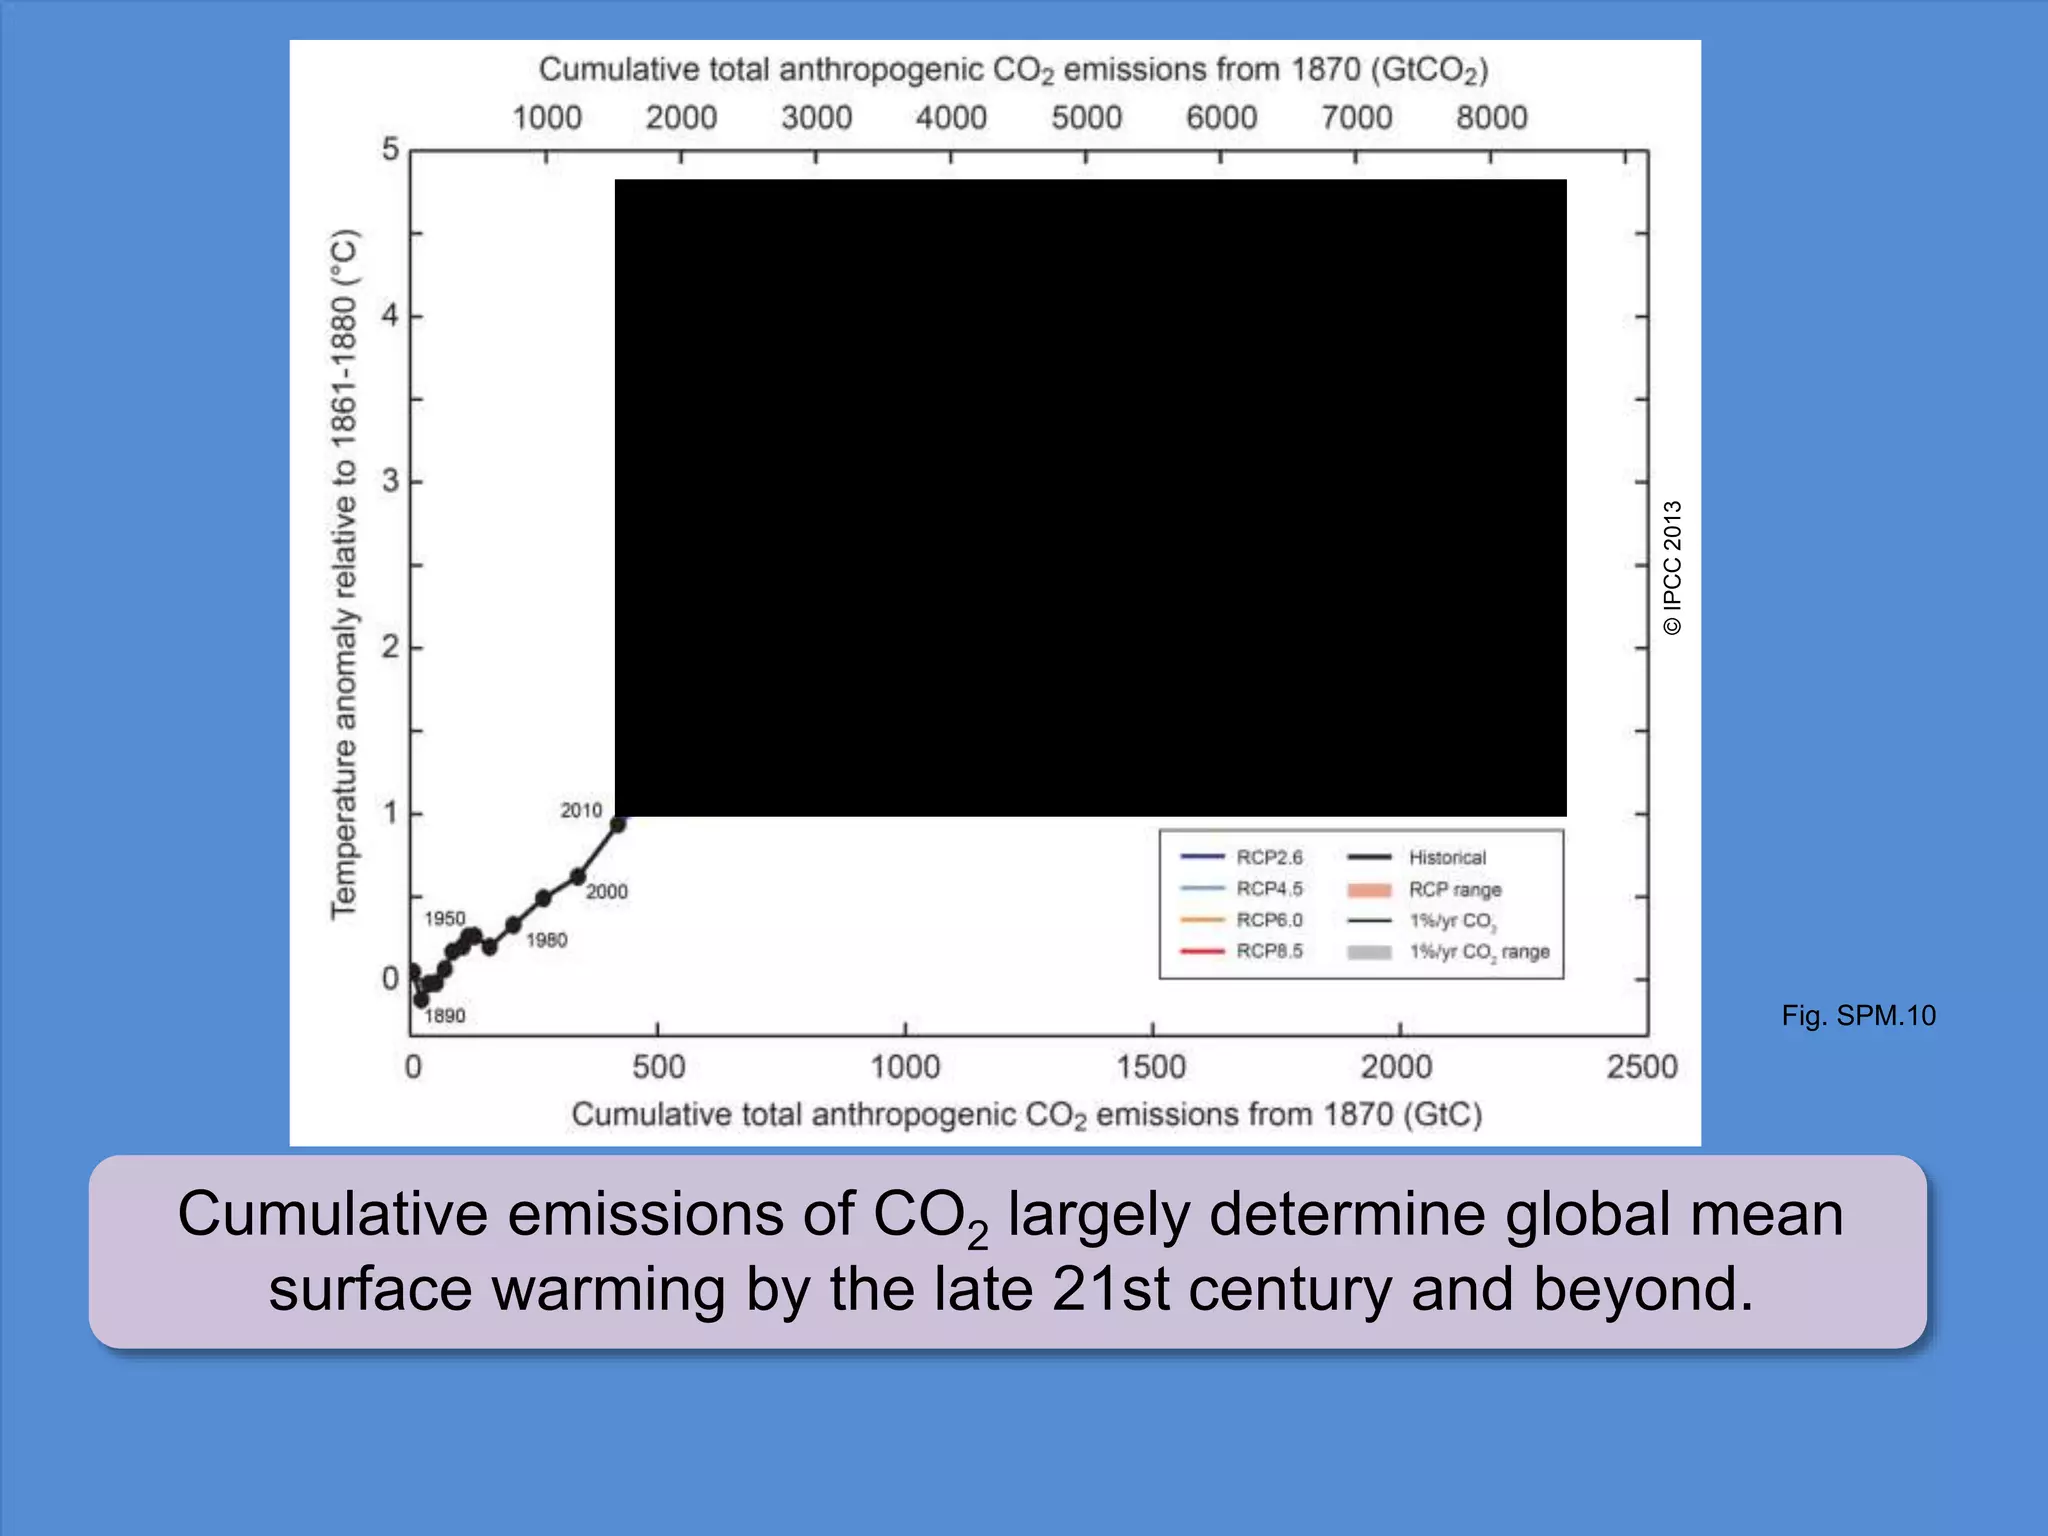
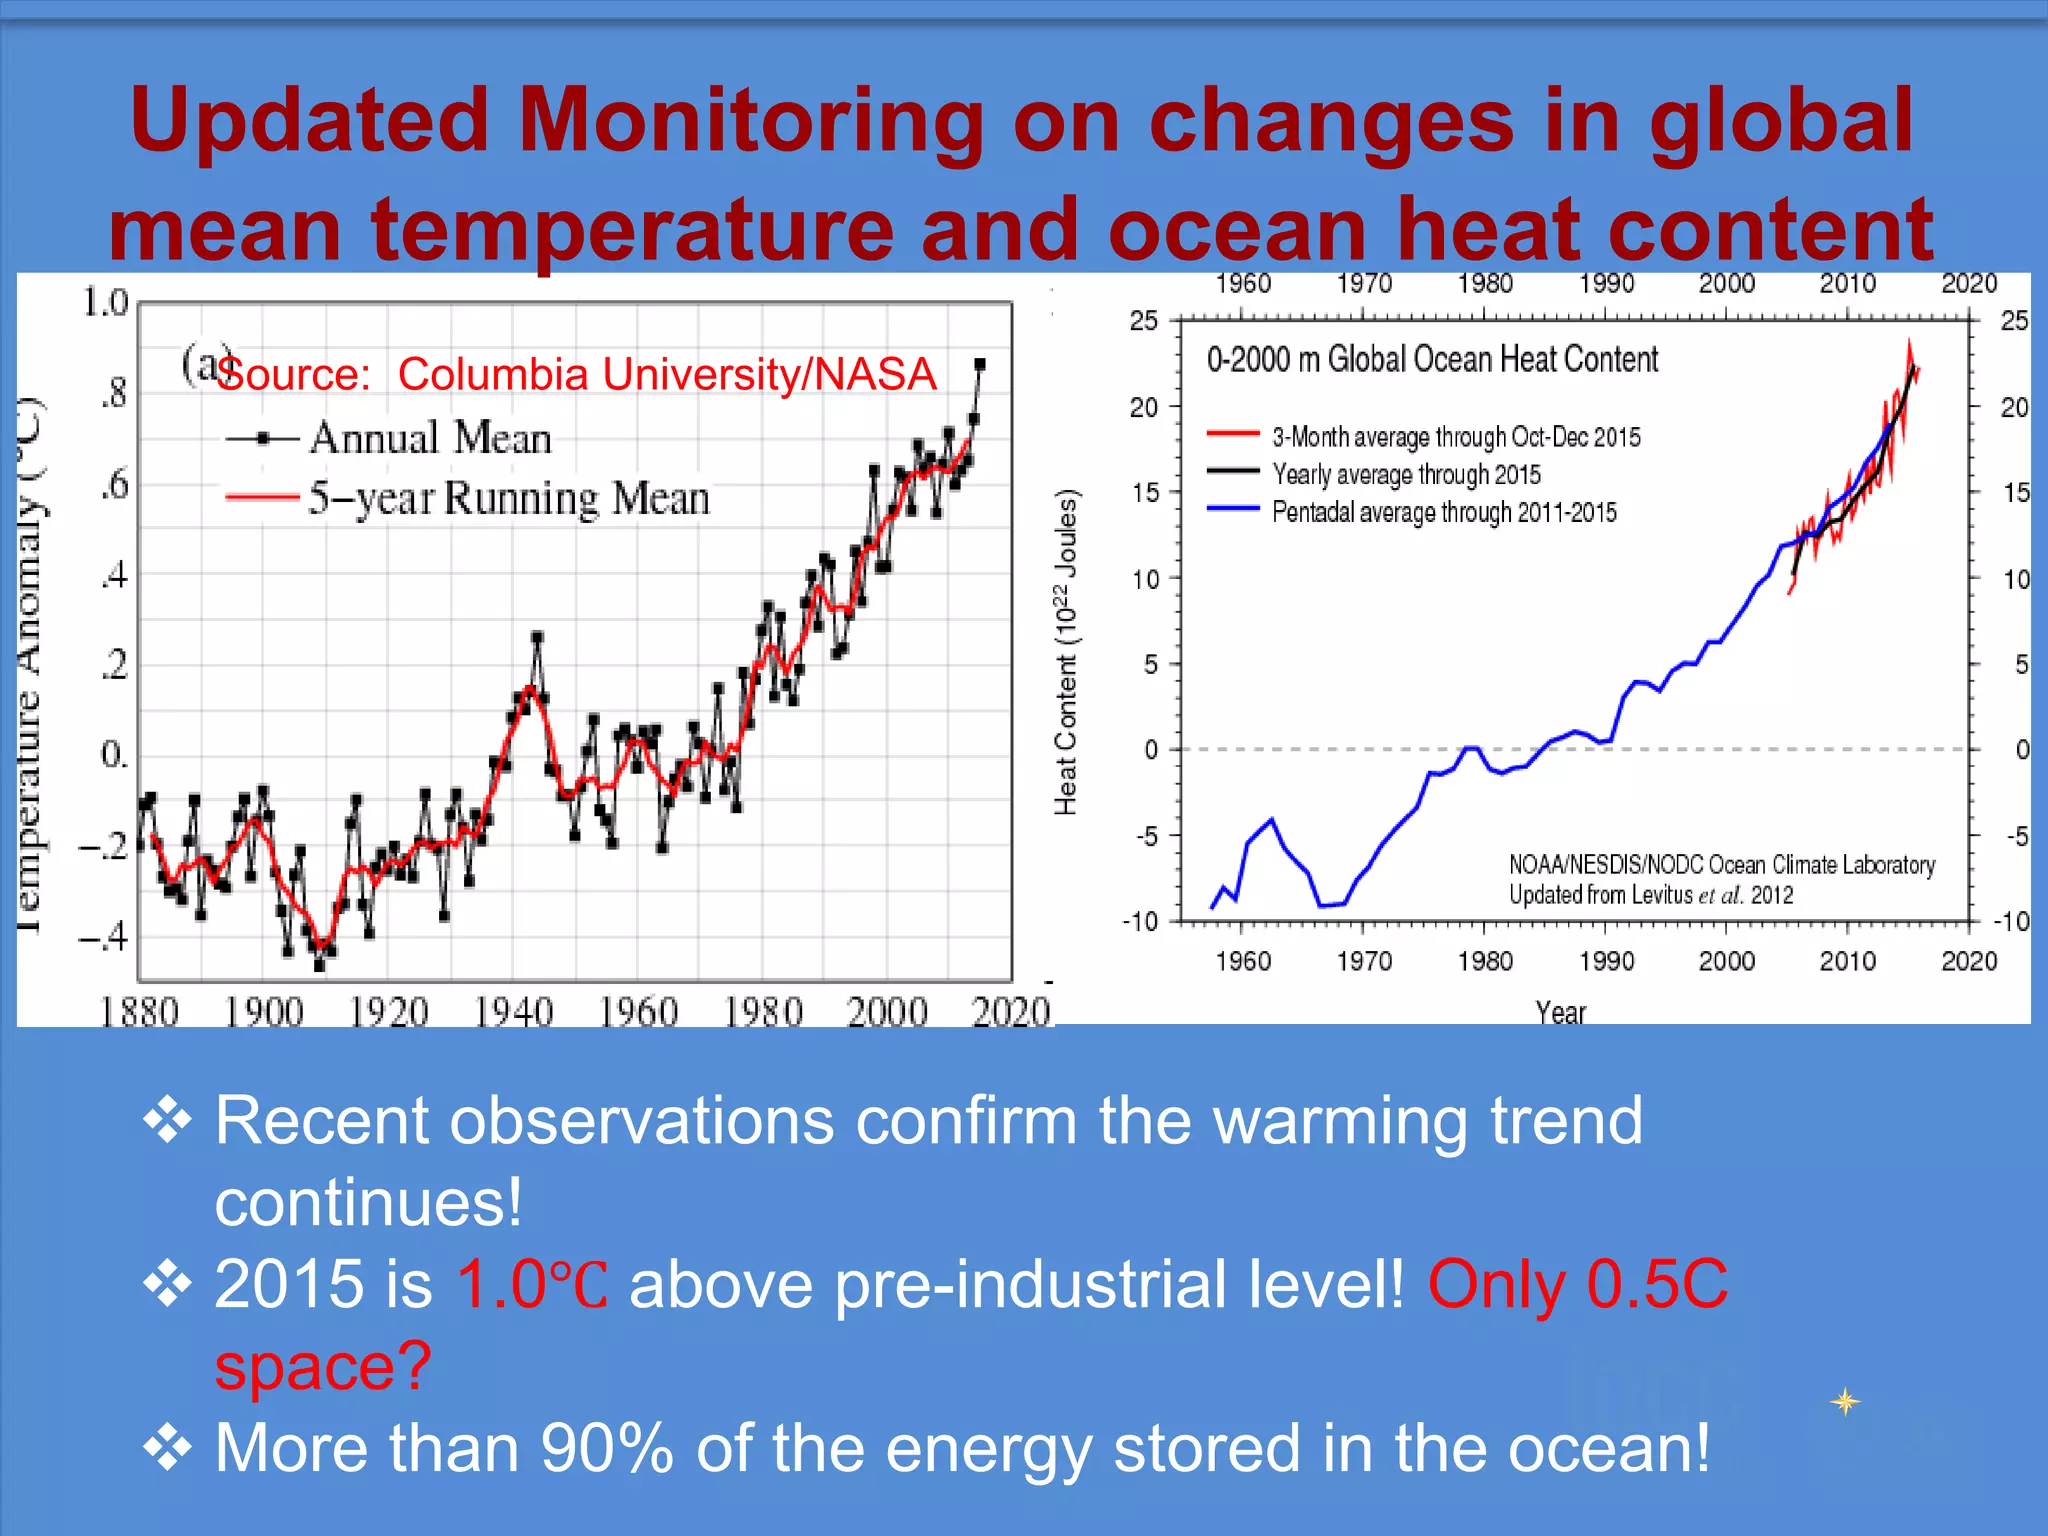
The document discusses the physical science basis of climate change. It summarizes that global warming trends are unequivocal based on multiple lines of evidence. The dominant cause is extremely likely to be human influence, including increased CO2 and other greenhouse gas emissions. If emissions continue at a high level, global temperatures are projected to rise more than 1.5°C by the late 21st century compared to pre-industrial levels, with more regional warming differences and effects on weather patterns like worsening heat waves. Sea level rise will also continue due to ocean and ice sheet changes. Limiting future climate change will require substantial emissions reductions.


![Fig.SPM.1b
Temperature Difference 1901 to 2012 based on trend (°C)
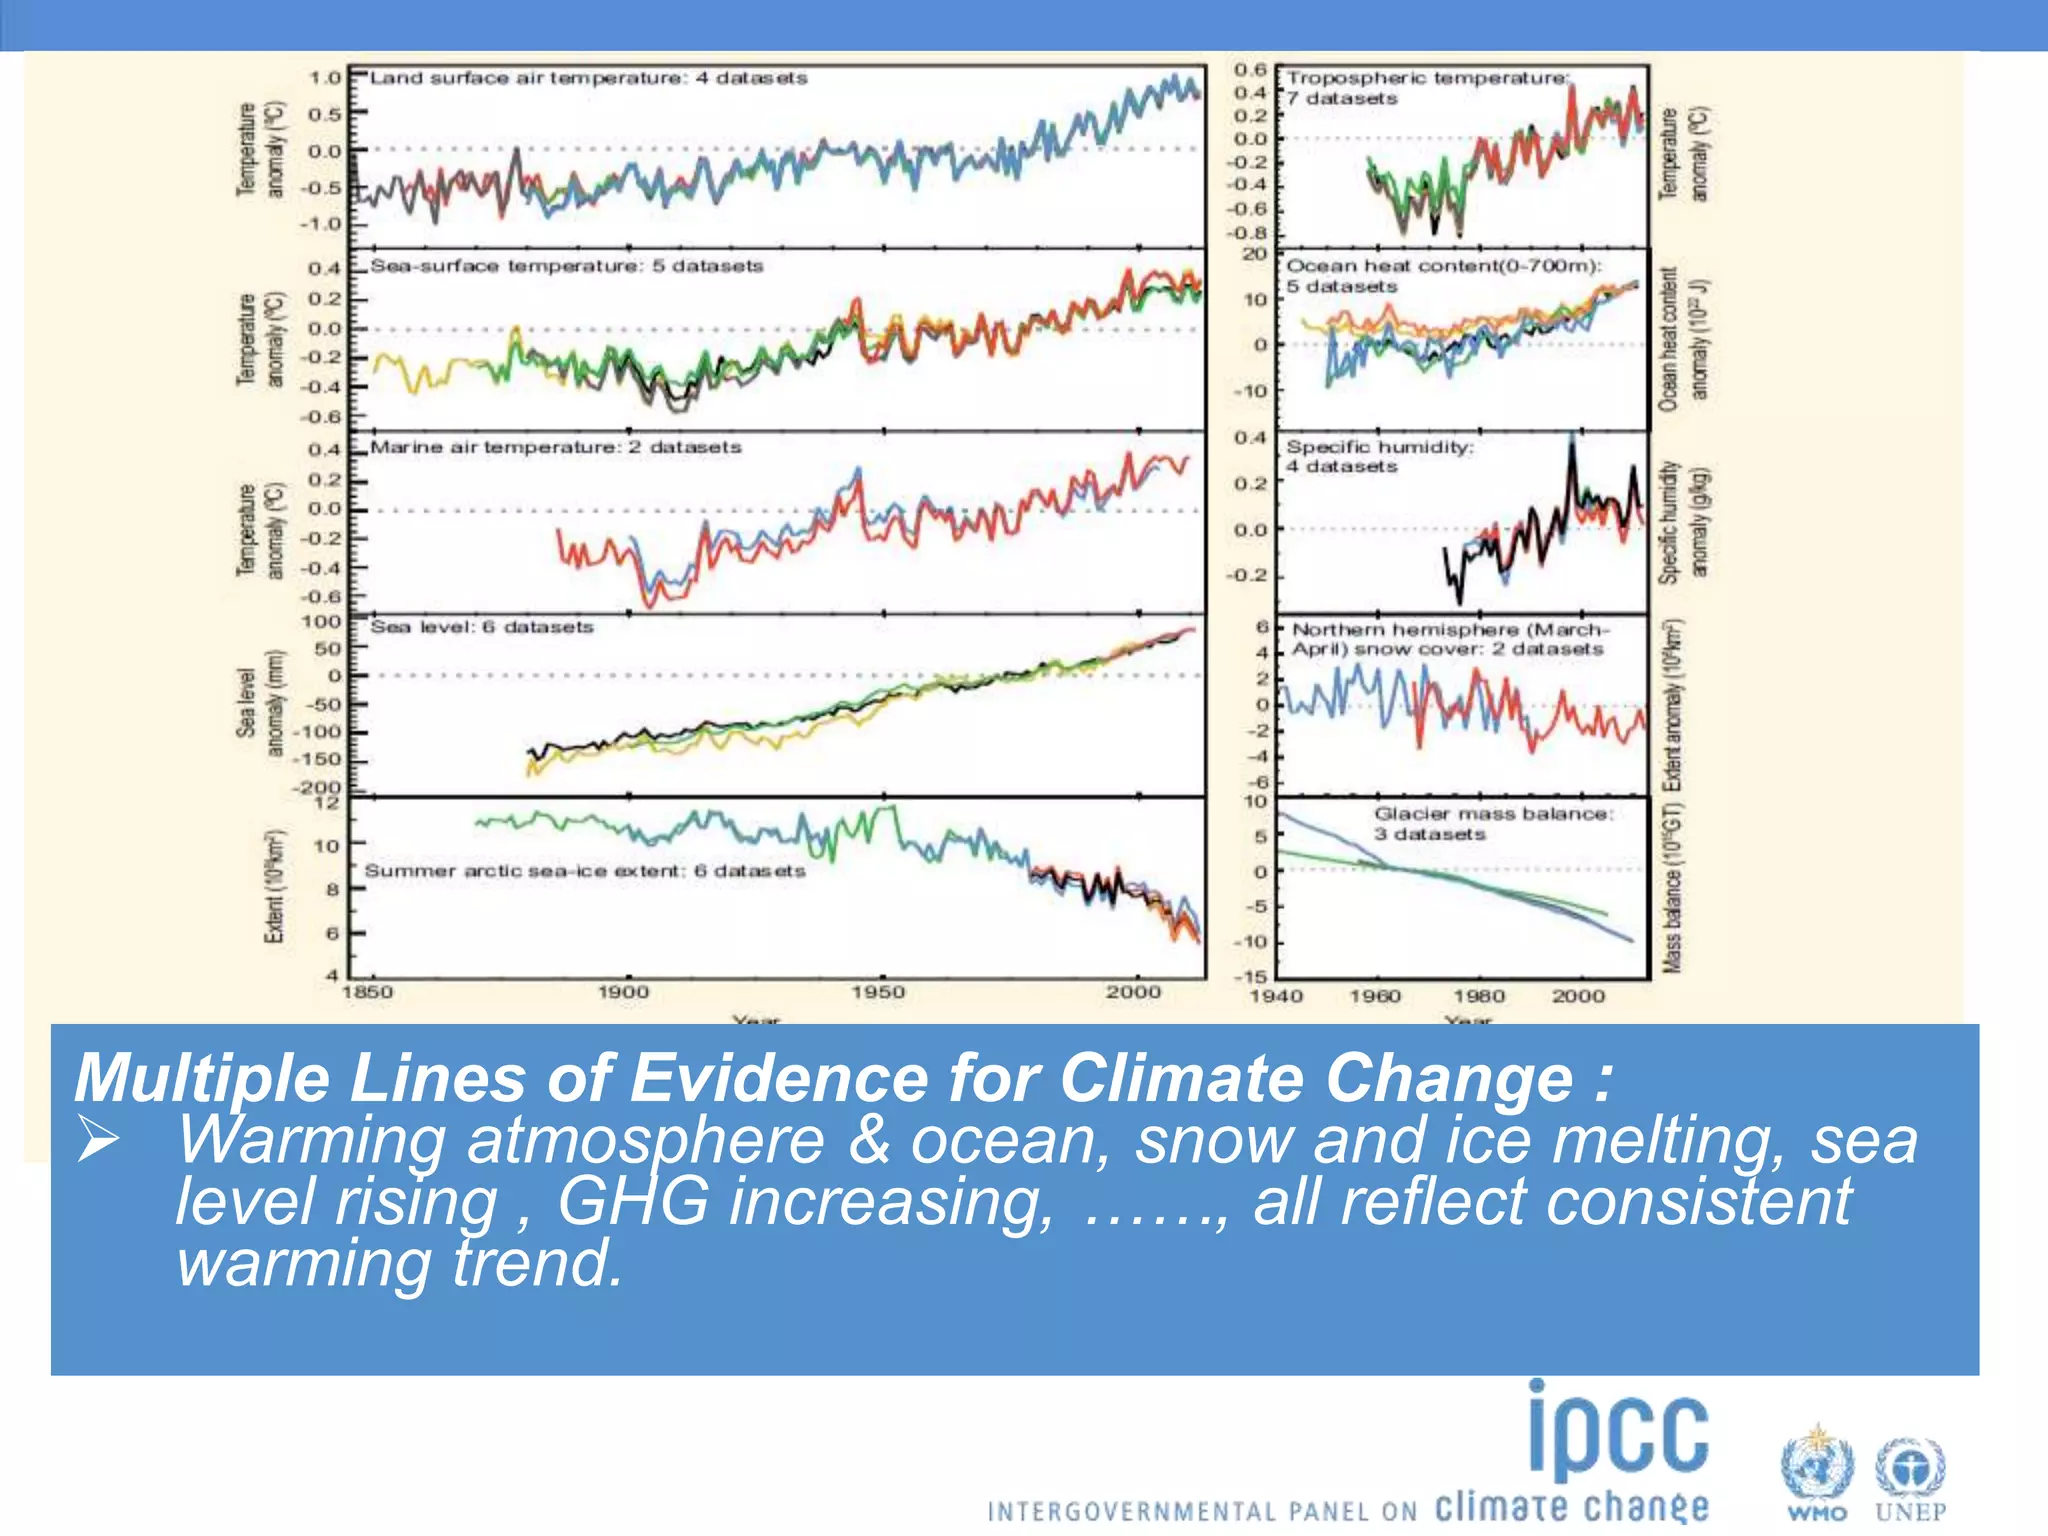
Warming of the climate system is unequivocal, [...]
© IPCC 2013](https://image.slidesharecdn.com/panmaowgi-161023172948/75/Climate-Change-The-Physical-Science-Basis-4-2048.jpg)


![TSTFE.1,Fig.2
The contrast in precipitation between wet and dry regions
and between wet and dry seasons will increase, [...]
©IPCC2013
Change in water cycle properties from 1986-2005 to 2081-2100 in RCP8.5](https://image.slidesharecdn.com/panmaowgi-161023172948/75/Climate-Change-The-Physical-Science-Basis-17-2048.jpg)