Download as PDF, PPTX
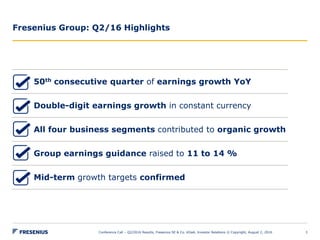
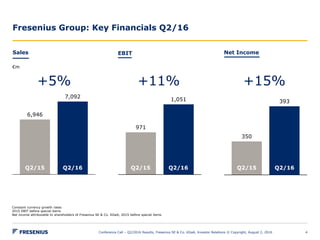
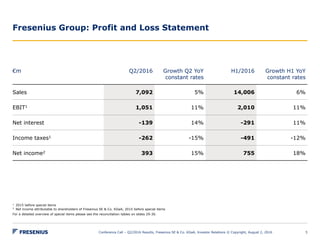
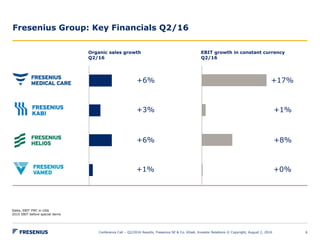

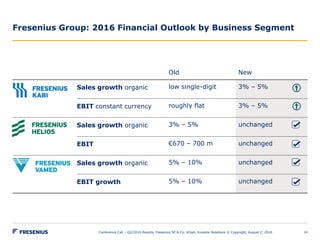
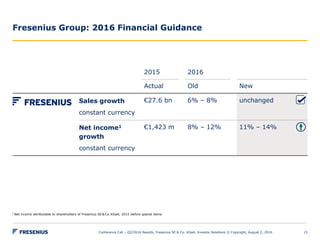

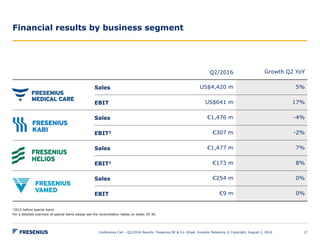
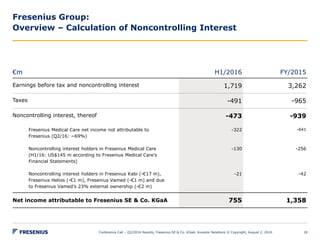
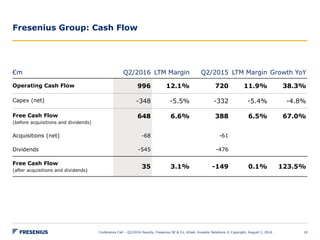
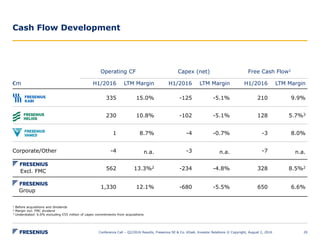
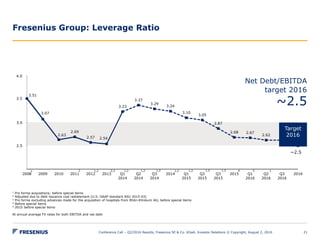
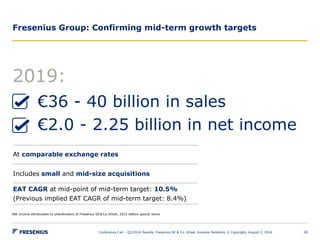
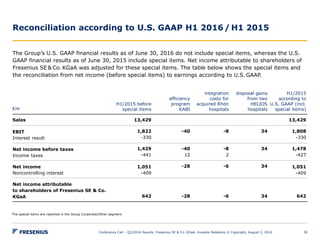

Fresenius reported its Q2/2016 results with highlights including 50 consecutive quarters of earnings growth year-over-year, double-digit earnings growth in constant currency, and all business segments contributing to organic growth. Fresenius raised its full-year 2016 group earnings guidance to 11-14% growth in net income. The company also confirmed its mid-term growth targets.


