Download as PDF, PPTX

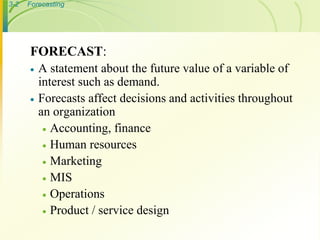
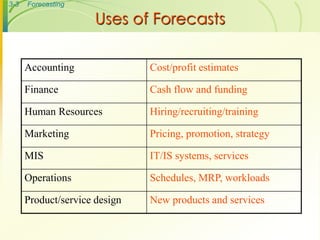
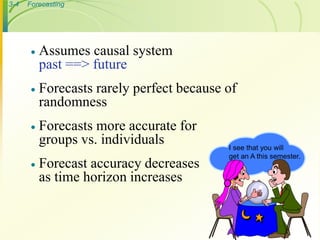
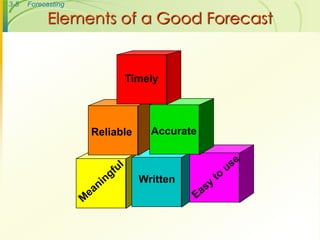
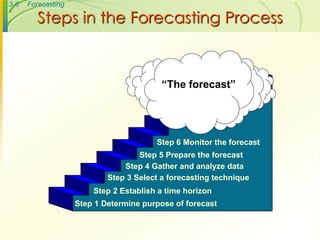
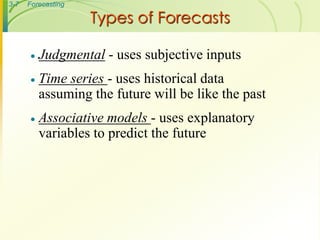

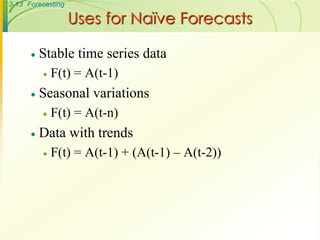
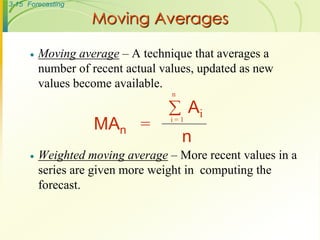
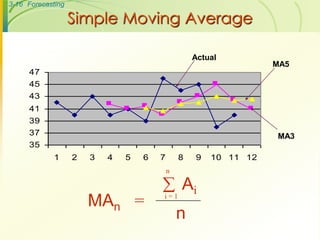
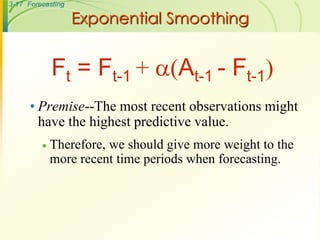
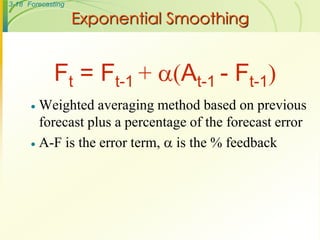
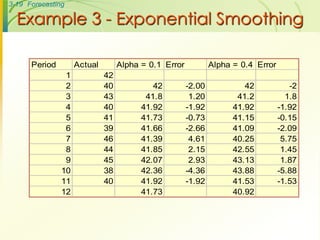
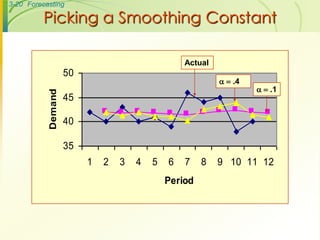

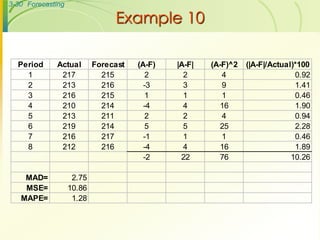
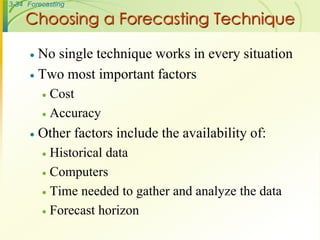
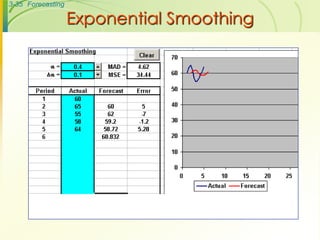
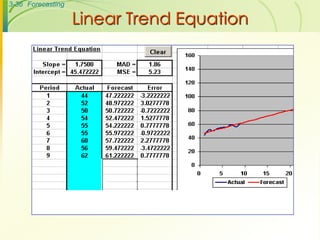
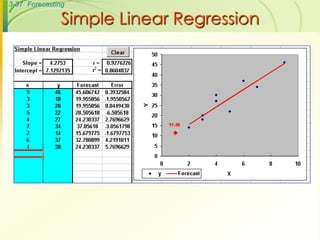

The document provides an overview of forecasting techniques. It defines a forecast as a statement about the future value of a variable of interest. Accurate forecasts are important for accounting, finance, human resources, marketing, operations and other business functions. The key types of forecasts discussed are judgmental forecasts, time series forecasts, and associative models. Time series techniques include naive methods, moving averages, weighted moving averages, and exponential smoothing. Accuracy is measured using metrics like mean absolute deviation, mean squared error and mean absolute percentage error. Choosing the right technique depends on factors like cost, required accuracy, available data and time horizon.