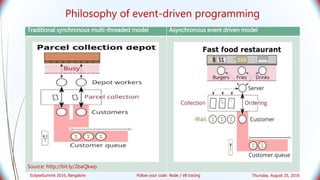
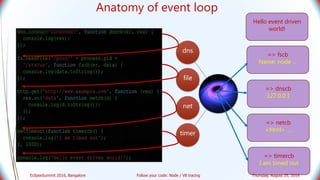
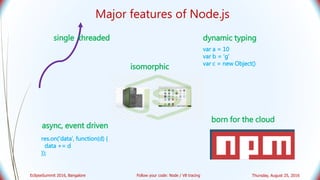
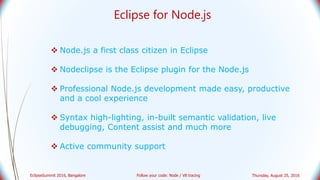
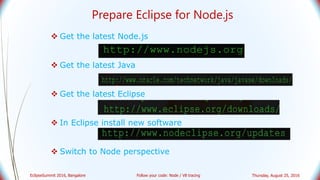
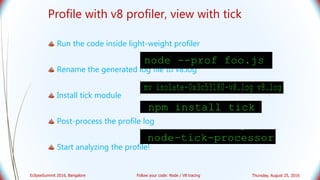
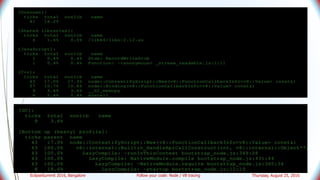
Follow your code: Node/V8 tracing
Gireesh Punathil, 26th Aug 2016
Agenda
♨ Overview of Node/V8 Runtime environment
♨ Eclipse as a Node.js development platform
♨ Debug Server-side Javascript through Browser
♨ Overview of in-built tracing
♨ Top tracing options in Node/V8
Thursday, August 25, 2016EclipseSummit 2016, Bangalore Follow your code: Node / V8 tracing
Philosophy of event-driven programming
Traditional synchronous multi-threaded model Asynchronous event driven model
Source: http://bit.ly/2baQkwp
Thursday, August 25, 2016EclipseSummit 2016, Bangalore Follow your code: Node / V8 tracing
4
dns
file
net
timer
Hello event driven
world!
=> dnscb
127.0.0.1
=> fscb
Name: node …
=> netcb
<html> …
=> timercb
I am timed out
Anatomy of event loop
Thursday, August 25, 2016EclipseSummit 2016, Bangalore Follow your code: Node / V8 tracing
var a = 10
var b = ‘g’
var c = new Object()
res.on(‘data’, function(d) {
data += d
});
dynamic typing
async, event driven
born for the cloud
isomorphic
single threaded
Major features of Node.js
Thursday, August 25, 2016EclipseSummit 2016, Bangalore Follow your code: Node / V8 tracing
Eclipse for Node.js
 Node.js a first class citizen in Eclipse
 Nodeclipse is the Eclipse plugin for the Node.js
 Professional Node.js development made easy, productive
and a cool experience
 Syntax high-lighting, in-built semantic validation, live
debugging, Content assist and much more
 Active community support
Thursday, August 25, 2016EclipseSummit 2016, Bangalore Follow your code: Node / V8 tracing
Prepare Eclipse for Node.js
 Get the latest Node.js
 Get the latest Java
 Get the latest Eclipse
 In Eclipse install new software
 Switch to Node perspective
Thursday, August 25, 2016EclipseSummit 2016, Bangalore Follow your code: Node / V8 tracing
Debug Server side script in the browser
♨ Server side code can be very large
♨ Quite difficult to follow the control flow and logic
♨ console logging very inefficient, and bad practice
♨ Native debugging is even more complex
♨ At the same time, vetting critical for reliable production
Thursday, August 25, 2016EclipseSummit 2016, Bangalore Follow your code: Node / V8 tracing
Debug Server side script in the browser
♨ Install a debugger module
♨ Start the application in the debugger
♨ Get the debugger port, and access it in the Browser
♨ Start following the code!
Thursday, August 25, 2016EclipseSummit 2016, Bangalore Follow your code: Node / V8 tracing
Tracing the script
Purpose
Trace Javascript functions with input and output
Output
Syntax (Heavy profile)
Thursday, August 25, 2016EclipseSummit 2016, Bangalore Follow your code: Node / V8 tracing
Log APIs
Purpose
Collect all the V8 API calls emanating from the application
Output
Syntax
Thursday, August 25, 2016EclipseSummit 2016, Bangalore Follow your code: Node / V8 tracing
Log Script execution
Purpose
Collect all the script / function information as and when they are loaded
/ compiled / recompiled
Output
Syntax
Thursday, August 25, 2016EclipseSummit 2016, Bangalore Follow your code: Node / V8 tracing
Tracing Garbage Collection
Purpose
Trace load in the v8 heap and collection patterns
Output
Syntax
Scavenge collection
Mark-sweep collection
Thursday, August 25, 2016EclipseSummit 2016, Bangalore Follow your code: Node / V8 tracing
Tracing Call Sequence
Purpose
Trace the code flow path on uncaught exception scenarios
Output
Syntax
Thursday, August 25, 2016EclipseSummit 2016, Bangalore Follow your code: Node / V8 tracing
Tracing Compilation
Purpose
Trace optimize compilation decisions and their reasons
Output
Syntax
Thursday, August 25, 2016EclipseSummit 2016, Bangalore Follow your code: Node / V8 tracing
Tracing Compiled Code
Purpose
Trace the generated native code for the Javascript source
Output
Syntax
Thursday, August 25, 2016EclipseSummit 2016, Bangalore Follow your code: Node / V8 tracing
Selectively disable Compilation
Purpose
Identify and omit optimize compilation on problematic methods
Output
Syntax
Thursday, August 25, 2016EclipseSummit 2016, Bangalore Follow your code: Node / V8 tracing
Profile the application for Performance
♨ Manual profiling inefficient and impractical
♨ Adding time measurement cause further burden
♨ Native profilers do not provide Javascript insights
♨ Large applications often contain performance hideouts
♨ Precise performance measures is a hallmark qualifier for
software modules
Thursday, August 25, 2016EclipseSummit 2016, Bangalore Follow your code: Node / V8 tracing
Profile with v8 profiler, view with tick
♨ Run the code inside light-weight profiler
♨ Rename the generated log file to v8.log
♨ Install tick module
♨ Post-process the profile log
♨ Start analyzing the profile!
Thursday, August 25, 2016EclipseSummit 2016, Bangalore Follow your code: Node / V8 tracing
For further learning
♨ Learn Node.js: https://nodejs.org/en/docs/
♨ Learn Javascript: http://www.w3schools.com/js/
♨ Learn V8: https://developers.google.com/v8/intro
♨ Learn Nodeclipse: http://www.nodeclipse.org
♨ Chrome developer tools: https://developer.chrome.com/devtools
Thursday, August 25, 2016EclipseSummit 2016, Bangalore Follow your code: Node / V8 tracing

Follow your code: Node tracing

  • 1.
    Follow your code:Node/V8 tracing Gireesh Punathil, 26th Aug 2016
  • 2.
    Agenda ♨ Overview ofNode/V8 Runtime environment ♨ Eclipse as a Node.js development platform ♨ Debug Server-side Javascript through Browser ♨ Overview of in-built tracing ♨ Top tracing options in Node/V8 Thursday, August 25, 2016EclipseSummit 2016, Bangalore Follow your code: Node / V8 tracing
  • 3.
    Philosophy of event-drivenprogramming Traditional synchronous multi-threaded model Asynchronous event driven model Source: http://bit.ly/2baQkwp Thursday, August 25, 2016EclipseSummit 2016, Bangalore Follow your code: Node / V8 tracing
  • 4.
    4 dns file net timer Hello event driven world! =>dnscb 127.0.0.1 => fscb Name: node … => netcb <html> … => timercb I am timed out Anatomy of event loop Thursday, August 25, 2016EclipseSummit 2016, Bangalore Follow your code: Node / V8 tracing
  • 5.
    var a =10 var b = ‘g’ var c = new Object() res.on(‘data’, function(d) { data += d }); dynamic typing async, event driven born for the cloud isomorphic single threaded Major features of Node.js Thursday, August 25, 2016EclipseSummit 2016, Bangalore Follow your code: Node / V8 tracing
  • 6.
    Eclipse for Node.js Node.js a first class citizen in Eclipse  Nodeclipse is the Eclipse plugin for the Node.js  Professional Node.js development made easy, productive and a cool experience  Syntax high-lighting, in-built semantic validation, live debugging, Content assist and much more  Active community support Thursday, August 25, 2016EclipseSummit 2016, Bangalore Follow your code: Node / V8 tracing
  • 7.
    Prepare Eclipse forNode.js  Get the latest Node.js  Get the latest Java  Get the latest Eclipse  In Eclipse install new software  Switch to Node perspective Thursday, August 25, 2016EclipseSummit 2016, Bangalore Follow your code: Node / V8 tracing
  • 8.
    Debug Server sidescript in the browser ♨ Server side code can be very large ♨ Quite difficult to follow the control flow and logic ♨ console logging very inefficient, and bad practice ♨ Native debugging is even more complex ♨ At the same time, vetting critical for reliable production Thursday, August 25, 2016EclipseSummit 2016, Bangalore Follow your code: Node / V8 tracing
  • 9.
    Debug Server sidescript in the browser ♨ Install a debugger module ♨ Start the application in the debugger ♨ Get the debugger port, and access it in the Browser ♨ Start following the code! Thursday, August 25, 2016EclipseSummit 2016, Bangalore Follow your code: Node / V8 tracing
  • 10.
    Thursday, August 25,2016EclipseSummit 2016, Bangalore Follow your code: Node / V8 tracing
  • 11.
    Tracing the script Purpose TraceJavascript functions with input and output Output Syntax (Heavy profile) Thursday, August 25, 2016EclipseSummit 2016, Bangalore Follow your code: Node / V8 tracing
  • 12.
    Log APIs Purpose Collect allthe V8 API calls emanating from the application Output Syntax Thursday, August 25, 2016EclipseSummit 2016, Bangalore Follow your code: Node / V8 tracing
  • 13.
    Log Script execution Purpose Collectall the script / function information as and when they are loaded / compiled / recompiled Output Syntax Thursday, August 25, 2016EclipseSummit 2016, Bangalore Follow your code: Node / V8 tracing
  • 14.
    Tracing Garbage Collection Purpose Traceload in the v8 heap and collection patterns Output Syntax Scavenge collection Mark-sweep collection Thursday, August 25, 2016EclipseSummit 2016, Bangalore Follow your code: Node / V8 tracing
  • 15.
    Tracing Call Sequence Purpose Tracethe code flow path on uncaught exception scenarios Output Syntax Thursday, August 25, 2016EclipseSummit 2016, Bangalore Follow your code: Node / V8 tracing
  • 16.
    Tracing Compilation Purpose Trace optimizecompilation decisions and their reasons Output Syntax Thursday, August 25, 2016EclipseSummit 2016, Bangalore Follow your code: Node / V8 tracing
  • 17.
    Tracing Compiled Code Purpose Tracethe generated native code for the Javascript source Output Syntax Thursday, August 25, 2016EclipseSummit 2016, Bangalore Follow your code: Node / V8 tracing
  • 18.
    Thursday, August 25,2016EclipseSummit 2016, Bangalore Follow your code: Node / V8 tracing
  • 19.
    Selectively disable Compilation Purpose Identifyand omit optimize compilation on problematic methods Output Syntax Thursday, August 25, 2016EclipseSummit 2016, Bangalore Follow your code: Node / V8 tracing
  • 20.
    Profile the applicationfor Performance ♨ Manual profiling inefficient and impractical ♨ Adding time measurement cause further burden ♨ Native profilers do not provide Javascript insights ♨ Large applications often contain performance hideouts ♨ Precise performance measures is a hallmark qualifier for software modules Thursday, August 25, 2016EclipseSummit 2016, Bangalore Follow your code: Node / V8 tracing
  • 21.
    Profile with v8profiler, view with tick ♨ Run the code inside light-weight profiler ♨ Rename the generated log file to v8.log ♨ Install tick module ♨ Post-process the profile log ♨ Start analyzing the profile! Thursday, August 25, 2016EclipseSummit 2016, Bangalore Follow your code: Node / V8 tracing
  • 22.
    Thursday, August 25,2016EclipseSummit 2016, Bangalore Follow your code: Node / V8 tracing
  • 23.
    For further learning ♨Learn Node.js: https://nodejs.org/en/docs/ ♨ Learn Javascript: http://www.w3schools.com/js/ ♨ Learn V8: https://developers.google.com/v8/intro ♨ Learn Nodeclipse: http://www.nodeclipse.org ♨ Chrome developer tools: https://developer.chrome.com/devtools Thursday, August 25, 2016EclipseSummit 2016, Bangalore Follow your code: Node / V8 tracing