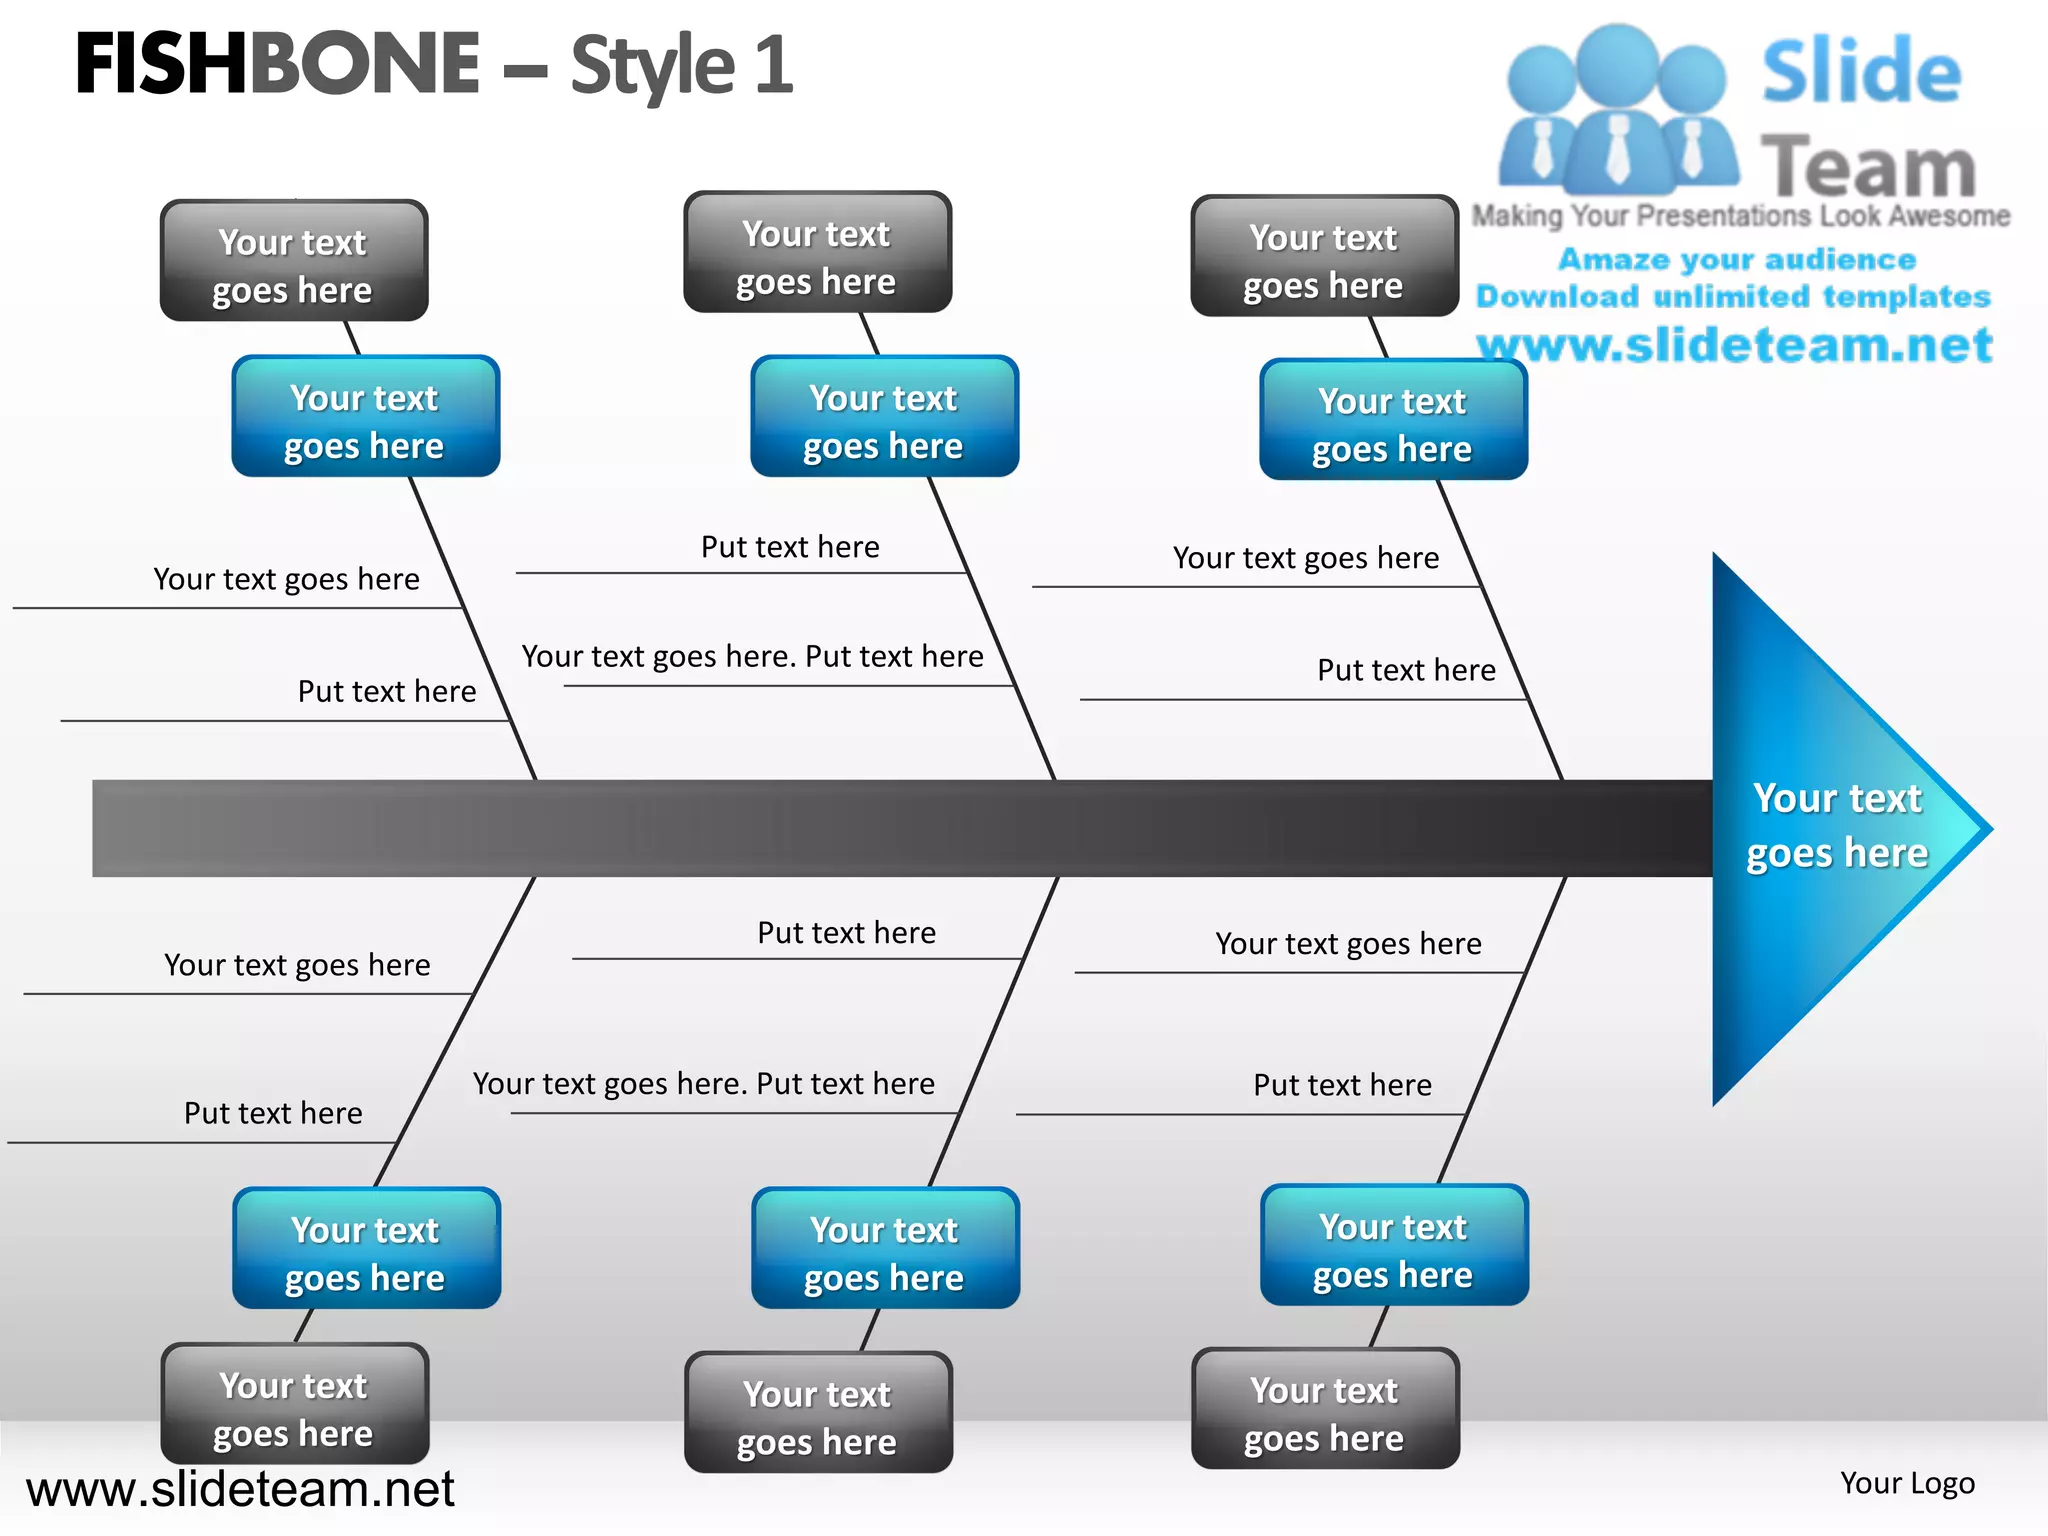
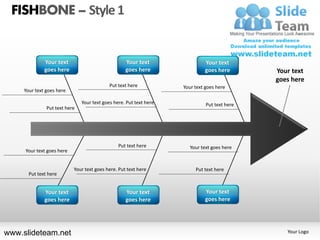
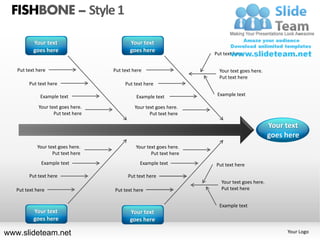
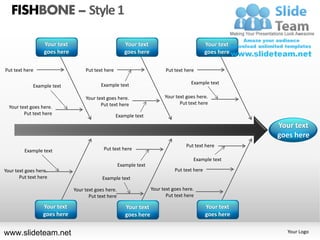
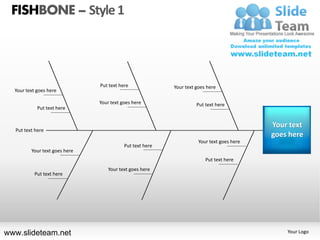
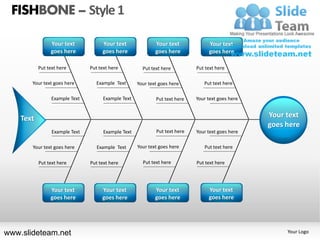
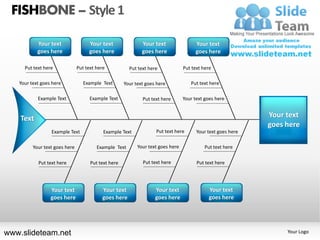
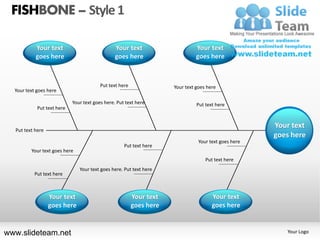
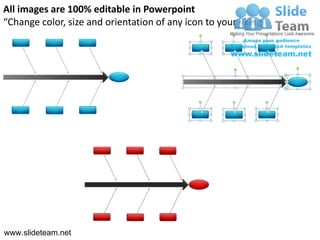
This document demonstrates a fishbone diagram layout, also known as a cause-and-effect diagram, with multiple branches extending from a central topic to illustrate potential causes. Placeholder text is included throughout for customization. The structure includes primary branches extending from the central topic, with secondary branches extending from the primary branches to explore potential root causes in more depth.
The document provides instructions for formatting a fishbone diagram in PowerPoint. It includes 27 steps to arrange text boxes and arrows in a specific layout resembling a fishbone or Ishikawa diagram. The fishbone diagram can be used to analyze the potential causes of a problem or effect. Users are instructed to customize the text, colors, and layout to suit their particular analysis.
This document provides instructions for editing a fishbone diagram template in PowerPoint. The template contains a fishbone diagram with placeholder text that can be edited. Instructions are provided on how to ungroup elements to edit them individually and how to change the color of elements by accessing the format shape options. The template is fully editable and customizable to analyze causes and effects for a given problem or topic.
This document provides a template for a fishbone diagram titled "FISHBONE – Style 1". The template contains placeholder text indicating where a user can add their own text. It includes multiple branches extending from a central topic, with sub-branches extending from each main branch. At the end, instructions are provided on how to edit the color, ungroup objects, and modify the template icons. The template enables users to easily create a customized fishbone diagram to organize and visualize causes and effects.
The document provides templates for fishbone diagrams in different styles. The templates contain placeholder text that can be replaced with specific text relevant to the topic being analyzed. The templates are fully editable and customizable, allowing the color, size, orientation and grouping of elements to be modified as needed.
The document shows different styles of fishbone diagrams that can be used in PowerPoint presentations. The fishbone diagrams have branches extending from a central topic to various causes or factors. Placeholder text or examples are included throughout the diagrams. Instructions are provided at the bottom on how to individually edit objects by ungrouping them and changing features like color, size or orientation. The diagrams provide templates that can be customized for root cause analysis or other topics.
The document shows different styles of fishbone diagrams that can be used in PowerPoint presentations. The fishbone diagrams have branches extending from a central topic to various causes or factors. Placeholder text or examples are included throughout the diagrams. Instructions are provided at the bottom on how to individually edit objects by ungrouping them and changing features like color, size, and orientation. The diagrams are fully editable and customizable for presentations.
The document shows different styles of fishbone diagrams that can be used in PowerPoint presentations. The fishbone diagrams have branches extending from a central topic to various causes or factors. Placeholder text or examples are included throughout the diagrams. Instructions are provided at the bottom on how to individually edit objects by ungrouping them and changing features like color, size or orientation. The diagrams provide templates that can be customized with text for analyzing problems or processes.
The document shows different styles of fishbone diagrams that can be used in PowerPoint presentations. The fishbone diagrams have branches extending from a central topic to various causes or factors. Placeholder text or examples are included throughout the diagrams. Instructions are provided at the bottom on how to individually edit objects by ungrouping them and changing features like color, size, and orientation.
The document shows different styles of fishbone diagrams that can be used in PowerPoint presentations. The fishbone diagrams have branches extending from a central topic to various causes or factors. Placeholder text or examples are included throughout the diagrams. Instructions are provided at the bottom on how to individually edit objects by ungrouping them and changing features like color, size or orientation. The diagrams provide templates that can be customized with text for analyzing problems or processes.
The document shows different styles of fishbone diagrams that can be used in PowerPoint presentations. The fishbone diagrams have branches extending from a central topic to various causes or factors. Placeholder text or examples are included throughout the diagrams. Instructions are provided at the bottom on how to individually edit objects by ungrouping them and changing features like color, size, and orientation. The diagrams are fully editable and customizable for presentations.
The document shows different styles of fishbone diagrams that can be used in PowerPoint presentations. The fishbone diagrams have branches extending from a central topic to various causes or factors. Placeholder text or examples are included throughout the diagrams. Instructions are provided at the bottom on how to individually edit objects by ungrouping them and changing features like color, size or orientation. The diagrams provide templates that can be customized for root cause analysis or other topics involving multiple interconnected factors or ideas.
The document provides examples of different styles of fishbone diagrams that can be used for root cause analysis. The fishbone diagrams show potential causes branching off from a central topic in a graphical format. Key elements include placing text in various sections of the diagram to describe the topic, potential causes, and examples. The diagrams are fully editable and customizable in PowerPoint, allowing the color, size, and orientation of icons to be changed. Individual objects can be ungrouped and formatted separately.
How to make create geneology family tree powerpoint presentation slides and p...SlideTeam.net
The document appears to be a template for creating a family tree, with placeholders for adding names and relationships. Text blocks are laid out with labels for family members, and lines connect the blocks presumably to represent family connections. The template includes many empty text blocks and lines that could be populated with specific family member names and details to build out a custom family tree.
Family tree powerpoint presentation templatesSlideTeam.net
The document describes a family tree template that can be used to visually map out familial relationships. It includes boxes and lines that can be customized with text to input names and connections between family members. The template comes with the option to add photos or other graphics to represent individuals within the family tree.
Family tree powerpoint presentation slides ppt templatesSlideTeam.net
The document contains instructions for customizing a family tree chart. It describes how to:
1. Ungroup objects to edit them individually.
2. Change the color of boxes, leaves, and trees by right clicking to select format options.
3. Add or remove boxes by selecting them and using delete or cut, then adjusting connecting lines.
Series of value chain powerpoint diagrame templates 0712SlideTeam.net
The document appears to be a series of slides containing text boxes with placeholder text. The slides demonstrate how to edit and format objects in PowerPoint. Key points:
- Slides show various arrangements of text boxes with generic text like "your text here" to represent editable objects.
- Instructions are provided on how to ungroup objects, select individual elements, and change colors and formatting.
- Editing options covered include ungrouping stacked objects, selecting shapes, right clicking for format options, and changing fill colors from the format shape menu.
The document provides a visual guide for basic PowerPoint editing tasks like ungrouping, selecting, and changing colors of objects on slides.
The document is a circular notice regarding clustering. It contains repetitive text blocks arranged in a circular layout with the company logo in the center. The text blocks encourage recipients to add their own text throughout.
Four overlay round frames powerpoint diagrame templates 0712SlideTeam.net
The document describes how to edit PowerPoint slides containing overlay round frames. It includes instructions on changing the color, size, and orientation of icons; ungrouping objects; and editing colors. The overall purpose is to demonstrate how to customize round frame diagrams for presentations.
10 stages sequence of process in step by-step format organization chart power...SlideTeam.net
The document describes a step-by-step process for formatting objects in PowerPoint. It includes instructions for ungrouping objects, editing colors, and changing colors using built-in theme colors. The steps involve right clicking objects, selecting format options, and choosing fill colors or built-in theme colors.
Ppt 3d arrow action in process diagram business power point templatesSlideTeam.net
The document describes how to edit 3D arrow diagrams created in PowerPoint. All images are fully editable and customizations like changing color, size, orientation and ungrouping objects are possible. Colors can be changed by selecting the shape and choosing format options or using built-in theme colors from the design tab.
The document discusses clustering 2D objects into groups. Text objects are arranged on a slide and clustered together based on their proximity. The clusters are labeled A, B, C, etc. Additional slides show more complex arrangements of text objects clustered in different configurations.
How to make create fishbone design 2 powerpoint presentation slides and ppt t...SlideTeam.net
The document shows different styles of fishbone diagrams that can be used in PowerPoint presentations. The fishbone diagrams have branches extending from a central topic to various causes or factors. Placeholder text or examples are included throughout the diagrams. Instructions are provided at the bottom on how to individually edit objects by ungrouping them and changing features like color, size, and orientation. The diagrams are fully editable and customizable for presentations.
The document contains instructions for vertically clustering text boxes with the same text in a repeating pattern on a slide. The text boxes are arranged on the left and right sides with some in the center in a symmetrical formation. The text in each box reads "Your Text Goes here. Put your text here." and is meant to be replaced by the user. At the bottom, instructions are provided for editing the text within the boxes.
The document contains instructions for vertically clustering text boxes in a slide presentation. The text boxes can be moved and rearranged flexibly with text placed in different boxes. Logos and branding can also be added at the bottom of slides.
The document discusses clustering text vertically. It contains multiple sections of text clustered together in vertical columns with logos placed throughout.
The document discusses clustering text horizontally across multiple pages. Sections of text are arranged from left to right in rows and columns with logos placed at the bottom of each page. The text blocks can be edited and rearranged by ungrouping the objects and dragging them. Color and formatting of the text blocks can also be customized.
The document contains a circular diagram with text placed in circular patterns around the center. The text repeats and is organized into symmetrical circular clusters. A website URL is provided at the bottom.
The document contains a circular diagram with text placed in circular clusters around the edges and center. The text is repeated and organized into a symmetrical circular pattern. A website URL is provided at the bottom.
The document contains instructions for clustering text horizontally across multiple slides in a presentation. Key points include:
- Text can be clustered horizontally across slides by placing text in various positions on each slide
- The same text is repeated in the same relative positions on every slide to create a horizontal flow
- Logos and branding are included at the bottom of each slide to maintain consistency
The document demonstrates how to horizontally cluster text boxes in a slide presentation. Multiple text boxes are arranged from left to right across the slide with overlapping text that can be edited. The clustered text boxes are intended to allow customization of text in multiple locations simultaneously.
The document contains templates for timeline graphs spanning various years divided into monthly intervals. The templates include labels for the x-axis years/months and y-axis values (if applicable). They also include placeholder text and formatting for additional details about the data being visualized over time.
The document contains templates for timeline graphs that span different time periods from 4 to 12 years displayed monthly. Each template includes text boxes labeled for months/years along the x-axis and y-axis for variables being measured over time. The templates can be customized with descriptive text and variable values for specific timelines.
Similar to Fishbone style design 1 powerpoint ppt slides. (14)
Business powerpoint presentations process diagram six decisions cycle flow ch...SlideTeam.net
The document describes how to edit and customize a business process diagram template in PowerPoint. It includes 6 steps represented by diverging arrows. At each step, text or images can be added and modified. All images are fully editable in terms of color, size, orientation, and other properties using the formatting and drawing tools in PowerPoint. This allows the template to be customized while maintaining a consistent visual structure.
Powerpoint presentations process management solution cycle flow network templ...SlideTeam.net
The document describes a 7 step converging arrows business process management solution. It includes 7 steps represented by arrows that converge on a central text box. All images are 100% editable in PowerPoint and allow the user to change color, size, orientation or any icon to their liking. The document also provides instructions on how to ungroup objects and edit their color using theme colors or by selecting fill and solid options.
Group of nine coverging arrows circular layout process power point slidesSlideTeam.net
The document describes how to edit a group of nine converging arrows diagram in PowerPoint. It includes instructions on ungrouping the object, editing the color, and editing the color by theme colors. The diagram can be customized by changing the color, size, and orientation of any icon. All images are fully editable in PowerPoint.
Four leading reason for cause cycle process diagram power point slidesSlideTeam.net
The document discusses editing images in PowerPoint. It provides instructions on how to ungroup objects, edit colors, and change colors using theme colors. The key steps are to right click objects to ungroup or access formatting options, select fill and color options to change the appearance, and choose from built-in theme colors.
To good world business powerpoint templates ideas processs andSlideTeam.net
The document contains instructions for editing business diagram images in PowerPoint. It explains how to ungroup objects, edit colors, and change colors using built-in theme colors. The purpose is to allow users to customize diagram images for business presentations.
Three converging arrows managing process layout cycle network power point slidesSlideTeam.net
The document describes how to edit icons in a PowerPoint presentation. It provides instructions on ungrouping objects, changing colors, and using theme colors. The steps include right clicking objects, choosing format options, and selecting fill and color options. The overall purpose is to demonstrate how to customize icons and make images fully editable.
Six coverging arrows for process to carried out charts and power point slidesSlideTeam.net
The document describes how to edit a diagram template with six converging arrows. Key points:
- The template can be used to bring presentations to life and capture audiences' attention.
- All images are 100% editable in PowerPoint, allowing the user to change color, size, and orientation of any icon.
- To ungroup objects, right click, select "Ungroup", and drag the selection arrow over parts to edit individually.
- To change an object's color, right click it, select "Format Shape", and choose a "Fill" color or gradient from the options provided. Colors can also be changed using the built-in theme colors.
Powerpoint presentations process management solution cycle flow network templ...SlideTeam.net
The document describes a 7 step converging arrows business process management solution. It includes 7 steps represented by arrows that converge on a central text box. All images are 100% editable in PowerPoint and allow the user to change color, size, orientation or any icon to their liking. The document also provides instructions on how to ungroup objects and edit their color using theme colors or by selecting fill and solid options.
Diverging arrows pointing specific directions processs and power point templatesSlideTeam.net
The document shows a diagram with diverging arrows pointing in different directions. The arrows can be edited in PowerPoint by ungrouping the object, changing the color using the format shape option or theme colors, and dragging the arrow to change its orientation. The diagram brings presentations to life and captures audiences' attention. It is fully editable and customizable in PowerPoint.
Templates process diagram with diverging arrows circular layout power point s...SlideTeam.net
The document is an illustration of a business process diagram with diverging arrows. It shows a process splitting into multiple parallel processes represented by arrows branching in different directions. All images in the diagram are fully editable in PowerPoint and can be modified by changing properties like color, size, and orientation. The document provides instructions on how to perform actions like ungrouping objects and editing colors using options in the PowerPoint interface.
Steps layout with converging arrows pointing to center cycle process power po...SlideTeam.net
The document describes how to edit icons in a PowerPoint presentation. It provides instructions for ungrouping objects, editing colors, and changing colors using built-in theme colors. The steps allow presenters to customize icons by changing their size, orientation, and colors to suit their liking.
Seven factors arrow pointing business process charts and power point slidesSlideTeam.net
The document appears to be a template for a diagram or presentation with 7 factors pointing to a central business process. The template includes placeholder text and images that can be customized. It is meant to bring presentations to life and capture audience attention. All elements are editable in PowerPoint.
Diverging arrows pointing different directions circular motion network power ...SlideTeam.net
The document shows a diagram template with diverging arrows pointing in different directions. The template can be customized with text in 8 boxes to bring presentations to life and capture audience attention. The images are fully editable in PowerPoint.
Diverging arrow process project activity diagram cycle power point slidesSlideTeam.net
The document describes a diverging arrow process project activity diagram. It includes steps numbered 1 through 5 with arrows connecting each step. Text placeholders throughout suggest editing the text to describe your own process. The document encourages downloading the diagram and editing it in PowerPoint to bring your own presentation to life and capture your audience's attention. It specifies that all images are 100% editable in terms of color, size, orientation, and text.
Diverging arrow pointing strategic planning process arrows network software p...SlideTeam.net
The document describes a diverging arrow diagram for strategic planning. It includes 11 points labeled 1 through 11 with arrows pointing in different directions. Below the diagram are bullet points describing how the diagram can be used to bring presentations to life, capture audiences' attention, and is fully editable in PowerPoint by changing colors, sizes, orientations of icons, ungrouping objects, and editing colors using theme colors. The document provides instructions for customizing a diverging arrow diagram template for strategic planning presentations.
Diverging arrows graphical view of different aspects cycle flow chart power p...SlideTeam.net
The document describes how to edit and customize diverging arrow diagrams created in PowerPoint. It includes 6 arrows branching from a central point and labeled text boxes that can be edited. The summary provides instructions on how to:
1. Ungroup individual elements to edit them separately.
2. Change colors by right clicking, selecting format shape, and choosing a solid or gradient fill color.
3. Change colors using built-in theme colors under the Design tab.
Diverging arrow pointing strategic planning process arrows network software p...SlideTeam.net
The document describes a diverging arrow diagram for strategic planning. It includes placeholders for text and logos. The diagram has 11 points connected by arrows and can be edited in PowerPoint. It is meant to help presentations and capture audience attention.
Business powerpoint presentations process diagram six decisions cycle flow ch...SlideTeam.net
The document shows a diverging arrows business process diagram with 6 decision points. The diagram can be edited in PowerPoint by changing the text, ungrouping objects to edit individual parts, and changing colors. All images are fully editable and the diagram is meant to capture audience attention and bring presentations to life.
Business powerpoint templates download process diagram cycleSlideTeam.net
The document is a 9 step converging arrows business process diagram template that allows users to customize each step with text and download the finished diagram. It provides an editable template to create a process flow chart for presentations.
Arrow diagram shows required order of tasks arrows software power point templ...SlideTeam.net
The document describes how to edit an arrow diagram in PowerPoint. It outlines the following steps:
1. Ungroup the object by right clicking, selecting group, and then ungroup to edit individual elements.
2. Edit the color of shapes by right clicking, selecting format shape, and choosing a solid or gradient fill color from the options.
3. Alternatively, colors can be changed by selecting a shape and choosing from the built-in theme colors in the design tab.
leewayhertz.com-AI in predictive maintenance Use cases technologies benefits ...alexjohnson7307
Predictive maintenance is a proactive approach that anticipates equipment failures before they happen. At the forefront of this innovative strategy is Artificial Intelligence (AI), which brings unprecedented precision and efficiency. AI in predictive maintenance is transforming industries by reducing downtime, minimizing costs, and enhancing productivity.
Ocean lotus Threat actors project by John Sitima 2024 (1).pptxSitimaJohn
Ocean Lotus cyber threat actors represent a sophisticated, persistent, and politically motivated group that poses a significant risk to organizations and individuals in the Southeast Asian region. Their continuous evolution and adaptability underscore the need for robust cybersecurity measures and international cooperation to identify and mitigate the threats posed by such advanced persistent threat groups.
Trusted Execution Environment for Decentralized Process MiningLucaBarbaro3
Presentation of the paper "Trusted Execution Environment for Decentralized Process Mining" given during the CAiSE 2024 Conference in Cyprus on June 7, 2024.
Best 20 SEO Techniques To Improve Website Visibility In SERPPixlogix Infotech
Boost your website's visibility with proven SEO techniques! Our latest blog dives into essential strategies to enhance your online presence, increase traffic, and rank higher on search engines. From keyword optimization to quality content creation, learn how to make your site stand out in the crowded digital landscape. Discover actionable tips and expert insights to elevate your SEO game.
Your One-Stop Shop for Python Success: Top 10 US Python Development Providersakankshawande
Simplify your search for a reliable Python development partner! This list presents the top 10 trusted US providers offering comprehensive Python development services, ensuring your project's success from conception to completion.
This presentation provides valuable insights into effective cost-saving techniques on AWS. Learn how to optimize your AWS resources by rightsizing, increasing elasticity, picking the right storage class, and choosing the best pricing model. Additionally, discover essential governance mechanisms to ensure continuous cost efficiency. Whether you are new to AWS or an experienced user, this presentation provides clear and practical tips to help you reduce your cloud costs and get the most out of your budget.
HCL Notes and Domino License Cost Reduction in the World of DLAUpanagenda
Webinar Recording: https://www.panagenda.com/webinars/hcl-notes-and-domino-license-cost-reduction-in-the-world-of-dlau/
The introduction of DLAU and the CCB & CCX licensing model caused quite a stir in the HCL community. As a Notes and Domino customer, you may have faced challenges with unexpected user counts and license costs. You probably have questions on how this new licensing approach works and how to benefit from it. Most importantly, you likely have budget constraints and want to save money where possible. Don’t worry, we can help with all of this!
We’ll show you how to fix common misconfigurations that cause higher-than-expected user counts, and how to identify accounts which you can deactivate to save money. There are also frequent patterns that can cause unnecessary cost, like using a person document instead of a mail-in for shared mailboxes. We’ll provide examples and solutions for those as well. And naturally we’ll explain the new licensing model.
Join HCL Ambassador Marc Thomas in this webinar with a special guest appearance from Franz Walder. It will give you the tools and know-how to stay on top of what is going on with Domino licensing. You will be able lower your cost through an optimized configuration and keep it low going forward.
These topics will be covered
- Reducing license cost by finding and fixing misconfigurations and superfluous accounts
- How do CCB and CCX licenses really work?
- Understanding the DLAU tool and how to best utilize it
- Tips for common problem areas, like team mailboxes, functional/test users, etc
- Practical examples and best practices to implement right away
In the rapidly evolving landscape of technologies, XML continues to play a vital role in structuring, storing, and transporting data across diverse systems. The recent advancements in artificial intelligence (AI) present new methodologies for enhancing XML development workflows, introducing efficiency, automation, and intelligent capabilities. This presentation will outline the scope and perspective of utilizing AI in XML development. The potential benefits and the possible pitfalls will be highlighted, providing a balanced view of the subject.
We will explore the capabilities of AI in understanding XML markup languages and autonomously creating structured XML content. Additionally, we will examine the capacity of AI to enrich plain text with appropriate XML markup. Practical examples and methodological guidelines will be provided to elucidate how AI can be effectively prompted to interpret and generate accurate XML markup.
Further emphasis will be placed on the role of AI in developing XSLT, or schemas such as XSD and Schematron. We will address the techniques and strategies adopted to create prompts for generating code, explaining code, or refactoring the code, and the results achieved.
The discussion will extend to how AI can be used to transform XML content. In particular, the focus will be on the use of AI XPath extension functions in XSLT, Schematron, Schematron Quick Fixes, or for XML content refactoring.
The presentation aims to deliver a comprehensive overview of AI usage in XML development, providing attendees with the necessary knowledge to make informed decisions. Whether you’re at the early stages of adopting AI or considering integrating it in advanced XML development, this presentation will cover all levels of expertise.
By highlighting the potential advantages and challenges of integrating AI with XML development tools and languages, the presentation seeks to inspire thoughtful conversation around the future of XML development. We’ll not only delve into the technical aspects of AI-powered XML development but also discuss practical implications and possible future directions.
Letter and Document Automation for Bonterra Impact Management (fka Social Sol...Jeffrey Haguewood
Sidekick Solutions uses Bonterra Impact Management (fka Social Solutions Apricot) and automation solutions to integrate data for business workflows.
We believe integration and automation are essential to user experience and the promise of efficient work through technology. Automation is the critical ingredient to realizing that full vision. We develop integration products and services for Bonterra Case Management software to support the deployment of automations for a variety of use cases.
This video focuses on automated letter generation for Bonterra Impact Management using Google Workspace or Microsoft 365.
Interested in deploying letter generation automations for Bonterra Impact Management? Contact us at sales@sidekicksolutionsllc.com to discuss next steps.
Let's Integrate MuleSoft RPA, COMPOSER, APM with AWS IDP along with Slackshyamraj55
Discover the seamless integration of RPA (Robotic Process Automation), COMPOSER, and APM with AWS IDP enhanced with Slack notifications. Explore how these technologies converge to streamline workflows, optimize performance, and ensure secure access, all while leveraging the power of AWS IDP and real-time communication via Slack notifications.
Skybuffer SAM4U tool for SAP license adoptionTatiana Kojar
Manage and optimize your license adoption and consumption with SAM4U, an SAP free customer software asset management tool.
SAM4U, an SAP complimentary software asset management tool for customers, delivers a detailed and well-structured overview of license inventory and usage with a user-friendly interface. We offer a hosted, cost-effective, and performance-optimized SAM4U setup in the Skybuffer Cloud environment. You retain ownership of the system and data, while we manage the ABAP 7.58 infrastructure, ensuring fixed Total Cost of Ownership (TCO) and exceptional services through the SAP Fiori interface.
Monitoring and Managing Anomaly Detection on OpenShift.pdfTosin Akinosho
Monitoring and Managing Anomaly Detection on OpenShift
Overview
Dive into the world of anomaly detection on edge devices with our comprehensive hands-on tutorial. This SlideShare presentation will guide you through the entire process, from data collection and model training to edge deployment and real-time monitoring. Perfect for those looking to implement robust anomaly detection systems on resource-constrained IoT/edge devices.
Key Topics Covered
1. Introduction to Anomaly Detection
- Understand the fundamentals of anomaly detection and its importance in identifying unusual behavior or failures in systems.
2. Understanding Edge (IoT)
- Learn about edge computing and IoT, and how they enable real-time data processing and decision-making at the source.
3. What is ArgoCD?
- Discover ArgoCD, a declarative, GitOps continuous delivery tool for Kubernetes, and its role in deploying applications on edge devices.
4. Deployment Using ArgoCD for Edge Devices
- Step-by-step guide on deploying anomaly detection models on edge devices using ArgoCD.
5. Introduction to Apache Kafka and S3
- Explore Apache Kafka for real-time data streaming and Amazon S3 for scalable storage solutions.
6. Viewing Kafka Messages in the Data Lake
- Learn how to view and analyze Kafka messages stored in a data lake for better insights.
7. What is Prometheus?
- Get to know Prometheus, an open-source monitoring and alerting toolkit, and its application in monitoring edge devices.
8. Monitoring Application Metrics with Prometheus
- Detailed instructions on setting up Prometheus to monitor the performance and health of your anomaly detection system.
9. What is Camel K?
- Introduction to Camel K, a lightweight integration framework built on Apache Camel, designed for Kubernetes.
10. Configuring Camel K Integrations for Data Pipelines
- Learn how to configure Camel K for seamless data pipeline integrations in your anomaly detection workflow.
11. What is a Jupyter Notebook?
- Overview of Jupyter Notebooks, an open-source web application for creating and sharing documents with live code, equations, visualizations, and narrative text.
12. Jupyter Notebooks with Code Examples
- Hands-on examples and code snippets in Jupyter Notebooks to help you implement and test anomaly detection models.
Taking AI to the Next Level in Manufacturing.pdfssuserfac0301
Read Taking AI to the Next Level in Manufacturing to gain insights on AI adoption in the manufacturing industry, such as:
1. How quickly AI is being implemented in manufacturing.
2. Which barriers stand in the way of AI adoption.
3. How data quality and governance form the backbone of AI.
4. Organizational processes and structures that may inhibit effective AI adoption.
6. Ideas and approaches to help build your organization's AI strategy.
Nunit vs XUnit vs MSTest Differences Between These Unit Testing Frameworks.pdfflufftailshop
When it comes to unit testing in the .NET ecosystem, developers have a wide range of options available. Among the most popular choices are NUnit, XUnit, and MSTest. These unit testing frameworks provide essential tools and features to help ensure the quality and reliability of code. However, understanding the differences between these frameworks is crucial for selecting the most suitable one for your projects.
Nunit vs XUnit vs MSTest Differences Between These Unit Testing Frameworks.pdf
Fishbone style design 1 powerpoint ppt slides.
1. FISHBONE – Style 1
Your text Your text Your text
goes here goes here goes here
Your text Your text Your text
goes here goes here goes here
Put text here Your text goes here
Your text goes here
Your text goes here. Put text here Put text here
Put text here
Your text
goes here
Put text here Your text goes here
Your text goes here
Your text goes here. Put text here Put text here
Put text here
Your text Your text Your text
goes here goes here goes here
Your text Your text Your text
goes here goes here goes here
www.slideteam.net Your Logo
2. FISHBONE – Style 1
Your text Your text Your text
goes here goes here goes here Your text
goes here
Put text here Your text goes here
Your text goes here
Your text goes here. Put text here Put text here
Put text here
Put text here Your text goes here
Your text goes here
Your text goes here. Put text here Put text here
Put text here
Your text Your text Your text
goes here goes here goes here
www.slideteam.net Your Logo
3. FISHBONE – Style 1
Your text Your text
goes here goes here
Put text here
Put text here Put text here Your text goes here.
Put text here
Put text here Put text here
Example text Example text Example text
Your text goes here. Your text goes here.
Put text here Put text here
Your text
goes here
Your text goes here. Your text goes here.
Put text here Put text here
Example text Example text Put text here
Put text here Put text here
Your text goes here.
Put text here Put text here Put text here
Example text
Your text Your text
goes here goes here
www.slideteam.net Your Logo
4. FISHBONE – Style 1
Your text Your text Your text
goes here goes here goes here
Put text here Put text here Put text here
Example text Example text
Example text
Your text goes here. Your text goes here.
Put text here Put text here
Your text goes here.
Put text here Example text
Your text
goes here
Put text here
Example text Put text here
Example text
Example text
Your text goes here. Put text here
Put text here Example text
Your text goes here. Your text goes here.
Put text here Put text here
Your text Your text Your text
goes here goes here goes here
www.slideteam.net Your Logo
5. FISHBONE – Style 1
Put text here Your text goes here
Your text goes here
Your text goes here Put text here
Put text here
Your text
Put text here
goes here
Your text goes here
Put text here
Your text goes here
Put text here
Your text goes here
Put text here
www.slideteam.net Your Logo
6. FISHBONE – Style 1
Your text Your text Your text Your text
goes here goes here goes here goes here
Put text here Put text here Put text here Put text here
Your text goes here Example Text Your text goes here Put text here
Example Text Example Text Put text here Your text goes here
Text Your text
goes here
Example Text Example Text Put text here Your text goes here
Your text goes here Example Text Your text goes here Put text here
Put text here Put text here Put text here Put text here
Your text Your text Your text Your text
goes here goes here goes here goes here
www.slideteam.net Your Logo
7. FISHBONE – Style 1
Your text Your text Your text Your text
goes here goes here goes here goes here
Put text here Put text here Put text here Put text here
Your text goes here Example Text Your text goes here Put text here
Example Text Example Text Put text here Your text goes here
Text Your text
goes here
Example Text Example Text Put text here Your text goes here
Your text goes here Example Text Your text goes here Put text here
Put text here Put text here Put text here Put text here
Your text Your text Your text Your text
goes here goes here goes here goes here
www.slideteam.net Your Logo
8. FISHBONE – Style 1
Your text Your text Your text
goes here goes here goes here
Put text here Your text goes here
Your text goes here
Your text goes here. Put text here Put text here
Put text here
Your text
Put text here
goes here
Your text goes here
Put text here
Your text goes here
Put text here
Your text goes here. Put text here
Put text here
Your text Your text Your text
goes here goes here goes here
www.slideteam.net Your Logo
9. FISHBONE – Style 1
Your text Your text Your text
goes here goes here goes here
Put text here Put text here Put text here
Example text Example text
Example text
Your text goes here. Your text goes here.
Put text here Put text here
Your text goes here.
Put text here Example text
Your text
goes
here
Put text here
Example text Put text here
Example text
Example text
Your text goes here. Put text here
Put text here Example text
Your text goes here. Your text goes here.
Put text here Put text here
Your text Your text Your text
goes here goes here goes here
www.slideteam.net Your Logo
10. FISHBONE – Style 1
Your text Your text Your text
goes here goes here goes here
Your text Your text Your text
goes here goes here goes here
Put text here Your text goes here
Your text goes here
Your text goes here. Put text here Put text here
Put text here
Your text
goes here
Put text here Your text goes here
Your text goes here
Your text goes here. Put text here Put text here
Put text here
Your text Your text Your text
goes here goes here goes here
Your text Your text Your text
goes here goes here goes here
www.slideteam.net Your Logo
11. FISHBONE – Style 1
Your text Your text Your text Your text
goes here goes here goes here goes here
Put text here Put text here Put text here Put text here
Your text goes here Example Text Your text goes here Put text here
Example Text Example Text Put text here Your text goes here
Text Your text
goes here
Example Text Example Text Put text here Your text goes here
Your text goes here Example Text Your text goes here Put text here
Put text here Put text here Put text here Put text here
Your text Your text Your text Your text
goes here goes here goes here goes here
www.slideteam.net Your Logo
12. FISHBONE – Style 1
Your text Your text Your text Your text
goes here goes here goes here goes here
Put text here Put text here Put text here Put text here
Your text goes here Example Text Your text goes here Put text here
Example Text Example Text Put text here Your text goes here
Text Your text
goes here
Example Text Example Text Put text here Your text goes here
Your text goes here Example Text Your text goes here Put text here
Put text here Put text here Put text here Put text here
Your text Your text Your text Your text
goes here goes here goes here goes here
www.slideteam.net Your Logo
13. All images are 100% editable in Powerpoint
“Change color, size and orientation of any icon to your liking”
www.slideteam.net
14. Ungrouping the object
2
1
3
1. Right click the object.
2. Choose Group and then Ungroup.
3. Click beside the object and drag the arrow over it.
www.slideteam.net
15. Edit Color
2 3
1
1. Right click the object
2. Choose Format Shape in the dialog box
3. Choose “Fill” in the Format Shape box then “Solid” or “Gradient”
depending on the appearance of the object. Change colour as
shown in the picture.
www.slideteam.net