This document provides a summary of Pakistan's third quarter fiscal report for FY06. Key points include:
1) Fiscal indicators like the budget deficit, revenue balance, and primary balance weakened in FY06, though adjusting for earthquake relief spending, the fiscal picture improves somewhat with surpluses returning.
2) Total revenues reached Rs. 1095.6 billion in FY06, up 21.7% driven by growth in both tax and non-tax revenues. Tax revenues grew 22.2% led by sales tax, excise, and surcharges.
3) Total expenditures were Rs. 1423 billion, up 27.4% led by a 43.5% growth in
Embraer released its third quarter 2010 results according to US GAAP standards. Key highlights include:
- Net sales of $1.042 billion for the quarter from 44 jet deliveries. Gross margin was 22.1% due to productivity gains.
- EBIT margin was 6.0% for the quarter and 7.3% year-to-date, above guidance. Net income was $98.5 million for the quarter.
- Firm order backlog remained stable at $15.3 billion. Net cash position was $623.8 million for the quarter. Guidance for 2010 was revised upward.
The document summarizes a company's fiscal 2007 third quarter financial results conference call. It provides details on the company's net loss, loss per share, and income/loss by segment for the third quarter. It also reviews key drivers of financial performance such as increased utility throughput, rate adjustments, higher operation and maintenance expenses, and capital expenditures. Financial results for the year-to-date period through the third quarter are also presented.
Burlington Northern Santa Fe reported third quarter 2003 earnings of $0.55 per share, an 8% increase over third quarter 2002 earnings of $0.51 per share. Freight revenues increased 4% to a record $2.37 billion due to strong volumes in consumer products and industrial products. Operating expenses increased 4% due to a 21% rise in fuel costs. Operating income rose 3% to $430 million and the operating ratio was 81.8% compared to 81.6% in the prior year.
This document provides an overview and financial highlights of TRC Companies Inc.'s performance in the first quarter of fiscal year 2016. Some key points:
- Net service revenue increased 8% year-over-year to $100.2 million, with growth across all segments.
- Operating income increased 28% to $7.7 million and EBITDA increased 20% to $9.9 million.
- Net income increased 29% to $4.5 million and backlog increased 23% to $319 million.
- The environmental segment saw 11% revenue growth, while the energy and infrastructure segments grew revenues by 5% and 9% respectively.
- Segment profits increased in energy and
Progress Energy reported third quarter 2004 ongoing earnings of $1.01 per share compared to $1.28 per share in the third quarter of 2003. GAAP earnings were $1.25 per share compared to $1.33 per share. Earnings from core utility businesses were strong but offset by lower synthetic fuel production tax credits. Hurricane damage restoration costs totaled $379 million. Progress Energy reaffirmed 2004 ongoing earnings guidance of $2.95 to $3.10 per share and announced developments in an IRS audit of synthetic fuel tax credits.
DuPont reported a 15% increase in earnings per share for the first quarter of 2007 compared to the same period in 2006. Sales grew 6% due to a 2% increase in local currency prices, 2% higher volumes, and a 2% benefit from currency exchange. DuPont reaffirmed its full year 2007 earnings outlook of approximately $3.15 per share, excluding significant items.
SCE filed its 2018 General Rate Case application in September 2016 requesting a revenue requirement increase of 2.7% in 2018 over presently authorized rates to fund ongoing infrastructure investment and initial grid modernization projects. Key items in the 2018 GRC include $2.1 billion for grid modernization capital and increased depreciation expense to reflect updated cost removal estimates. The rate case schedule includes intervenor testimony in early 2017, evidentiary hearings in mid-2017, and a proposed decision by late 2017.
Embraer reported financial results for the second quarter of 2002 in accordance with US GAAP. Net sales for the quarter were $589.7 million, a 5.8% increase over the previous quarter but a 28.4% decrease from the second quarter of 2001. EBITDA for the quarter was $134.1 million, a 23.6% increase over the previous quarter, and net income was $36.8 million. A total of 30 jets were delivered during the quarter to commercial and corporate aviation markets. The order backlog remained strong at $23.8 billion comprising $10.1 billion in firm orders and $13.7 million in options.
This document provides an annual investors' report for Burlington Northern Santa Fe Corporation for 2002. It includes:
1) Key financial highlights for Q4 2002 including $0.54 earnings per share, $2.27 billion in freight revenues, and $436 million in operating income.
2) Annual 2002 results including $2.00 earnings per share, $8.87 billion in freight revenues, and $1.66 billion in operating income.
3) Details of common stock repurchases totaling approximately 116 million shares under their repurchase program.
Burlington Northern Santa Fe reported earnings of $0.54 per share for the second quarter of 2003, up slightly from $0.51 per share in the second quarter of 2002. Freight revenues increased 3.7% to $2.26 billion due to a 4.6% rise in shipments handled. However, operating income was flat at $412 million as fuel expenses increased $56 million compared to the previous year. The company also repurchased 2 million shares during the quarter as part of its share buyback program.
1) Burlington Northern Santa Fe Corporation reported earnings of $0.40 per share for the first quarter of 2003, before a cumulative effect adjustment of $0.10 per share for a change in accounting principle.
2) Freight revenues increased 3% to $2.2 billion compared to the first quarter of 2002, while operating expenses rose $103 million to $1.89 billion due to a $90 million increase in fuel costs.
3) Operating income was $346 million for the quarter, down from $380 million in the prior year due to higher fuel costs, and the operating ratio rose to 84.3% from 82.2% in 2002.
Rexnord Corporation (RXN) Q3 Fiscal Year 2019 Financial ResultsRexnord
This presentation and discussion contains certain forward-looking statements that are subject to the Safe Harbor and Cautionary language contained in the press release we issued on January 30, 2019, as well as other factors that could cause actual results to differ materially from those discussed and that are disclosed in ourfilingswiththeSecuritiesandExchangeCommission.
Some comparisons will refer to certain non-GAAP measures. Our earnings release and SEC filings contain additional information about these non-GAAP measures, why we use them and why we believe they are helpful to investors, and contain reconciliationstoGAAPdata.
To view this presentation - or any of our previously published financial quarter presentations - please visit https://investors.rexnordcorporation.com/events-and-presentations/presentations/default.aspx
This document provides a comparison of independent forecasts for the UK economy in 2010 and 2011. It includes tables summarizing forecasts from 20 financial institutions for key indicators such as GDP growth, inflation, unemployment, and government borrowing. The tables show averages and ranges for each indicator based on forecasts made over the past 3 months, as well as averages specifically for the new forecasts received this month.
Monthly statistical e-bulletin comprising about 30 tables and some charts with the latest available economic/financial market indicators, both Indian and Global.
U.S. Bancorp reported record net income for the second quarter of 2005 of $1.121 billion, an 8.1% increase from the second quarter of 2004. Key factors contributing to increased earnings included strong growth in fee-based revenue across most categories, lower credit costs, and reduced tax expenses. However, net interest income declined slightly due to margin compression from tighter credit spreads and changes in asset/liability management. Overall, the results demonstrated continued strong performance and returns, with loan growth, improving credit quality, and investments positioned to further enhance the business.
Progress Energy reported third quarter ongoing earnings of $1.28 per share and year-to-date ongoing earnings of $2.74 per share. Earnings were lowered due to unfavorable weather and a slow economic recovery, prompting a reduction in 2003 earnings guidance to $3.50 to $3.60 per share. Additionally, the IRS rejected challenges to Progress Energy's Colona synthetic fuels facility, bringing the tax audit closer to resolution. Progress Energy also announced several asset sales and operational updates across its business segments.
u.s.bancorp1Q 2003 Earnings Release and Supplemental Analyst Schedulesfinance13
U.S. Bancorp reported a 20.5% increase in net income for the first quarter of 2003 compared to the same period in 2002. Net income was $911.2 million for Q1 2003, up from $756.0 million in Q1 2002. Earnings per share increased 20.5% to $0.47. Total net revenue grew 10.1% to $3.3 billion due to increases in net interest income, gains on securities sales, and growth in consumer banking and payment services revenue. Noninterest expense rose 9.1% to $1.6 billion, reflecting a mortgage servicing rights impairment of $120.9 million in Q1 2003.
DuPont reported strong earnings growth in the fourth quarter and full year of 2006. Fourth quarter earnings were $0.94 per share compared to $0.16 per share in the fourth quarter of 2005. For the full year, earnings were $3.38 per share compared to $2.07 in 2005. Sales grew 8% in the fourth quarter driven by 4% higher volumes, 2% higher prices and 2% currency benefits. Several business segments saw improved results, with Agriculture & Nutrition seeing a 129% increase in pretax operating income when excluding restructuring charges. For 2007, DuPont expects earnings of $3.15 per share, with modest sales growth expected to be driven by growth outside the US offsetting slower
- Sprint Nextel reported financial results for Q4 and full-year 2007, with consolidated revenues of $9.8 billion for Q4 and $40.1 billion for the year.
- A non-cash goodwill impairment charge of $29.7 billion was recorded in Q4, resulting in a net loss of $29.5 billion for the quarter.
- Wireless profitability declined in Q4 due to lower service revenues and higher expenses, though data revenues grew. Wireline profitability increased.
- The company is taking actions to increase financial flexibility, including borrowing funds and discontinuing dividend payments for the foreseeable future.
LegFin: Preliminary Overview of the Governor's FY22 Budget (1.8.2021)Brad Keithley
The document provides a preliminary overview of Alaska's structural budget deficit and the Governor's FY2022 budget proposal. It notes that Alaska has faced nine consecutive years of budget deficits due to declining oil revenue. The Governor's budget reduces spending from the current law baseline through lower agency budgets and partial funding of items like the PFD. It draws funds from the ERA to fully pay the PFD but still faces a small deficit. The 10-year plan aims to balance the budget starting in FY2023 through dividend reductions, spending cuts, and new revenue.
The document provides a summary of GM's preliminary third quarter 2008 results. It reported an adjusted net loss of $4.2 billion compared to a loss of $1.6 billion in the third quarter of 2007. Revenue declined significantly year-over-year in GM's North American and European segments due to weaker industry sales. GM also announced further actions to improve liquidity, including additional cuts to capital expenditures, structural costs, working capital, and salaried employment costs totaling $5 billion through 2009.
This document provides a five-year financial forecast for the City of San Antonio for fiscal years 2017 through 2021. It summarizes projected revenues, expenditures, and financial reserves for the General Fund, as well as the Hotel Occupancy Tax funds, Development Services Fund, and Solid Waste Operating Fund. The General Fund forecast projects modest surpluses each year and maintains reserves at 15% of revenues. Revenue growth is expected to average 2.7% annually during the forecast period. Expenditures are based on maintaining current service levels with adjustments for inflation. The forecast aims to provide early financial assessment to guide budget development and identify issues for city council.
2018 First Coast Flight Center Lease Rates AnalysisMattBocchinoAAE
This document analyzes lease rates at First Coast Flight Center (FCFC) and makes recommendations. It provides an overview of FCFC operations and the general aviation market. A survey of 13 Florida airports found FCFC's t-hangar and tie-down rates are close to average but bulk hangar rates are significantly lower than competitors. The analysis recommends increasing rates for bulk hangars and tie-downs to better align with market rates while keeping t-hangar rates largely unchanged.
The document discusses the development of fisheries in India through its five-year plans. It provides details on:
1. The allocation of funds to fisheries under each five-year plan, starting from the First Five Year Plan which allocated 2.74 crores to fisheries. Funding increased over time to reach 1.55% of total plan expenditure under the Eighth Five Year Plan.
2. The objectives and achievements of fisheries under each plan, such as introducing mechanized fishing, developing infrastructure, and raising fish production and the socio-economic conditions of fishermen.
3. Charts showing the increasing total state plan expenditure and percentage allocated to fisheries with each successive plan.
This document provides an overview and financial results for TRC Companies Inc.'s Q2 Fiscal 2015. Key points include:
- Net service revenue increased 10% year-over-year to $99.8 million.
- EBITDA increased 28% to $9.5 million and net income increased 29% to $4.0 million.
- The environmental and energy segments saw increases in net service revenue and profits while the infrastructure segment saw declines.
- The company aims to invest in organic growth and pursue strategic acquisitions to expand in key markets like oil/gas midstream.
County Executive Presentation of the FY 2013 Advertised Budget PlanFairfax County
The document summarizes the FY 2013 budget recommendations for Fairfax County. It recommends a balanced budget with limited spending increases to cover critical needs like a 2.18% pay increase for employees. No real estate tax rate increase is proposed. Fees for stormwater and some services will increase. Strategic reductions were made while retaining core services, resulting in a $10.64 million decrease in agency expenditures and a net reduction of 2 positions.
This document summarizes Direcional's 4Q11 and full year 2011 earnings release. Key highlights include:
- Net revenue grew 37% in 2011 to R$1.072 billion while cash burn decreased 38% to R$176 million.
- Launches grew 36% in 2011 to R$1.447 billion while sales increased 19% to R$1.230 billion.
- Deferred results grew 12% to R$560 million, with 77% expected to be recognized in 2012.
- Adjusted net income increased 13% to R$199 million and adjusted net margin was 18.5%.
Damen Shipyards Group is a major shipbuilding company with 32 shipyards worldwide, over 6,000 employees, and annual deliveries of 120-150 vessels. It has delivered over 5,000 vessels since 1969 and has over 150 standard hull designs. The company was founded in 1927 and has grown into a multinational group through acquisitions and expansion. Damen focuses on modular construction and standard designs to offer vessels at competitive prices with short delivery times.
Captain Jeff Slesinger has over 30 years of experience in the tugboat industry. He began his career in 1980 and worked as a full-time captain until 1998. Since then, he has taken on additional roles like training, management, and writing books. He now owns his own company, Delphi Maritime, which focuses on training and marine surveying. Slesinger uses a tugboat simulator to provide hands-on training. He trained Raina Clark, who had limited experience, on maneuvers like docking alongside a moving tanker. Slesinger explained how the tugboat industry and the role of captains have changed over the years to incorporate more safety systems and administrative duties.
This document advertises ocean-going tug boats and barges for rent or charter from an Indonesian shipping company called PT. Pelelayaran VIA DOLOROSA. They have 300ft and 330ft tug boats available to rent along with a 270ft barge. Contact information is provided to call or email the company for more information or to inquire about renting the vessels.
1. The document advertises several job openings on a tugboat traveling between Tongga and Australia, requiring Indonesian nationality and AMSA certification. Positions include Chief Mate, Chief Engineer, First Engineer, and Deck Rating.
2. The salary ranges from $1,200 to $10,500 per month depending on the position. Applicants must send their updated CV and documents to the listed email addresses, including their name and desired position in the subject line.
3. Only candidates meeting the listed qualifications and skills will be considered further. Additional details on the specifications of the technical tugboat are provided in an attached page.
Development of the Commodity AHTS Market and introducing the 'Six Eighty’M3 Marine Group
Captain John Meade talks about development of the commodity AHTS market and introduced the “6-80” (6,000 BHP 80T AHTS) design at the Offshore Support Vessel Asia Pacific Conference in Kula Lumpur Malaysia (27-28 February 2013)
The Union Budget for 2012-13 projects India's fiscal deficit to be 5.1% of GDP based on expected increases in non-tax revenue and indirect taxes. The nominal GDP growth rate is projected to be 14%, implying inflation of around 6.5%. Key measures include an increase in the income tax exemption limit and hikes in excise and service tax rates, which may dampen growth. Over the medium term, the government aims to further reduce the fiscal deficit to 4.5% of GDP by 2014-15, but fiscal consolidation is expected to remain a challenge.
The Economic Survey projects India's GDP growth to increase to 7.6% in 2012-13 and 8.6% in 2013-14, however these projections are considered ambitious. Fiscal consolidation is seen as key to achieving this level of growth. Industrial output growth remains a concern, with only a marginal recovery seen and doubts about sustainability. While exports are slowing, the global situation remains difficult and could lead to increased protectionism. Overhauling FDI policy by addressing sectoral issues is recommended to boost growth.
Presentation Material for 2Q / Mar. 2021RicohLease
This document provides an overview of Ricoh Leasing Company's financial results for the second quarter of FY2020-2021. Key points include:
1. Net sales increased but profit decreased due to higher allowance for doubtful accounts from COVID-19 impacts. Operating assets decreased from securitization of lease receivables.
2. The Leases & Finance segment saw increased gross profit but lower segment profit due to higher doubtful account provisions. The Services and Investment segments both increased sales and profits.
3. Transaction volumes declined across most product categories from COVID-19 impacts, though new contract yields continued improving. Collection agency transactions increased while factoring services were stable.
This document provides a preview of key expectations for the upcoming Indian budget. It outlines several sectors and stocks that are expected to benefit, including oil and gas stocks which may see the biggest positive impact from government policies. Specific stock picks highlighted for tactical gains over the next 8-10 months are J***D*** and H**M**, which are expected to benefit from upcoming elections and an economic recovery.
This document summarizes an academic research paper on determining future key items for trade agreements (FTAs) between Indonesia and partner countries. The research assesses Indonesia's priority economic sectors and foreign direct investment (FDI) impacts to identify opportunities. It reviews Indonesia's economic statistics and sectoral contributions to GDP. Interviews and previous FTA assessments inform the analysis to provide recommendations on negotiation items that support Indonesia's economic development goals through trade agreements.
India Fiscal Deficit Overview Quarter One ReportShujaRahman10
This report covers the overall fiscal deficit suffered by the Indian economy due to COVID19.
The report covers the comparison of previous tax receipts since 2016 and compares it on a Y-o-Y the fall and growth in this phase,upto presently available government data.
The report also five a picture of "What if" no COVID situation had happened on a rough estimate.
Fiscal deficit is the difference between government spending and revenue. India's fiscal deficit has been over 4% of GDP in recent years. It is caused by factors like high interest payments on government debt, poor performance of public sector enterprises, excessive borrowing, tax evasion, and increased subsidies. A large fiscal deficit can negatively impact economic growth.
Piaggio Group reported full year 2011 financial results, with key highlights including:
- Net sales increased 2.1% to €1.516 billion, driven by growth in emerging markets like Asia Pacific and India.
- EBITDA grew 1.7% to €200.6 million despite €17 million in restructuring costs and negative FX impact of €13 million.
- Net income increased 9.8% to €47 million due to improved EBITDA and lower tax rate, which offset higher depreciation.
- Net financial position was reduced by €14 million to €335.9 million through healthy cash flow and working capital control.
In the 6-month period ended March 31, 2014:
- Revenues exceeded budget by 4.3% but EBITDA only exceeded by 1.4% due to rising SG&A expenses. FYTD revenues were on par with budget but EBITDA was 10.9% below budget for the same reason.
- The CMS division significantly outperformed on revenues and EBITDA due to strong performance on BP North Slope contracts. However, new business revenue has not materialized for CMS.
- SG&A growth remains a concern, expected to be $1.7 million over budget by fiscal year end, reducing profitability. The analyst's forecast is more conservative than management's on profitability
ING Vyasa Bank Q2FY14 Result: Maintain neutralIndiaNotes.com
ING Vysya Bank’s (VYSB) 2QFY15 PAT was 9% above estimate at INR1.8b (+2% YoY) led by better-than-expected NIM (+10bp) and lower provisioning. Reported NIM improved 17bp QoQ to 3.54%. However, adjusted for interest reversal on account of stressed accounts in 1QFY15, NIM was stable QoQ at 3.54%.
The global financial crisis has negatively impacted the small island states of Seychelles and Mauritius. In Seychelles, tourism revenue declined sharply by 25% in 2009, exacerbating the already high public debt of 175% of GDP. Unemployment rose and inflation escalated to over 60%. In Mauritius, key sectors like tourism, textiles, and construction slowed down significantly. Real GDP growth is projected to decline to 2-2.5% in 2009. Both countries have seen reduced foreign direct investment and are discussing financial assistance from international organizations to help mitigate impacts of the global recession.
The document provides the company's 3Q09 results. It highlights that traffic grew 14.5% in 3Q09 and 16.3% in 9M09. Net revenue increased 6.9% in 3Q09 and 12.4% in 9M09. EBITDA grew 7.5% in 3Q09 to R$518.7 million with an EBITDA margin of 65.2%. The company also paid a dividend of R$1.26 per share totaling R$507.9 million in September 2009 and completed a capital increase of R$1,098.9 million through the issue of new shares.
Raytheon reported strong financial results for Q3 2006, with EPS up 41% and bookings of $6.1 billion. The company increased full-year 2006 guidance for EPS, bookings, operating cash flow and ROIC. Segments such as IDS, MS and RAC saw higher sales and improved operating performance compared to Q3 2005. Raytheon also provided initial guidance for 2007 with projected continued growth.
HSBC reported full year 2020 results. While profits were down 34% to $8.8 billion due to higher credit losses and lower revenue driven by the pandemic, the bank had a strong balance sheet. Cost savings of $1 billion were achieved through cost reduction programs. Looking forward, the bank is focused on executing its strategy of driving growth in Asia, pivoting to wealth management, and digital business services.
This document provides an earnings review conference call for Itaú Unibanco Holding S.A. for the second quarter of 2016. It includes the following key points:
- Itaú CorpBanca, resulting from the merger between Itaú Chile and CorpBanca, has been consolidated into Itaú Unibanco's financial statements. Pro forma historical data is presented for comparison.
- Recurring net income for the second quarter was R$5.6 billion, an 8.0% increase from the previous quarter. Recurring return on equity was 20.6%.
- Total credit portfolio for individuals was R$182.6 billion, a 0.9% decrease
Federal Budget FY21: A Barrier Eclipsing ReliefSCPL Capital
FY21 : Key Budgetary Targets
GDP is expected to grow 2.2% vs. -0.4% in FY20e
Inflation to clock in at 6.5% as compared to 10.9% in FY20e
PSDP allocation of 1.3trn (up 13% YoY)
Tax revenue targeted at PKR4.7trn (up ~1trn YoY)
Fiscal Deficit to stand at 7% vs. 9.1% in FY21
Third Quarter of Fiscal Year Ending March 2021 (FY2020) Financial HighlightsRicohLease
This document provides a summary of Ricoh Leasing Company's financial results for the third quarter of the 2021 fiscal year.
- Net sales and profits increased year-over-year for the 11th and 7th consecutive periods respectively, despite an allowance for doubtful accounts from COVID-19. Operating assets decreased due to securitization.
- Performance was generally positive across business segments. The investment business saw sales and profit increases from prior investments.
- Ricoh is monitoring the full-year forecast carefully due to uncertainty from the pandemic, but progress has been made towards the operating profit target so far.
1. Itaú Unibanco Holding S.A. reported its financial results for the fourth quarter and full year of 2016.
2. For 2016, net income was R$21.6 billion, down 7.6% from 2015. Recurring net income was R$22.1 billion, down 7% over the same period.
3. The presentation included comparisons of financial results from the fourth quarter of 2016 to both the third quarter of 2016 and the fourth quarter of 2015.
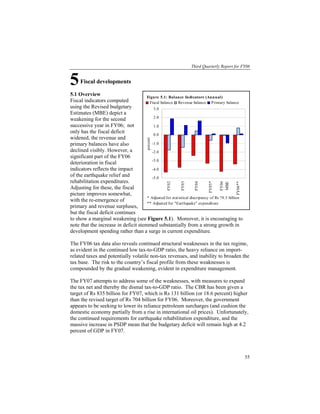
1. Third Quarterly Report for FY06
5 Fiscal developments
5.1 Overview Figure 5.1: Balance Indicators (Annual)
Fiscal indicators computed Fiscal balance Revenue balance Primary balance
using the Revised budgetary 3.0
Estimates (MBE) depict a
2.0
weakening for the second
successive year in FY06; not 1.0
only has the fiscal deficit 0.0
widened, the revenue and
percent
primary balances have also -1.0
declined visibly. However, a -2.0
significant part of the FY06
-3.0
deterioration in fiscal
indicators reflects the impact -4.0
of the earthquake relief and -5.0
rehabilitation expenditures.
FY02
FY03
FY04
FY05*
FY06
FY06**
MBE
Adjusting for these, the fiscal
picture improves somewhat,
* Adjusted for statistical discripancy of Rs 78.5 billion
with the re-emergence of
** Adjusted for "Earthquake" expenditure
primary and revenue surpluses,
but the fiscal deficit continues
to show a marginal weakening (see Figure 5.1). Moreover, it is encouraging to
note that the increase in deficit stemmed substantially from a strong growth in
development spending rather than a surge in current expenditure.
The FY06 tax data also reveals continued structural weaknesses in the tax regime,
as evident in the continued low tax-to-GDP ratio, the heavy reliance on import-
related taxes and potentially volatile non-tax revenues, and inability to broaden the
tax base. The risk to the country’s fiscal profile from these weaknesses is
compounded by the gradual weakening, evident in expenditure management.
The FY07 attempts to address some of the weaknesses, with measures to expand
the tax net and thereby the dismal tax-to-GDP ratio. The CBR has been given a
target of Rs 835 billion for FY07, which is Rs 131 billion (or 18.6 percent) higher
than the revised target of Rs 704 billion for FY06. Moreover, the government
appears to be seeking to lower its reliance petroleum surcharges (and cushion the
domestic economy partially from a rise in international oil prices). Unfortunately,
the continued requirements for earthquake rehabilitation expenditure, and the
massive increase in PSDP mean that the budgetary deficit will remain high at 4.2
percent of GDP in FY07.
55
2. The State of Pakistan’s Economy
In this context, it is also important that the government lays before the National
Assembly the fiscal policy statement in compliance with section 6 of the Fiscal
Responsibility and Debt Limitation Act, 2005. Such statements would have helped
explaining the government’s position on how emerging fiscal indicators accord
with the principles of sound fiscal and debt management.
5.2 Revenues
Total revenue is estimated to reach at Rs 1095.6 billion during FY06, up 21.7
percent YoY as compared to the growth of 13.8 percent YoY in FY05. The major
contribution in this relatively high revenue growth was equally strong from both
tax revenues and non-tax revenues (see Table 5.1).
Table 5.1: Summary of Public Finance
billion Rupees
FY02 FY03 FY04 FY05 FY06 YoY Change
R.E MBE FY05 FY06
1 Revenue Receipts (a+b) 624.1 720.8 791.1 900.0 1095.6 13.8 21.7
a) Tax Revenue 478.1 555.8 608.4 659.4 805.6 8.4 22.2
b) Non-Tax Receipts 146.0 165.0 182.7 240.7 290.0 31.7 20.5
Total Expenditure
2 (a+b+c) 826.3 898.2 955.8 1117.0 1423.0 16.9 27.4
a) Current 700.2 791.7 774.9 864.6 1097.9 11.6 27.0
b) Development 126.3 129.2 160.5 227.7 326.7 41.9 43.5
c) Net Lending to PSEs
etc. -0.2 -22.7 20.4 24.8 -1.6 21.4 -106.5
d) Statistical
discrepancy -11.7 3.2 78.5 -100.0
Revenue
3 Surplus/Deficit (1-2.a) -76.1 -70.9 16.2 35.4 -2.3 118.8 -106.5
4 Overall Deficit (1-2) -190.5 -180.6 -164.7 -217.0 -327.4 31.8 50.8
As per cent of GDP (mp)
1 Revenue Receipts (a+b) 14.2 14.9 14.0 13.7 14.2 … …
a) Tax Revenue 10.9 11.5 10.8 10.0 10.4 … …
b) Non-Tax Receipts 3.3 3.4 3.2 3.7 3.8 … …
2 Total Expenditure (a+b) 18.8 18.6 16.9 17.0 18.4 … …
a) Current 15.9 16.4 13.7 13.1 14.2 … …
b) Development 2.9 2.7 2.8 3.5 4.2 … …
c) Net Lending to PSEc
etc. 0.0 -0.5 0.4 0.4 0.0 … …
Revenue
3 Surplus/Deficit (1-2.a) -1.7 -1.5 0.3 0.5 0.0 … …
4 Overall Deficit (1-2) -4.3 -3.7 -2.9 -3.3 -4.2 … …
Source: Up to FY04 Economic Survey 2004-05, for FY05 and FY06 Economic Survey 2005-06 due to
inconsistent data series
* Adjusted the statistical discrepancy of Rs 78.5 billion for the purpose of analysis
56
3. Third Quarterly Report for FY06
The 22.2 percent rise in tax revenues is primarily realized through the taxes on
goods and services (sales tax, excise, and surcharges) that rose to Rs 391 billion
from Rs 323.5 billion in FY05. Though excise duty (FED) collection grew slowly
(1.5 percent), the high growth in sales tax (up 26.0 percent) and surcharges (up
19.9 percent) contributed to the sharp rise in tax revenues. It is notable, that
revenue from surcharges is likely to be higher than the modified budget estimates
of Rs 32.6 billion, because of exceptionally high revenue generation from PDL in
the third quarter as the Government achieved its PDL revenue target of Rs 15.9
billion full year FY06 by the third quarter, while the gas development surcharge
provided Rs 15.7 billion accounting for 94.5 percent of the annual modified
budgetary target.
Non-tax revenue is also estimated at Rs 290 billion, of which Rs. 247.2 billion is
from federal resources while the rest from the provincial resources. The analysis
in this respected is limited due to data constraints, but quarterly data indicates that
the significant contributor to the 31.7 percent rise in the non-tax revenues are
logistic supports payments, SBP profits and dividend receipts.
5.3 Expenditure
Total expenditure in FY06 is
Table 5.2: Composition of Current Expenditure
estimated at Rs 1423.0 billion,
billion Rupees
up 27.4 percent YoY (see Table Growth
5.1), led mainly by a 43.5 FY05 FY06 FY05 FY06
growth in development Current Expenditures 943.1 1097.9 21.7 16.4
expenditure. Of which
Interest Payments 257.2 273.1 11.8 6.2
Almost 55 percent of the total Federal 222.7 241.2 13.5 8.3
expenditure was accounted for Domestic 180.1 200.6 16.3 11.4
by interest payments (19.2 Foreign 42.6 40.6 2.9 -4.7
percent), defense, (16.9 Provincial 34.6 31.9 1.9 -7.7
percent), current subsidies and Defense 211.7 241.1 17.4 13.9
general administration (17.6 General
percent) (see Table 5.2). Administration 130.5 157.4 8.8 20.5
However, encouragingly, the Current Subsidies 66.7 92.7 -1.8 39.0
Development and Net
growth in both the interest Lending 252.5 325.1 39.6 28.8
payments and defense PSDP 227.7 326.7 41.9 43.5
expenditures was visibly lower Net Lending 24.8 -1.6 21.4 -106.5
than in the previous year (the
Source: Economic Survey 2005-06
spending has not increased, in
real terms). The deceleration in the growth of interest payments was essentially
due to declines in foreign debt payments and provincial interest payments.
57
4. The State of Pakistan’s Economy
However, substantial growth is visible in current subsidies and general
administration.
Development expenditure increased to Rs 326.7 billion with a YoY increase of
43.5 percent. Of the total PSDP outlay, the federal government expenditure is
estimated at Rs 92.9 billion on infrastructure development while 85.3 billion is on
social development. On the other hand, quite surprisingly, the net lending to PSE
is estimated to be –1.6 billion, which appears inconsistent with the fiscal data for
July-Mar FY06, in which all the PSEs except Pak Steel, declared losses for the
period.
5.4 Financing
The overall budgetary deficit of Table 5.3: Financing of Budget Deficit
Rs 327.4 billion during FY06 is
billion Rupees
estimated to be financed by Rs
118.3 billion from external FY05 FY06
resources while the rest is Total financing 217 327.4
estimated to be financed from
External resources (net) 120.4 118.3
the internal resources (see Table
5.3). Internal resources 96.6 209.1
Banking system 60.2 96.7
Of the internal resources, the Domestic non-bank 8.1 22.4
government is likely to meet the
Privatization proceeds 28.3 90.0
financing gap of Rs 96.7 billion
from the banking sector, Rs 22.4 Source: Ministry of Finance
billion from the non-bank, while the Rs 90 billion from the privatization proceeds
of which Rs 55.2 billon has already been realized by end Q3-FY06.
5.5 CBR Tax Collection
Aided by strong growth in economic activities and an exceptional rise in imports,
the CBR tax collections have been substantially above the original targets for
FY06. The growth in the CBR net tax receipts July-May FY06 have averaged 22
percent YoY, and are likely to comfortably exceed the original Rs 690 billion
annual target. The growth in CBR revenues is quite encouraging, as it is
significantly higher than the 13.6 percent growth in the same period of FY05, and
given that the ratio of CBR taxes to GDP has improved in FY06.
If this trend persists in FY07 onwards, it will be a good omen for the public
finances as it would help increase the country’s dismal tax-to-GDP ratio and
reverse the decline in the elasticity estimates witnessed in FY05.
58
5. Third Quarterly Report for FY06
The analysis of monthly tax Figure 5.2: Monthly Tax C ollection
collections show that except FY05 FY06 FY06 T arget
for the months of Nov, Jan, 80
Feb and Apr, CBR met all its
monthly targets set for the year
(see Figure 5.2). In terms of 60
individual taxes, the direct
taxes and sales-tax surpassed
billion Rs
40
their targets, while the
collection on account of
Federal Excise Duty (FED)
20
and Customs remained quite
below the target (see Table
5.4). Further, customs and 0
federal excise duty lagged
Aug
Jul
Sep
Feb
Dec
Mar
Apr
Nov
Jan
May
Oct
behind their targets in seven
months up to May in the
current fiscal year.
Table 5.4:Tax Collection up till May
billion Rupees
Net tax collection Percent of
Head Target up to May target Growth
FY06 May FY05 FY06 Annual May FY05 FY06
Direct taxes 214.0 169.8 146.4 181.9 85.0 107.2 9.8 24.3
Indirect taxes 476.0 425.4 354.1 428.6 90.0 100.8 15.3 21.0
Sales tax 276.5 248.0 207.8 259.1 93.7 104.5 8.9 24.7
Federal excise
duty 59.5 53.2 47.1 51.5 86.6 96.9 18.7 9.5
Customs 140.0 124.2 99.3 118.0 84.3 95.0 29.3 18.8
Total 690.0 595.2 500.5 610.6 88.5 102.6 13.6 22.0
Source: Central Board of Revenue
Structural analysis reflects that the share of import-related taxes in total tax
collection has continuously grown in the last five years. These taxes contributed
Rs 238.7 billion in the revenue up to Q3-FY06, accounting for almost 48.7 percent
of total CBR taxes. The trend shows that although overall share of the import-
based taxes in total taxes has slightly fallen in Q3-FY06 yet it remains of
considerable size, suggesting the vulnerability of tax receipts if the import growth
falls back to the relatively low historical norms (see Figure 5.3).
59
6. The State of Pakistan’s Economy
Refund and Gross Collection
Trends in gross collection
depict consistent growth over Figure 5.3: Import Taxe s
T otal taxes
the last six years. Up to May Import taxes
FY06 gross collection Import taxes as % of total taxes (RHS)
increased by 16 percent as 525 55
compared to 14.1 percent
Import taxes as % of total taxes
450
during the same period last 52
year (see Figure 5.4). 375
Refunds, however, sharply
billion Rs
300 49
declined by 16.3 percent as
compared to 16.5 percent 225 46
increase in the corresponding 150
period last year, reflecting the 43
75
impact of various policy
measures, principally the zero 0 40
rating of sales tax on key FY02 FY03 FY04 FY05 FY06
export-oriented products and
universal self-assessment scheme.
Figure 5.4: Gross Collection and Re fund
Direct Taxes Gross collection
Refunds
During July to May FY06, Ratio of refunds to gross collection (RHS)
direct tax collection stood at 800 21
Rs 181.9 billion against the 700
18
period target of Rs 169.8 600
billion with a YoY growth of 500
14
billion Rs
percentage
24.3 percent (see Table 5.4). 400 11
A break-up of direct taxes, 300
7
which is available only for the 200
Jul-Mar period, shows that 100 4
around 95 percent of total 0 0
direct taxes were contributed FY01 FY02 FY03 FY04 FY05 FY06
by income tax.
Within the income tax, withholding taxes contributed 55 percent of receipts while
the share of voluntary payments was 39.5 percent, as both the components also
registered strong growth (see Table 5.5). It is, however, interesting to note that the
share of various components of income tax has not shown any significant
structural change over the last five years (see Figure 5.5) suggesting that the tax
reforms of recent years have yet to contribute significantly to improving the tax
collection profile.
60
7. Third Quarterly Report for FY06
Table 5.5: Major Components of Income Tax during Q3
billion Rupees
Growth
FY02 FY03 FY04 FY05 FY06
FY05 FY06
Voluntary payments 36.9 25.2 40.4 52.4 67.2 29.8 28.2
Collection on demand 7.7 5.4 9.0 8.3 9.3 -8.2 13.0
Withholding taxes 53.6 44.0 62.7 73.3 93.5 16.9 27.5
Others 0.1 0.7 0.4 0.5 0.1 42.9 -84.6
Gross total 98.3 75.3 112.5 134.5 170.1 19.6 26.5
Refund 8.3 5.4 11.7 19.8 24.3 69.1 22.5
Total Net 90.0 69.8 100.7 114.7 145.8 13.9 27.1
Source: Central Board of Revenue
A break-up of the income tax, Figure 5.5: Share of the Components of Income Tax
up to March FY06, shows that upto Q 3
almost half of the collection on Voluntary payments
Collection on demand
demand comprises of arrears Withholding taxes
(Rs 4.4 billion) while the Others
current demand contributed Rs 60
4.9 billion. Of the withholding 50
taxes, major revenue heads
were contracts (Rs 29.4 40
billion), imports (Rs 19.5
percent
billion), salaries (Rs 10.2 30
billion), and exports (Rs 7.5
20
billion).
10
Indirect Taxes
Collection from indirect taxes 0
rose 19.6 percent YoY to Rs FY02 FY03 FY04 FY05 FY06
337.1 billion by end Q3-FY06.
Approximately 60 percent of the indirect taxes were accounted for by sales tax
collection with federal excise duty (12 percent) and the customs (28 percent)
contributing the remainder.
Sales Tax
With a net collection of Rs 202.4 billion during first three quarters of FY06, sales
tax surpassed period target of Rs 196.6 billion registering a YoY growth of 22.4
percent.
61
8. The State of Pakistan’s Economy
Sales tax on imports contributed around Rs 121.1 billion, approximately 59.8
percent, that portrays high dependence on consumption of imported commodities.
Major revenue came from POL (Rs 17.1 billion), vehicles other than railway/
tramway (Rs 13.6 billion), vegetable oil (Rs 4.7 billion), and electrical machinery
(Rs 4.2 billion). On the other hand, domestic sales tax provided Rs 81.3 billion, of
which major revenue spinners were POL (Rs.36.8 billion), services (Rs 21.4
billion) and sugar & sugar confectionery (Rs 6.0 billion).
Customs Duty
During July-March FY06, collection from customs stood at Rs 95.1 billion with a
YoY increase of 18.7 percent. The growth in customs duty, however, does not
seem to be compatible with the 43.2 percent growth in imports during Q3-FY06.
Major revenue sources were vehicles, vegetable oil, POL, mechanical appliances
and electrical machinery.
Federal Excise Duty (FED)
With a shift to VAT- mode sales Table 5.6: FED Collection up to Q3
tax, federal excise duty is billion Rupees
considered as a dying tax, but it Major
FY04 FY05 FY06
Growth
commodities FY05 FY06
continues to remain an
Beverages 1.6 1.7 2.6 4.9 53.6
important source of revenue.
Beverages
During Q3-FY06, the FED 0.8 1.1 1.0
concentrate 42.4 -9.4
collection remains below the Cigarettes &
12.1 14.6 16.4
tobacco 20.9 12.0
target in five months and also
Cement 6.7 7.9 9.1 17.4 14.6
lags behind its overall target of Natural gases 3.6 4.1 4.0 12.2 -1.0
Rs 41.3 billion with a collection POL products 2.5 2.9 2.6 14.1 -10.0
of Rs 39.6 billion. Sub-total 27.4 32.3 35.7 17.9 10.5
Others 2.2 2.0 1.3 -7.0 -36.6
Major revenue spinners of the Local goods
29.6 34.4 37.0 16.1 7.7
(gross)
FED remained the same as in Imported goods
0.9 2.0 2.9 129.2 42.7
the past, that is, beverages, (gross)
beverages concentrates, Total (gross) 30.5 36.4 39.9 19.3 9.6
cigarettes & tobacco, cement,
Refund &
natural gas and POL products, rebates
0.1 0.0 0.2 -42.3 490.6
constituting around 96.5 percent Total (net) 30.4 36.4 39.6 5.9 19.5
of the revenue generated from Source: Central Board of Revenue
the locally produced goods. It is
noteworthy that there is a 10 percent YoY decline in the revenues from the POL
products and a further 9.4 percent decline in revenues from beverages concentrates
(see Table 5.6), while industrial growth depicts a YoY increase of 2.3 percent
62
9. Third Quarterly Report for FY06
growth in POL production, 4.7 percent in Cigarette, 9.8 percent in Cement, and
2.3 percent in POL.
5.6 Federal Budget FY07
The budgetary measures Table 5.7: Summary of Public Finance
announced in the Federal
Rs. in billion
Budget 2006-07 broadly focus
on providing a conducive FY05 FY06 FY07
environment for economic
Total revenue receipts 900.0 1095.6 1188.0
activity in the country. In
Tax revenue 659.4 805.6 954.0
addition, the Government’s
Non-tax revenue 240.7 290.0 233.0
policy of increasing revenues
Total expenditure 1117.0 1423.0 1561.5
through broadening the tax base
Current 943.1 1097.9 1152.0
is implemented through various
Development and Net
budgetary measures. Lending
252.5 325.1 435.0
The Government has announced Statistical discrepancy 78.5 - 25.5
a substantial increase in Overall fiscal deficit 217.0 327.4 373.5
development spending in Without earthquake spending - 262.4 323.5
subsidies on essential Financing of fiscal deficit 217.0 327.4 373.4
foodstuffs. From the budgetary External (net) 120.4 118.3 171.7
outlay of more than Rs 1.5 Domestic 96.6 209.1 201.7
trillion, Rs 435 billion have Non-bank financing 8.1 22.4 6.7
been allotted to public sector Bank financing 60.2 96.7 120.0
development; a 60 percent Privatization proceeds 28.3 90.0 75.0
increase from the Rs 272 billion (as percent of GDP)
allocated in FY06 and 38.7 Total revenue 13.7 14.2 13.5
percent higher than the revised Tax revenue 10.0 10.4 10.8
(Rs 325.1 billion) (see Table Total expenditure 17.0 18.4 17.7
5.7). About Rs 8 billion have Current expenditure 14.3 14.2 13.1
been allocated for subsidizing Development expenditure 3.8 4.2 4.9
household essentials, Overall fiscal deficit 3.3 4.2 4.2
particularly foodstuffs, in state- Fiscal Deficit (without earthquake) 3.4 3.7
run utility stores, up from Rs 2
billion currently, to ease the impact of inflation, currently at around 8 percent.
The budget is pro-poor and is aimed at sustaining growth. Over the period from
2001 to 2005 regardless of the fact that poverty has declined, the income
distribution has worsened in the country. The ratio of the highest to the lowest
quintile which measures the gap between the rich and the poor also widened to
some extent from 3.76 in 2001 to 4.15 in 2005. At regional level, the gap between
63
10. The State of Pakistan’s Economy
the rich and poor in urban areas has widened relatively at higher pace – increase
from 10.40 to 12.02. In contrast, the gap between the rich and poor in rural area
remained more or less unchanged, that is, from 2.22 to 2.19. In this backdrop, the
budget aims to address the issue of growing rich-poor gap by taxing the richer
segments of the society and by providing relief and concession to the poor
amounting to Rs 109 billion. The grant of subsidies in various sectors is to attain
the objective of pro-poor growth.
The Budget may be regarded as ‘industry-neutral’ as it places little emphasis on
industry and trade. However, it is ultimately going to benefit the businesses as the
budget focuses more on the sustained growth of the economy.
On the expenditure side, defence spending has been increased to Rs 250 billion (3
percent of the GDP), up Rs 27 billion from the Rs 223.5 billion in FY06. The
Federal budget on education and health shows YoY net increase of Rs 2.1 billion
and Rs 0.3 billion, respectively; but in terms of GDP there is no improvement.
However, we should recognize that the overall impact of the government spending
on education, health, and population welfare sectors would be available after the
provincial budgets come out.
With a budgeted revenue of Rs 1083 billion, the overall budget deficit (Rs 373.5)
is estimated to be 4.2 percent of the GDP (including earthquake rehabilitation
expenditure), mainly due to the increase in PSDP. This is consistent with the
Fiscal Responsibility and Debt Limitation Act, 2005.
CBR has been assigned a target of Rs 835 billion for FY07, which is Rs 131
billion (or 18.6 percent) higher than the revised target of Rs 704 billion for FY06.
This will increase the tax-GDP ratio of CBR taxes from the current 9.1 percent to
9.5 percent. This is a very positive development.
The tax system in Pakistan is characterized by narrow tax base, disproportionate
tax burden on different sectors and low tax buoyancy, contributing to the low tax-
to-GDP ratio. It may be recognized; however, that the Federal Government and
CBR have limited ability to increase the tax/GDP ratio for the reason that the
taxability of two important sectors of the economy offering enormous revenue
potential (agriculture income tax and sales tax on services) are provincial
subjects. Unfortunately, the receipts from these provincial taxes are not reflective
of the share of these sectors in the total economy. Tax/GDP ratio for the federal
government is 9.9 percent, whereas it is only 0.6 percent for provincial
governments.
64
11. Third Quarterly Report for FY06
It is instructive to note that sales tax is the most prolific tax in terms of revenue
generation in Pakistan. Its widespread acceptability has increased its share in
federal tax receipts from 23.4 percent in FY99 to 40.0 percent in FY06. The ratio
of sales tax to GDP has also increased from 2.45 percent in FY99 to 3.7 percent in
FY06. However, the services sector, which contributed 52.3 percent in the GDP in
FY06, mostly remains outside the scope of sales tax and the collection of sales
tax/federal excise duty from this sector is very low. During FY05, the sales
tax/CED collection on services amounted to Rs 27.9 billion only. The main
portion of Rs 20.4 billion was generated through telecommunication services.
Other services contributed Rs 3.6 billion to the total sales tax collection of Rs 240
billion. The contribution of retail and wholesale trade to the sales tax collection
was very dismal (Rs3.3 billion), representing 0.26 percent of its value added in the
GDP (mp) which amounted to Rs 1251 billion.
To meet the growing challenge of higher revenue collection, the Budget FY07 has
introduced some new taxation measures which are aimed at improving resource
mobilization and broadening of tax base in the country.
A welcome development has been the move to bring some of the services
(financial services, franchise services, services provided by foreign exchange and
money changer) into the excise regime. Such taxation measures would broaden the
tax base, mobilize resources, and make the tax system more equitable. It would be
desirable to bring all other services with significant revenue potential into the tax
net, so as to increase the tax-GDP ratio and make the tax system more equitable.
Another Wealth-tax Act, 1963 was suspended (held in abeyance) from July 1,
2001. Prior to its suspension, wealth tax contributed nearly Rs 4.0 billion (in
FY00) to the exchequer. In the absence of wealth tax and given the fact that
enormous capital gains (on sale of property, land, shares, etc.) are made by the
rich segment of society, it may be prudent to impose and implement capital gains
tax seriously. This will improve income distribution in the economy as the rich
will pay more taxes. This year, the Government has increased the rate of CVT on
shares from 0.01 to 0.02 percent but this will hardly generate significant additional
revenues. The CVT collected from stock exchanges in Pakistan in FY05 amounted
to Rs 2.068 billion, and in FY06 Rs 0.922 billion have been collected up to March.
We can roughly estimate that this raise in tax rate would fetch additional Rs 1.5
billion in FY07.
It is important that taxes fall proportionately on all the sectors. The risk of
deterioration in fiscal performance also needs to be guarded against. Some key
risks include: (1) heavy dependence on import-related taxes, accounting for nearly
65
12. The State of Pakistan’s Economy
half of the share in collections (receipts could therefore slowdown if, as expected,
import growth falls back to historical norms); and (2) dependence on potentially
volatile non-tax revenues. Thus, there remains a clear need for further tax effort to
raise the tax-GDP ratio substantially over the next few years. In this context, the
estimated increase in the tax-GDP ratio in the next year needs to be monitored,
and particular attention needs to be given to the broad-basing of the tax net and
improving collections from under-taxed areas of the economy such as agriculture,
the services sector.
66