Downloaded 133 times


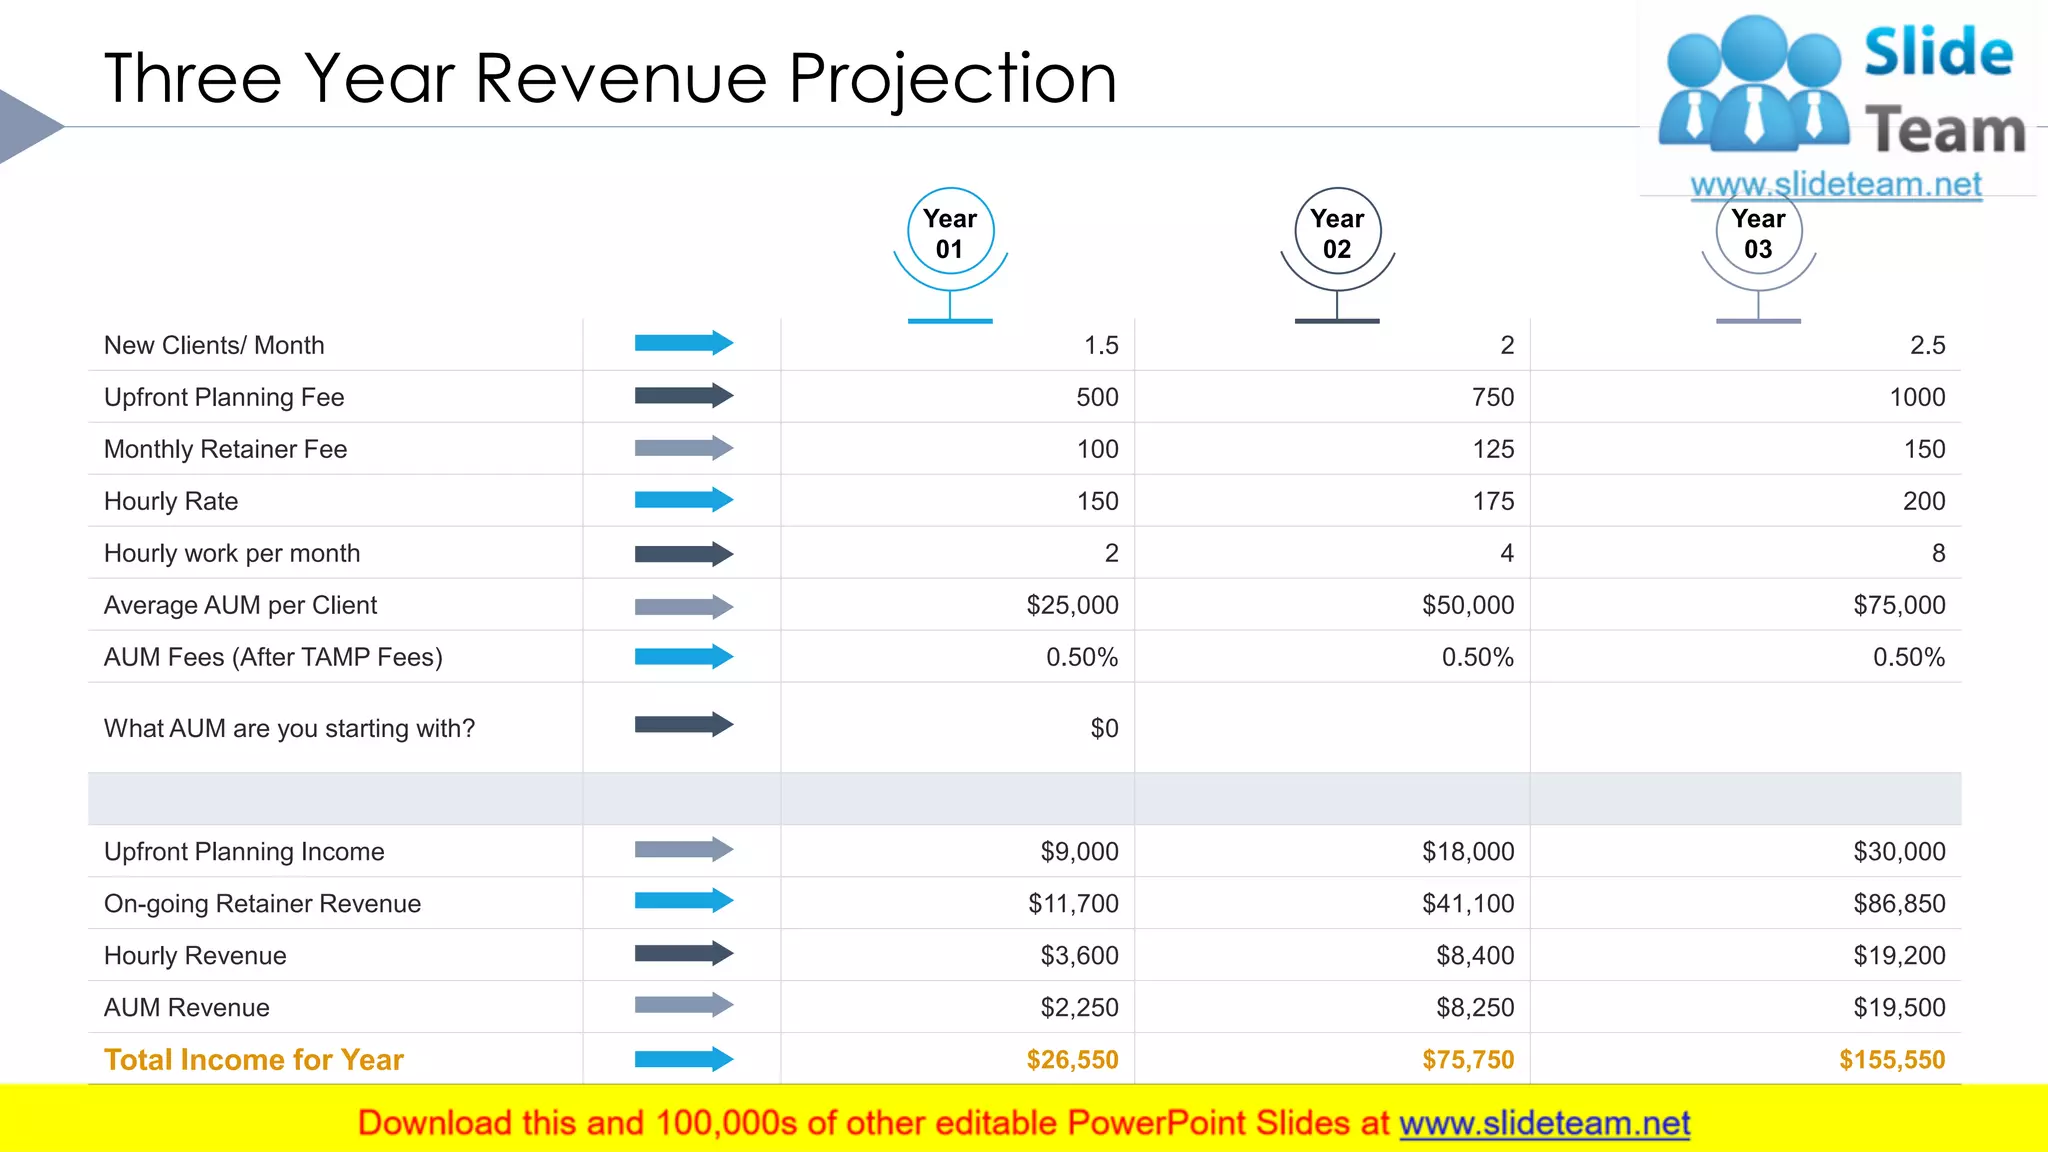

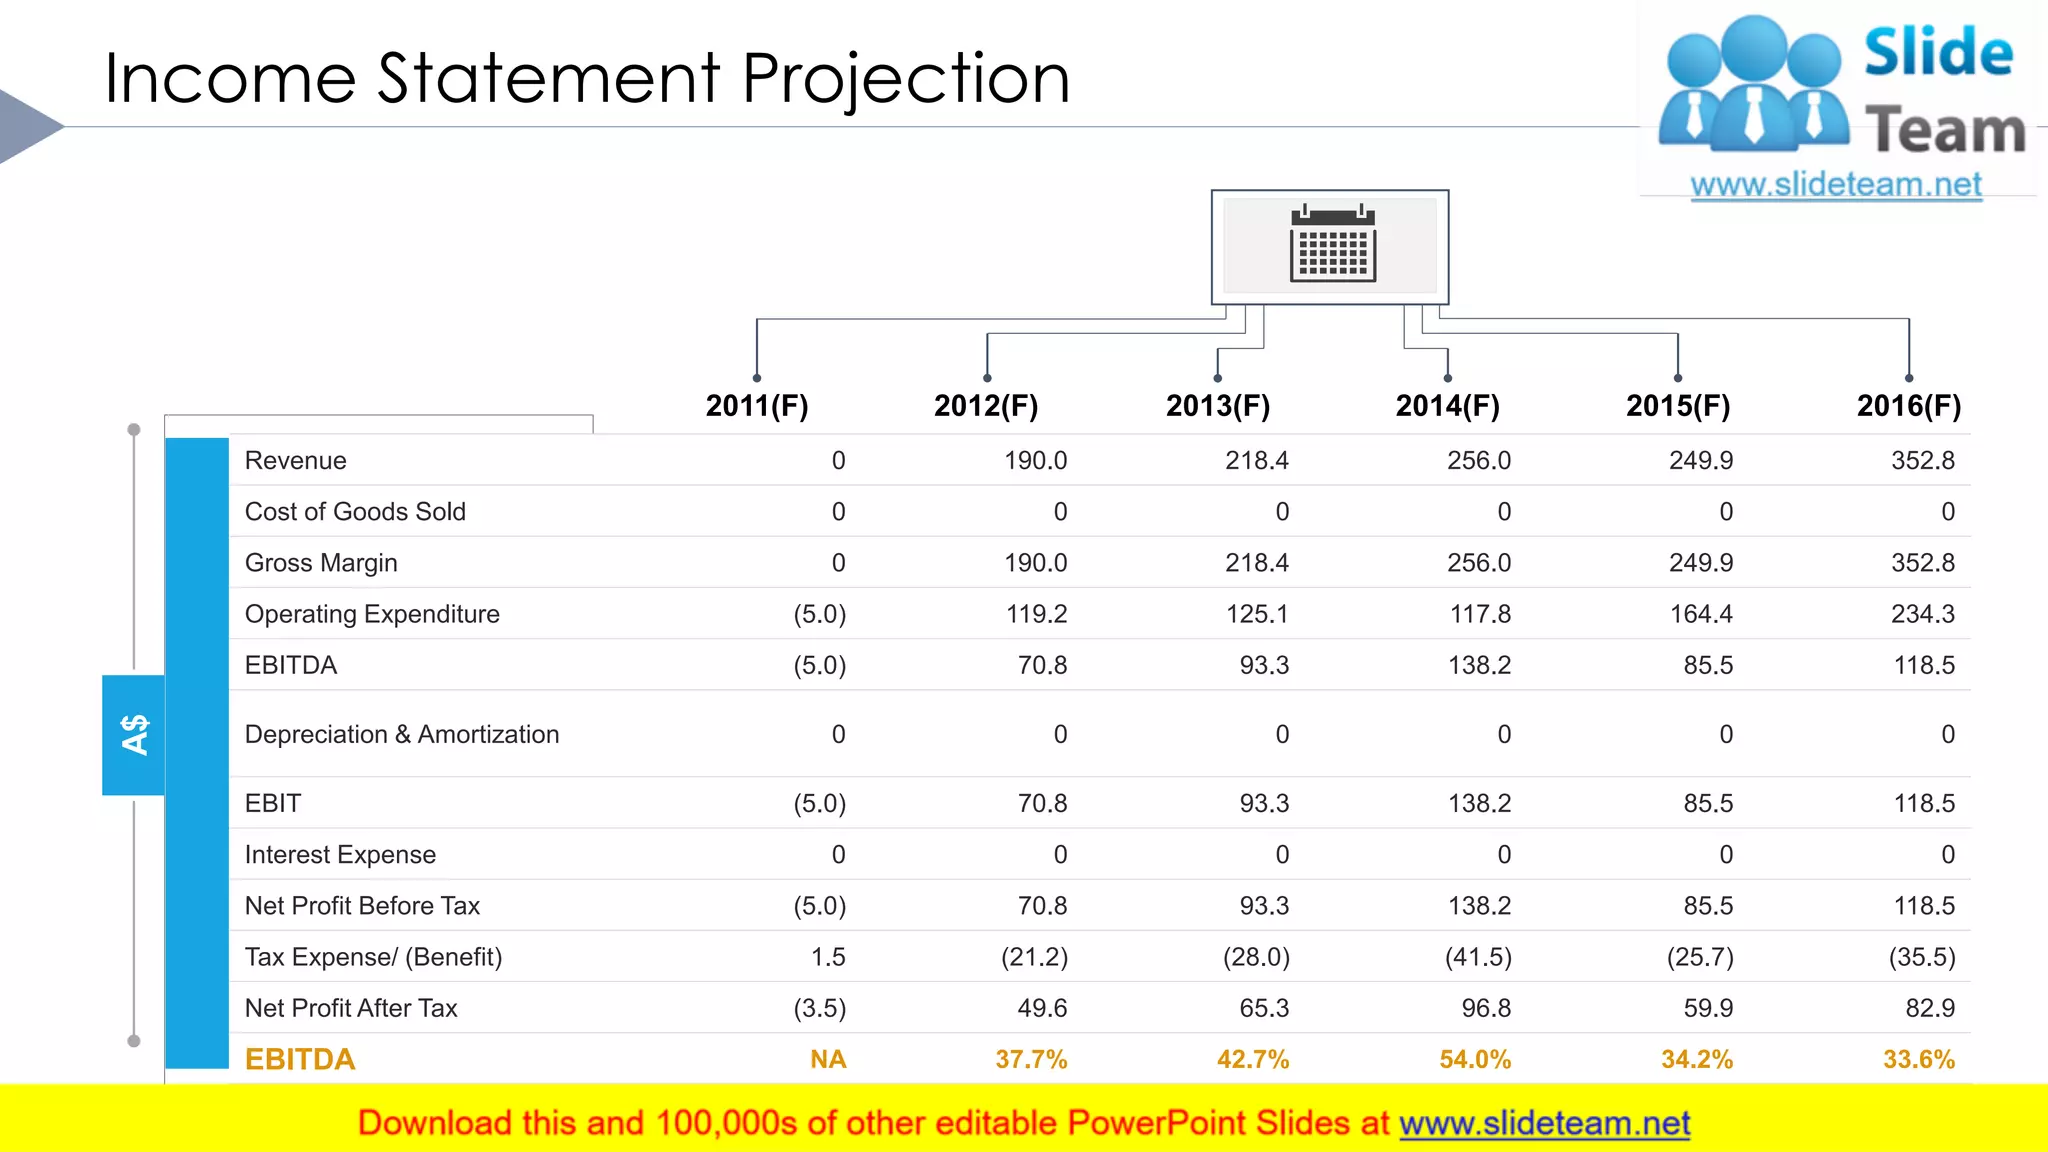

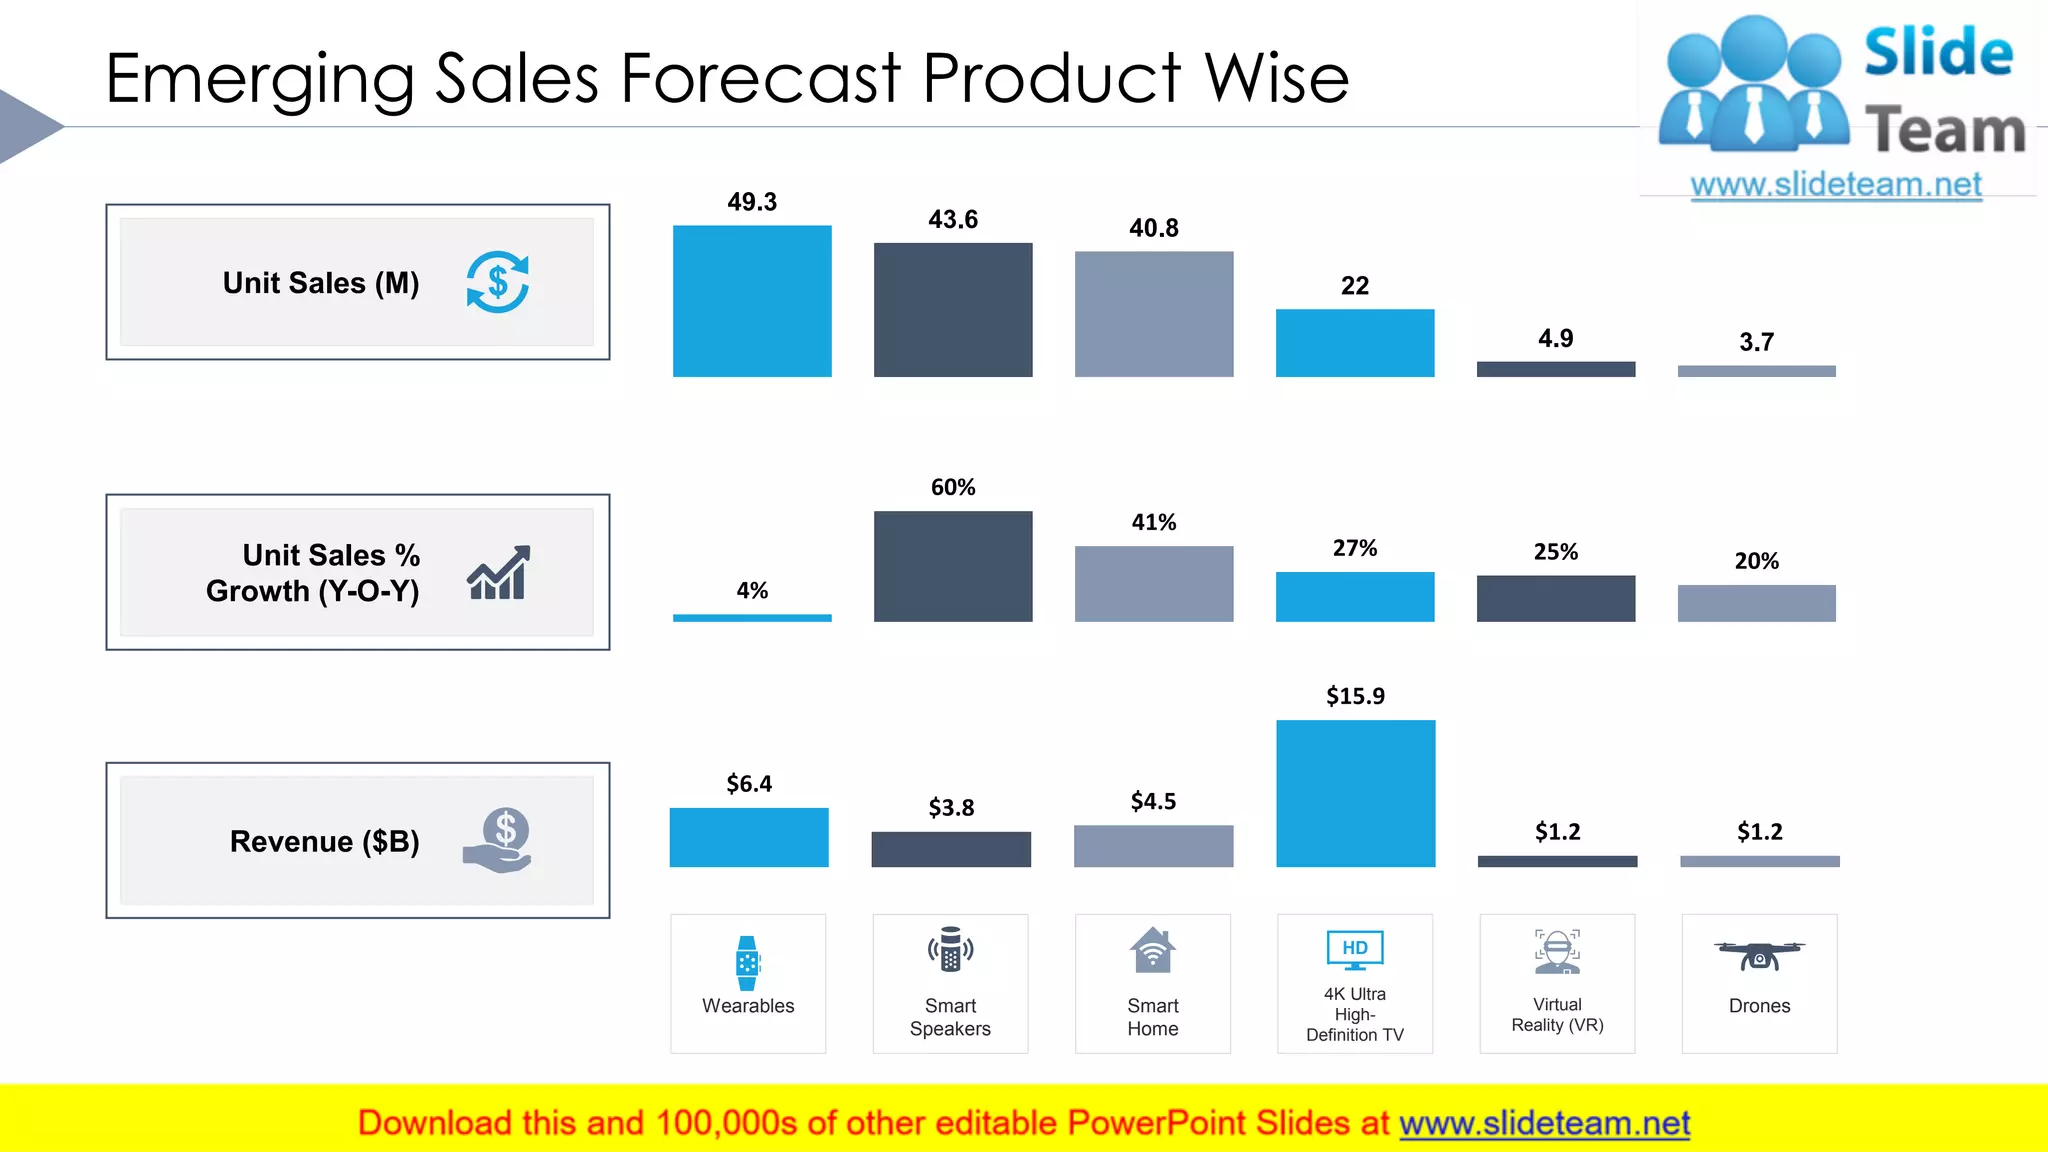

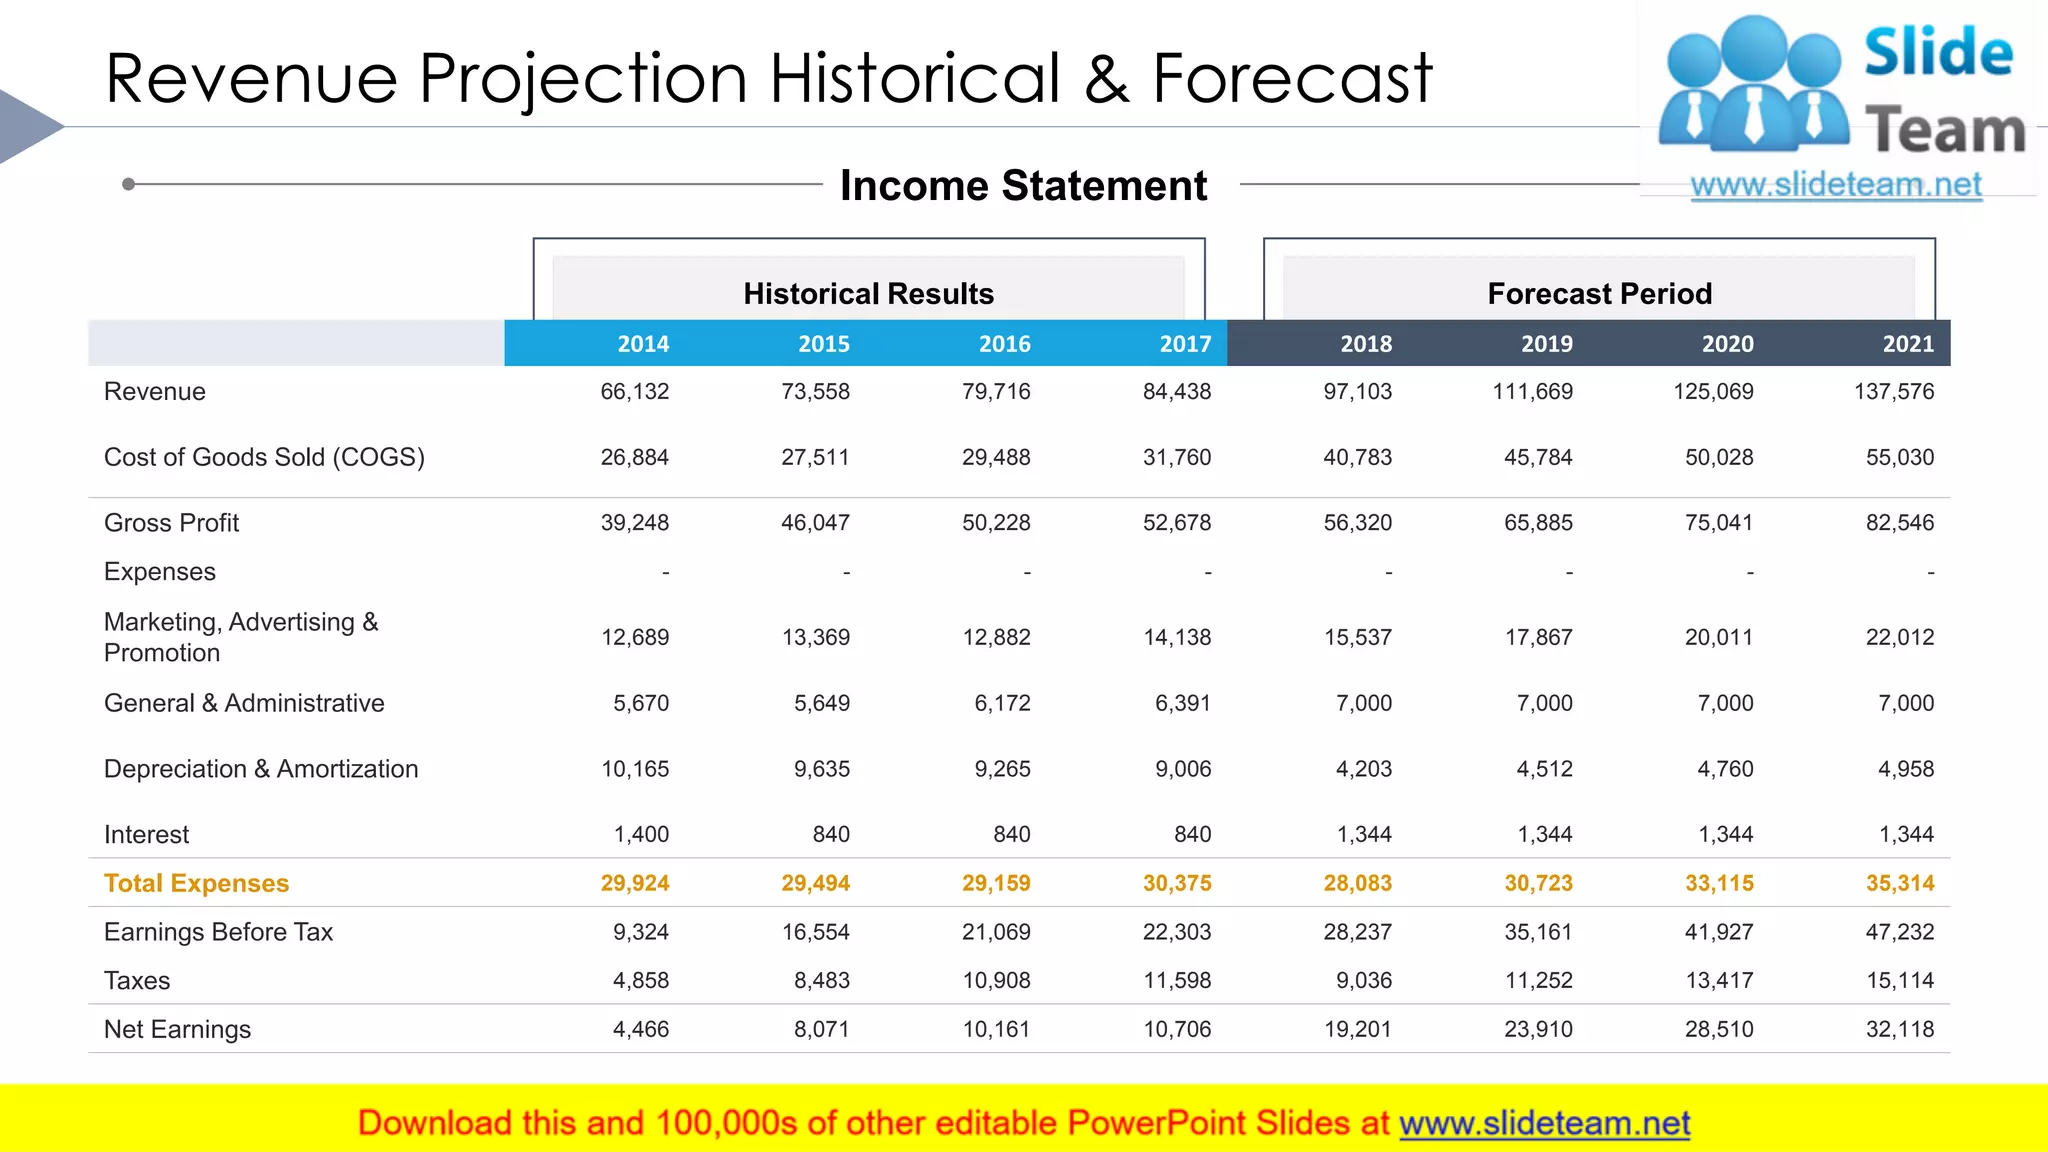


The document presents a comprehensive financial projection for a retail store, detailing various revenue streams, customer acquisition, and retention metrics over a five-year period. It includes a revenue forecast with detailed assumptions about customer behavior, average sales, and expenses, as well as graphical representations of projected growth. The financial data is editable and can be tailored to the company's specific needs for strategic planning.


