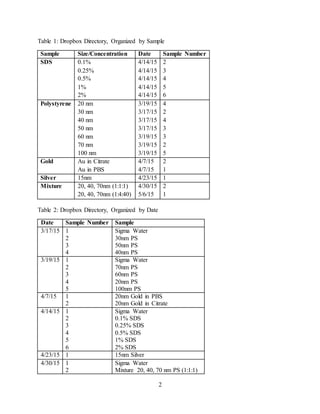
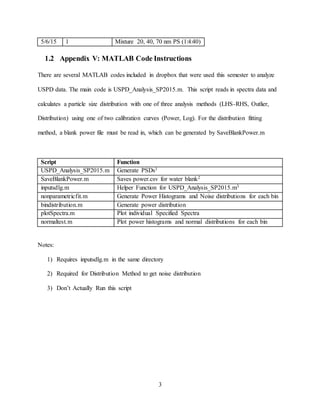
1
1.1 Appendix IV: Dropbox Directory
All data are in dropbox under the folder 1026-S15-T4-USPD_nanoparticle_sizeDataData.
There is a folder within for each technique (TEM, Cryo-TEM, USPD, DLS), and a folder or file
within each technique for each date. Data taken on that day are in this sheet. Note that data taken
before 3/17 had many settings changed, so they are not included in this list. In general, samples
have five runs with 1000 spectra and one run with 5000 spectra. The runs are denoted as A.B
(Description). A is the sample number, B is the run number, and the description describes the
size, concentration, and/or material. The 5000 spectra run is always the last run (i.e. run 6).
2
Table 1: Dropbox Directory, Organized by Sample
Sample Size/Concentration Date Sample Number
SDS 0.1% 4/14/15 2
0.25% 4/14/15 3
0.5% 4/14/15 4
1% 4/14/15 5
2% 4/14/15 6
Polystyrene 20 nm 3/19/15 4
30 nm 3/17/15 2
40 nm 3/17/15 4
50 nm 3/17/15 3
60 nm 3/19/15 3
70 nm 3/19/15 2
100 nm 3/19/15 5
Gold Au in Citrate 4/7/15 2
Au in PBS 4/7/15 1
Silver 15nm 4/23/15 1
Mixture 20, 40, 70nm (1:1:1) 4/30/15 2
20, 40, 70nm (1:4:40) 5/6/15 1
Table 2: Dropbox Directory, Organized by Date
Date Sample Number Sample
3/17/15 1
2
3
4
Sigma Water
30nm PS
50nm PS
40nm PS
3/19/15 1
2
3
4
5
Sigma Water
70nm PS
60nm PS
20nm PS
100nm PS
4/7/15 1
2
20nm Gold in PBS
20nm Gold in Citrate
4/14/15 1
2
3
4
5
6
Sigma Water
0.1% SDS
0.25% SDS
0.5% SDS
1% SDS
2% SDS
4/23/15 1 15nm Silver
4/30/15 1
2
Sigma Water
Mixture 20, 40, 70 nm PS (1:1:1)
3
5/6/15 1 Mixture 20, 40, 70 nm PS (1:4:40)
1.2 Appendix V: MATLAB Code Instructions
There are several MATLAB codes included in dropbox that were used this semester to analyze
USPD data. The main code is USPD_Analysis_SP2015.m. This script reads in spectra data and
calculates a particle size distribution with one of three analysis methods (LHS-RHS, Outlier,
Distribution) using one of two calibration curves (Power, Log). For the distribution fitting
method, a blank power file must be read in, which can be generated by SaveBlankPower.m
Script Function
USPD_Analysis_SP2015.m Generate PSDs1
SaveBlankPower.m Saves power.csv for water blank2
inputsdlg.m Helper Function for USPD_Analysis_SP2015.m3
nonparametricfit.m Generate Power Histograms and Noise distributions for each bin
bindistribution.m Generate power distribution
plotSpectra.m Plot individual Specified Spectra
normaltest.m Plot power histograms and normal distributions for each bin
Notes:
1) Requires inputsdlg.m in the same directory
2) Required for Distribution Method to get noise distribution
3) Don’t Actually Run this script

Final Report MATLAB and Dropbox Appendices

  • 1.
    1 1.1 Appendix IV:Dropbox Directory All data are in dropbox under the folder 1026-S15-T4-USPD_nanoparticle_sizeDataData. There is a folder within for each technique (TEM, Cryo-TEM, USPD, DLS), and a folder or file within each technique for each date. Data taken on that day are in this sheet. Note that data taken before 3/17 had many settings changed, so they are not included in this list. In general, samples have five runs with 1000 spectra and one run with 5000 spectra. The runs are denoted as A.B (Description). A is the sample number, B is the run number, and the description describes the size, concentration, and/or material. The 5000 spectra run is always the last run (i.e. run 6).
  • 2.
    2 Table 1: DropboxDirectory, Organized by Sample Sample Size/Concentration Date Sample Number SDS 0.1% 4/14/15 2 0.25% 4/14/15 3 0.5% 4/14/15 4 1% 4/14/15 5 2% 4/14/15 6 Polystyrene 20 nm 3/19/15 4 30 nm 3/17/15 2 40 nm 3/17/15 4 50 nm 3/17/15 3 60 nm 3/19/15 3 70 nm 3/19/15 2 100 nm 3/19/15 5 Gold Au in Citrate 4/7/15 2 Au in PBS 4/7/15 1 Silver 15nm 4/23/15 1 Mixture 20, 40, 70nm (1:1:1) 4/30/15 2 20, 40, 70nm (1:4:40) 5/6/15 1 Table 2: Dropbox Directory, Organized by Date Date Sample Number Sample 3/17/15 1 2 3 4 Sigma Water 30nm PS 50nm PS 40nm PS 3/19/15 1 2 3 4 5 Sigma Water 70nm PS 60nm PS 20nm PS 100nm PS 4/7/15 1 2 20nm Gold in PBS 20nm Gold in Citrate 4/14/15 1 2 3 4 5 6 Sigma Water 0.1% SDS 0.25% SDS 0.5% SDS 1% SDS 2% SDS 4/23/15 1 15nm Silver 4/30/15 1 2 Sigma Water Mixture 20, 40, 70 nm PS (1:1:1)
  • 3.
    3 5/6/15 1 Mixture20, 40, 70 nm PS (1:4:40) 1.2 Appendix V: MATLAB Code Instructions There are several MATLAB codes included in dropbox that were used this semester to analyze USPD data. The main code is USPD_Analysis_SP2015.m. This script reads in spectra data and calculates a particle size distribution with one of three analysis methods (LHS-RHS, Outlier, Distribution) using one of two calibration curves (Power, Log). For the distribution fitting method, a blank power file must be read in, which can be generated by SaveBlankPower.m Script Function USPD_Analysis_SP2015.m Generate PSDs1 SaveBlankPower.m Saves power.csv for water blank2 inputsdlg.m Helper Function for USPD_Analysis_SP2015.m3 nonparametricfit.m Generate Power Histograms and Noise distributions for each bin bindistribution.m Generate power distribution plotSpectra.m Plot individual Specified Spectra normaltest.m Plot power histograms and normal distributions for each bin Notes: 1) Requires inputsdlg.m in the same directory 2) Required for Distribution Method to get noise distribution 3) Don’t Actually Run this script