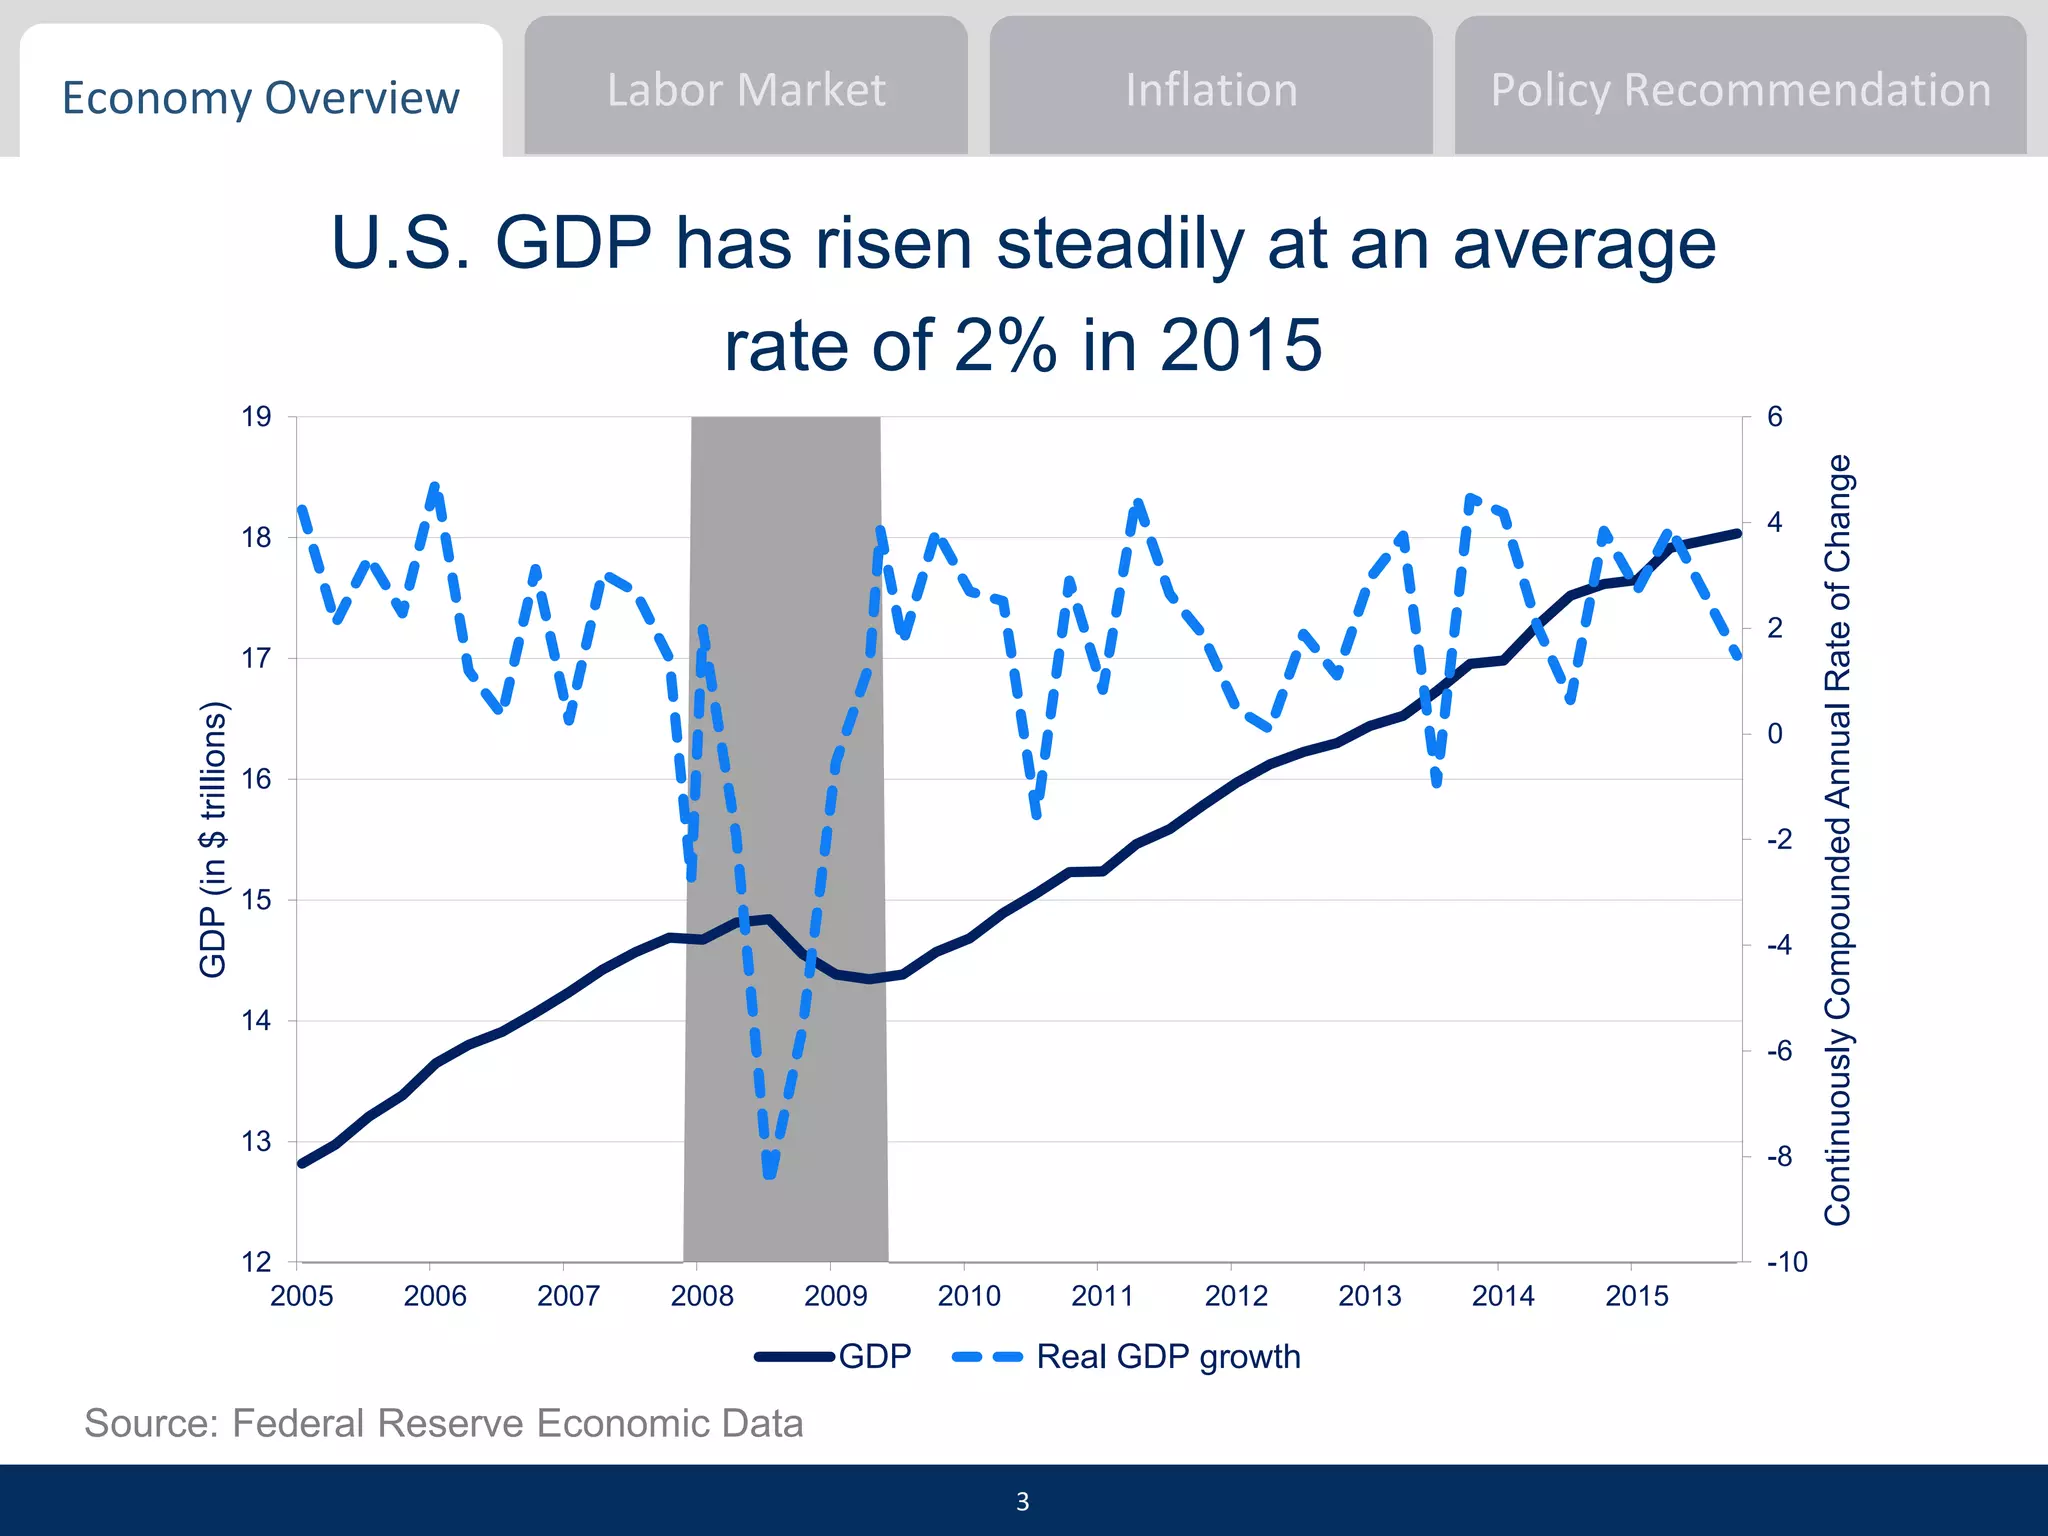
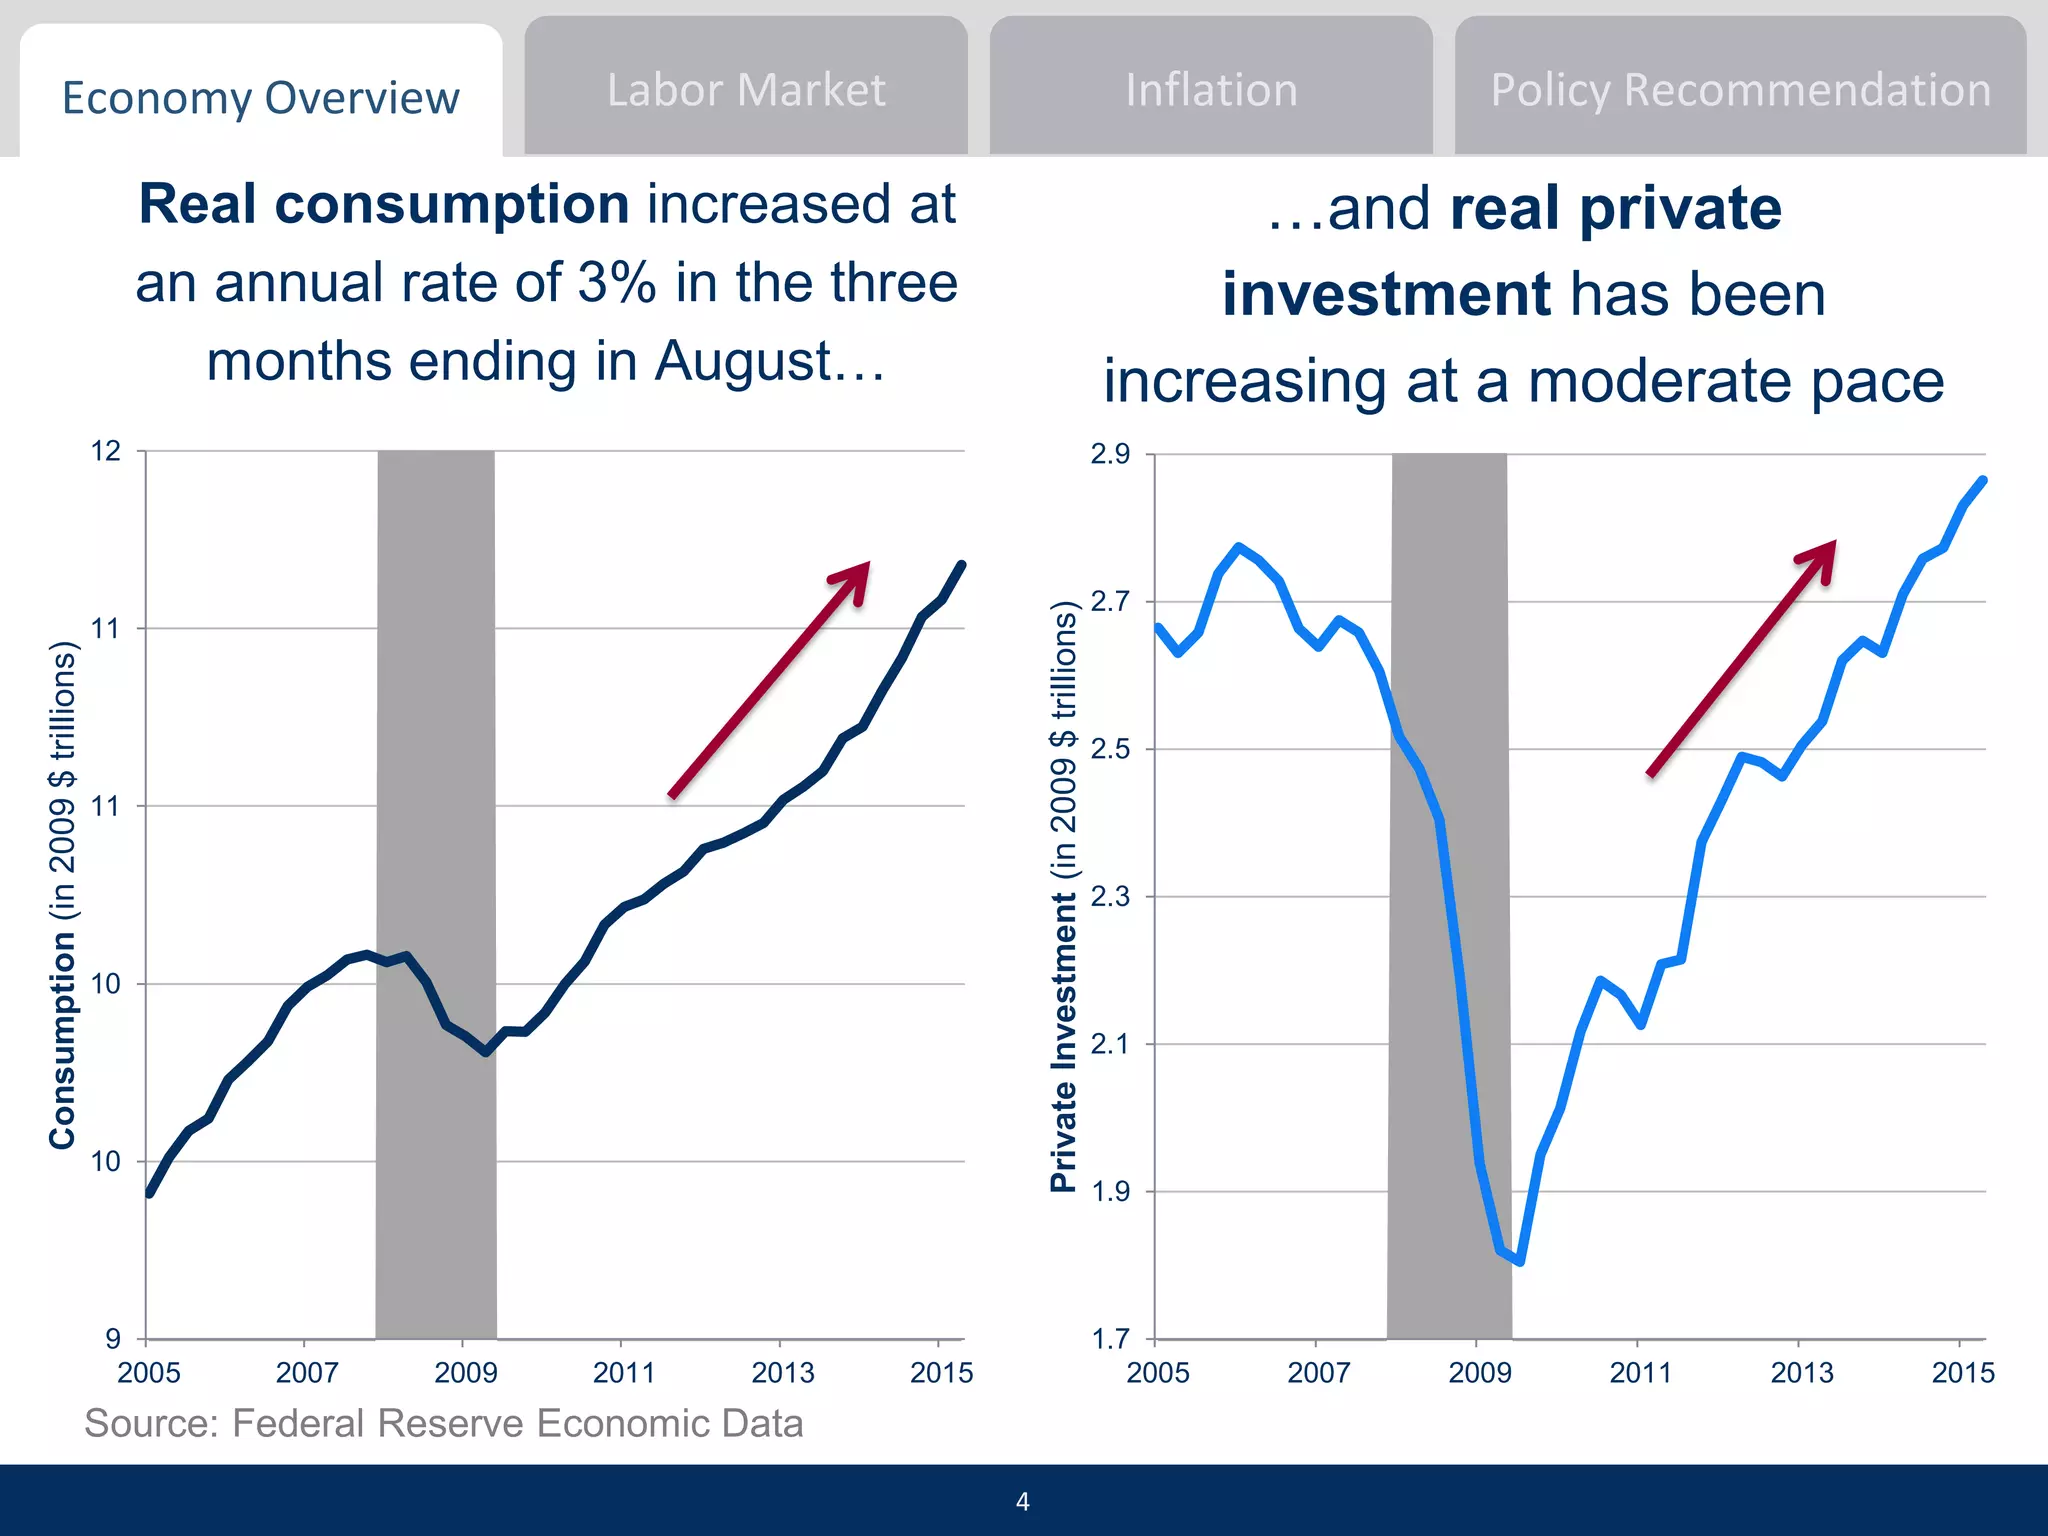
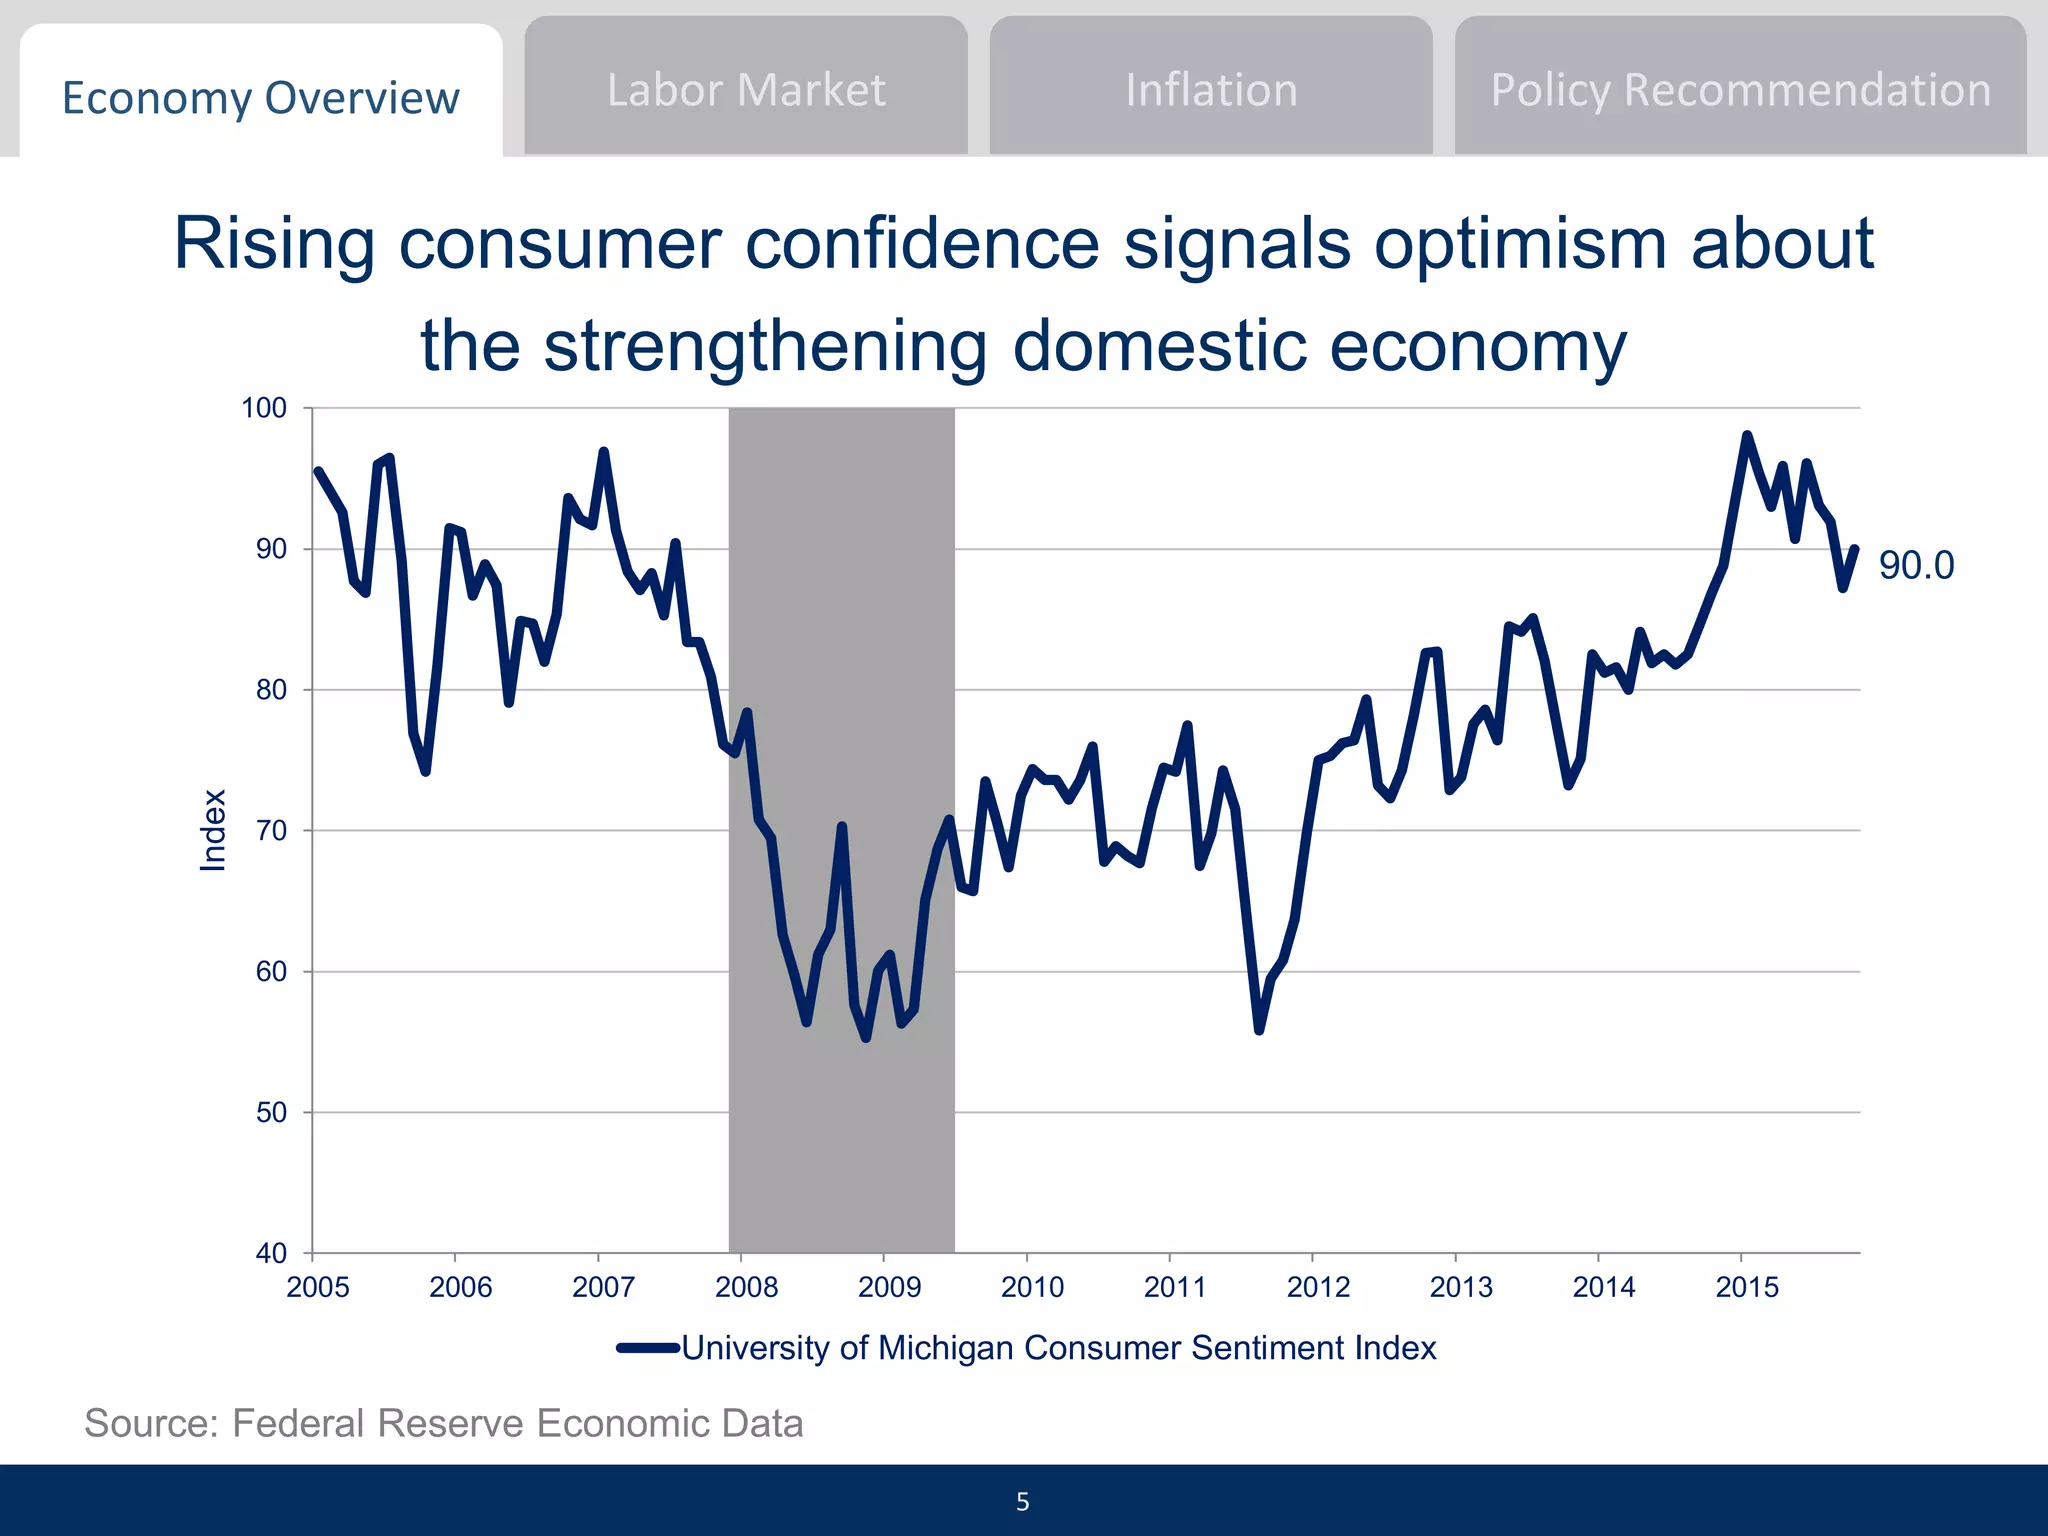
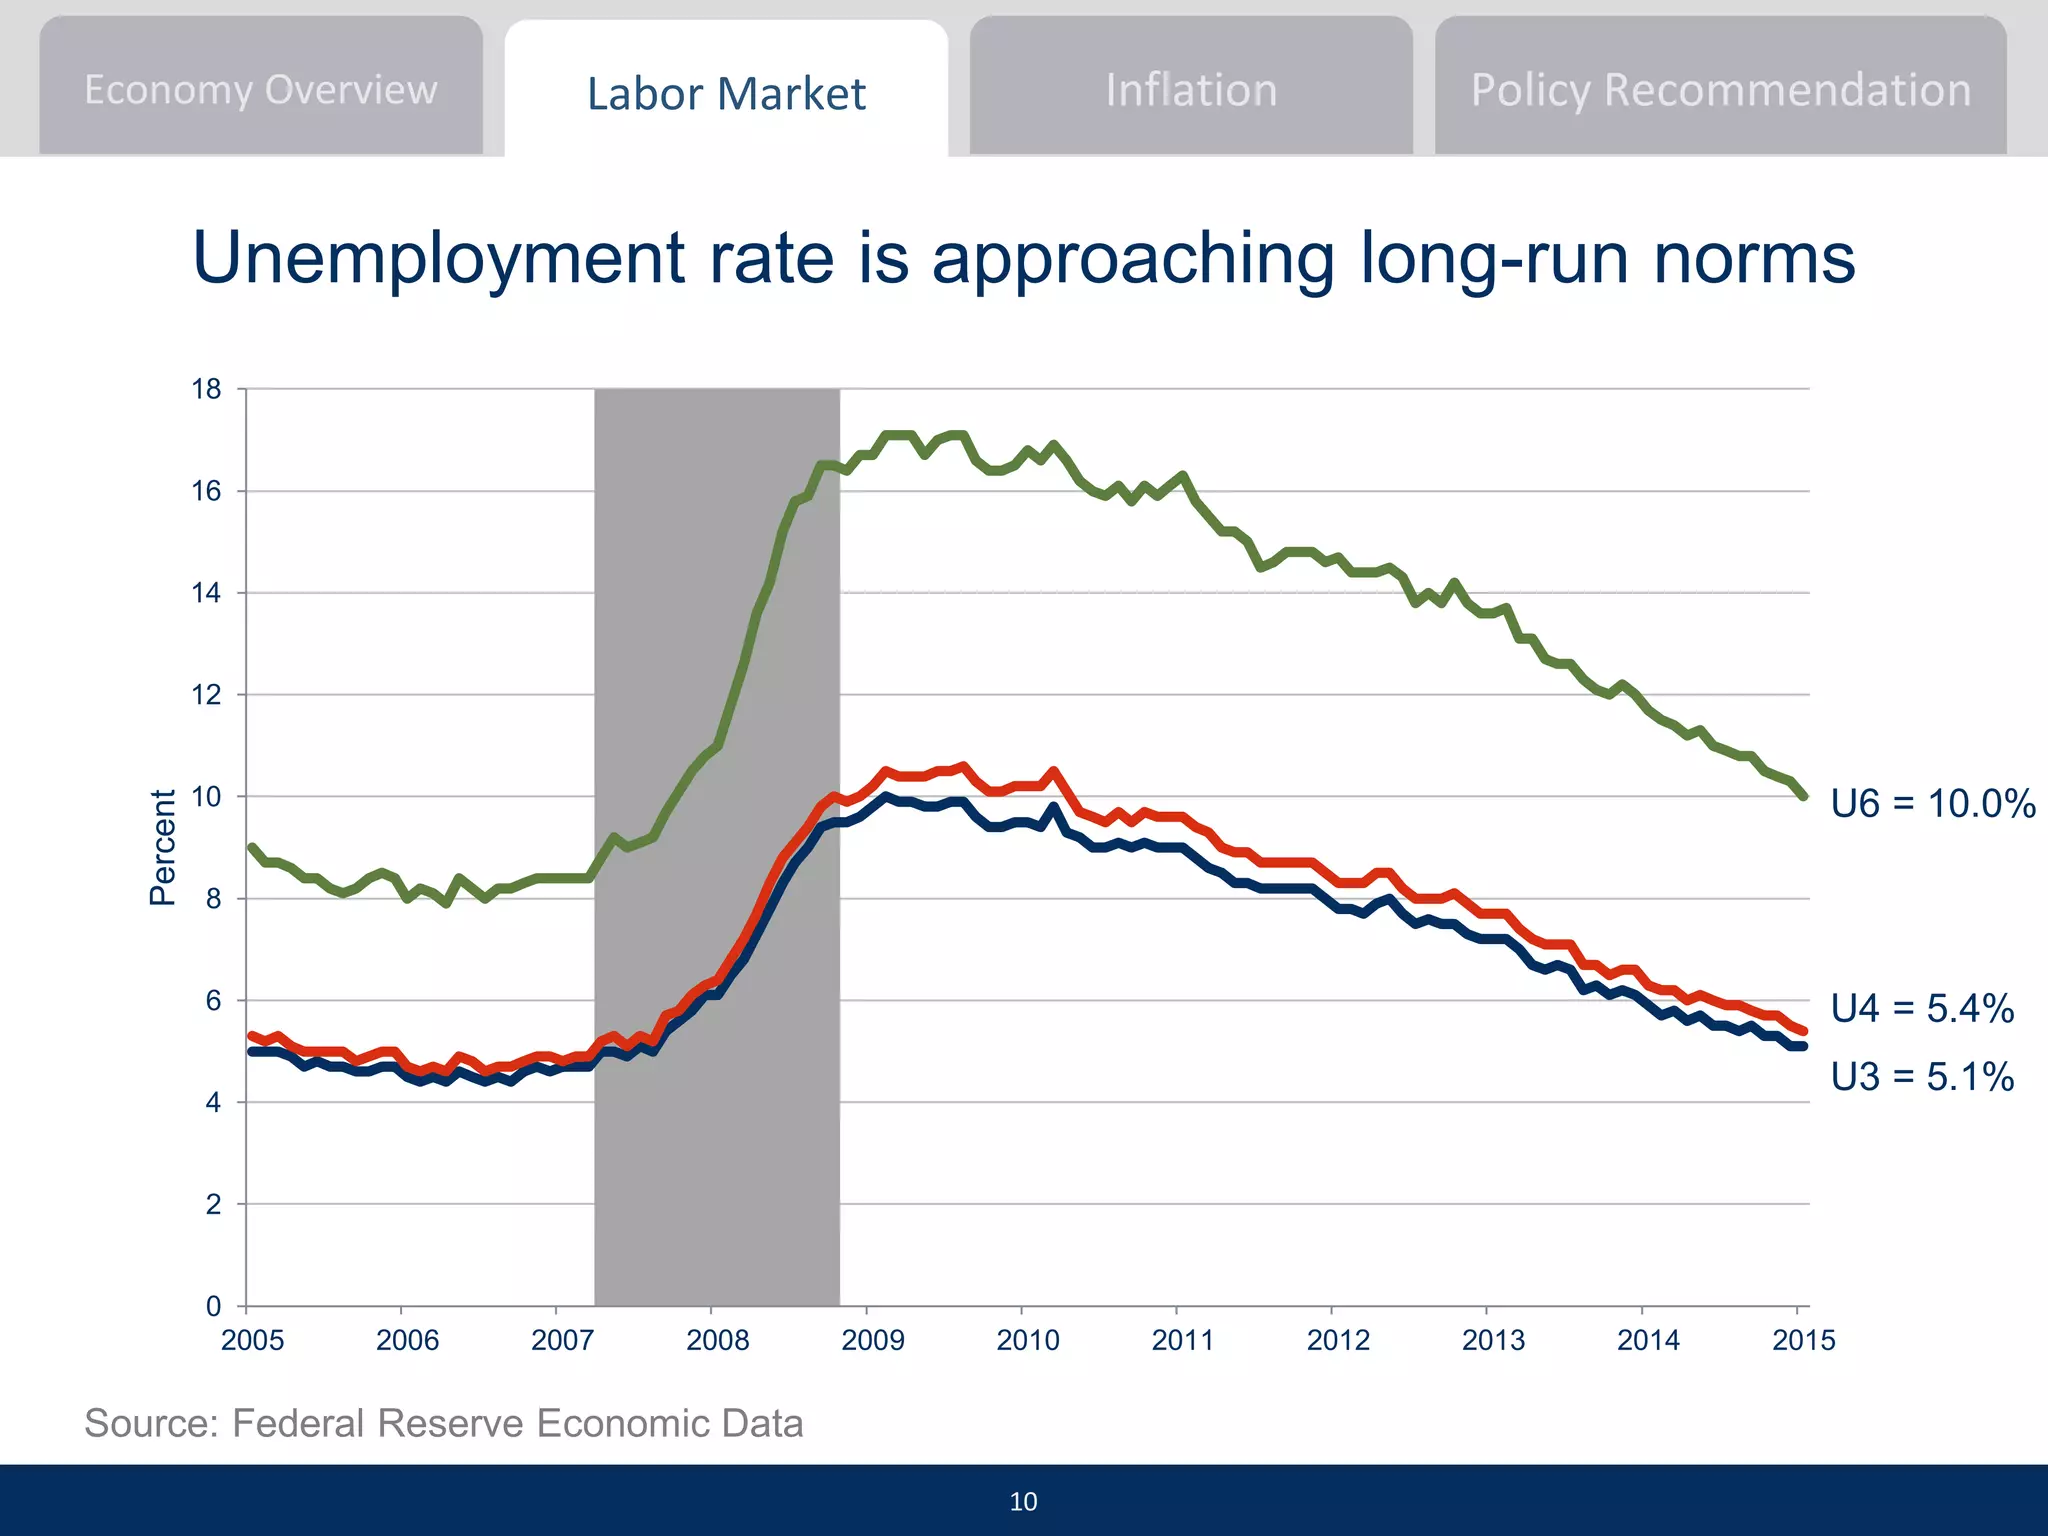
Economic Overview and
Monetary Policy
College Fed Challenge - Federal Reserve Bank of Boston
November 6, 2015
1
AGENDA
1. Economic Overview
2. Dual Mandate
a. Labor Market and Wages
b. Inflation
3. Policy Recommendation:
Raise Target Federal Funds Rate by 25 bps
2
Economy Overview Inflation Policy RecommendationLabor Market
-10
-8
-6
-4
-2
0
2
4
6
12
13
14
15
16
17
18
19
2005 2006 2007 2008 2009 2010 2011 2012 2013 2014 2015
ContinuouslyCompoundedAnnualRateofChange
GDP(in$trillions)
GDP Real GDP growth
Source: Federal Reserve Economic Data
U.S. GDP has risen steadily at an average
rate of 2% in 2015
3
Economy Overview Inflation Policy RecommendationLabor Market
9
10
10
11
11
12
2005 2007 2009 2011 2013 2015
Consumption(in2009$trillions)
1.7
1.9
2.1
2.3
2.5
2.7
2.9
2005 2007 2009 2011 2013 2015
PrivateInvestment(in2009$trillions)
Source: Federal Reserve Economic Data
Real consumption increased at
an annual rate of 3% in the three
months ending in August…
…and real private
investment has been
increasing at a moderate pace
4
Economy Overview Inflation Policy RecommendationLabor Market
Source: Federal Reserve Economic Data
90.0
40
50
60
70
80
90
100
2005 2006 2007 2008 2009 2010 2011 2012 2013 2014 2015
Index
University of Michigan Consumer Sentiment Index
Rising consumer confidence signals optimism about
the strengthening domestic economy
5
Economy Overview Inflation Policy RecommendationLabor Market
Source: Federal Reserve Economic Data
Manufacturing sector is at its 34th consecutive
month of expansion
30
33
36
39
42
45
48
51
54
57
60
63
2005 2006 2007 2008 2009 2010 2011 2012 2013 2014 2015
Index
ISM Manufacturing PMI Composite Index
50.1
6
Economy Overview Inflation Policy RecommendationLabor Market
-900
-800
-700
-600
-500
-400
-300
2005 2006 2007 2008 2009 2010 2011 2012 2013 2014 2015
Exports(in$billions)
Source: Federal Reserve Economic Data
Real exports have experienced a decrease but
remain above pre-recession levels
7
Economy Overview Inflation Policy RecommendationLabor Market
Source: Federal Reserve Economic Data
90
95
100
105
110
115
120
125
2005 2006 2007 2008 2009 2010 2011 2012 2013 2014 2015
Index(January11977=100)
Trade Weighted U.S. Dollar Index
119.6
Appreciation in the US Dollar is driven by low
commodity prices and a slowdown in China
8
Economy Overview Inflation Policy RecommendationLabor Market
Source: Federal Reserve Economic Data
14.2
Recently US and international markets have
been less volatile
0
10
20
30
40
50
60
70
80
90
2005 2006 2007 2008 2009 2010 2011 2012 2013 2014 2015
Index
VIX
9
Economy Overview Inflation Policy RecommendationLabor Market
Source: Federal Reserve Economic Data
Unemployment rate is approaching long-run norms
0
2
4
6
8
10
12
14
16
18
2005 2006 2007 2008 2009 2010 2011 2012 2013 2014 2015
Percent
U3 = 5.1%
U4 = 5.4%
U6 = 10.0%
10
Economy Overview Inflation Policy RecommendationLabor Market
Source: Federal Reserve Economic Data
Total nonfarm payrolls employment is increasing and
has surpassed pre-recession levels
120
125
130
135
140
145
2005 2006 2007 2008 2009 2010 2011 2012 2013 2014 2015
Persons(millions)
11
Economy Overview Inflation Policy RecommendationLabor Market
0
1
2
3
4
2005 2006 2007 2008 2009 2010 2011 2012 2013 2014 2015
Persons(millions)
Layoffs and Discharges, Total Nonfarm Quits, Total Nonfarm
Source: Federal Reserve Economic Data
Workers are increasingly and voluntarily leaving jobs
12
Economy Overview Inflation Policy RecommendationLabor Market
Current Concerns About the Labor Market
Elevated Number of
Part-Time Workers
Long-Term
Unemployment
Low Labor Force
Participation
13
Economy Overview Inflation Policy RecommendationLabor Market
Source: Federal Reserve Economic Data
Decreasing unemployment rate has been attributed to a
decreasing labor force participation rate
60
61
62
63
64
65
66
67
2005 2006 2007 2008 2009 2010 2011 2012 2013 2014 2015
Participationrate(percent)
62.4%
14
Economy Overview Inflation Policy RecommendationLabor Market
Declining Labor Force Participation Rate
Cyclical Attributes
(~14%)
Unexplained
(~36%)
Structural Attributes
(~50%)
Source: “Opportunities and Challenges in the U.S. Labor Market: An Update”, Jason Furman
15
Economy Overview Inflation Policy RecommendationLabor Market
0
10
20
30
40
50
60
70
80
90
2005 2006 2007 2008 2009 2010 2011 2012 2013 2014 2015
ParticipationRate(percent)
16 to 19 years 20 to 24 years 25 to 54 years 55 years and over
Source: Federal Reserve Economic Data
Structural changes in the labor force explain much
of the low LFPR
55 years and over
16 to 19 years
20 to 24 years
16
Economy Overview Inflation Policy RecommendationLabor Market
Source: Bureau of Labor Statistics
Most of the jobs created in the
expansion are full-time jobs…
…while the number of part time
workers remained stagnant
103
105
107
109
111
113
115
117
119
121
123
2007 2008 2009 2010 2011 2012 2013 2014 2015
Full-timeworkers(millions)
22
23
24
25
26
27
28
29
2007 2008 2009 2010 2011 2012 2013 2014 2015
Part-timeworkers(millions)
17
Economy Overview Inflation Policy RecommendationLabor Market
Source: Federal Reserve Economic Data
Duration of unemployment has decreased by about
30% over the recovery
0
5
10
15
20
25
30
2005 2006 2007 2008 2009 2010 2011 2012 2013 2014 2015
Weeks
Median Duration of Unemployment
11.4
weeks
18
Economy Overview Inflation Policy RecommendationLabor Market
Wage Stagnation
Pent-up wage
deflation
hypothesis
Can improve as the
economy improves
Elevated PTER
Decreased
participation
among prime-age
workers
Remaining Slack in the
Labor Market
Other factor
19
Economy Overview Inflation Policy RecommendationLabor Market
Source: Federal Reserve Economic Data, BLS
Pent-up wage deflation hypothesis:
Wages have reacted slowly to the improvements in the labor
market
0
0.5
1
1.5
2
2.5
3
3.5
4
0 2 4 6 8 10 12
ECIGrowth(percentchange)
Unemployment Rate (percent)
Jan ‘07
Gap: -1%
Jan ‘15
20
Economy Overview Inflation Policy RecommendationLabor Market
Source: Federal Reserve Economic Data
According to Chicago Fed researchers, as the Quits Rate rises, ECI
should increase as well
0.0
0.5
1.0
1.5
2.0
2.5
3.0
0
1
2
3
4
5
2001 2003 2005 2007 2009 2011 2013 2015
QuitsRate(percentchange)
ECIWages(percentchange)
ECI Wages (left axis) Quits Rate (right axis)
21
Economy Overview Inflation Policy RecommendationLabor Market
Core PCE provides a more accurate view of the current
inflationary state than Headline PCE
Source: US. Bureau of Economic Analysis
1.3%
0.2%
-2
-1
0
1
2
3
4
5
2005 2006 2007 2008 2009 2010 2011 2012 2013 2014 2015
Percentchange
Headline Core
22
Economy Overview Inflation Policy RecommendationLabor Market
Inflation in the Service Sector is at the long-term 2% goal
while Durable Goods inflation continues to be negative
-4
-3
-2
-1
0
1
2
3
4
5
2005 2006 2007 2008 2009 2010 2011 2012 2013 2014 2015
Percentchange
Services Durables
Source: US. Bureau of Economic Analysis
1.9%
- 2.2%
23
Economy Overview Inflation Policy RecommendationLabor Market
0
1
2
3
4
5
6
2005 2006 2007 2008 2009 2010 2011 2012 2013 2014 2015
PercentChange
U. of Mich. Consumer Inflation Expectations FRB Business Inflation Expectations
Business Inflation Expectations remain near long-term target
and consumer inflation expectations remain high
3.1%
1.8%
Source: Federal Reserve Bank of Atlanta
24
Economy Overview Inflation Policy RecommendationLabor Market
Reasoning:
1. Zero bound policy is a last resort
2. The fundamentals of domestic economy are strong
3. The labor market is “on track”
4. Inflation will likely pick up as transitory headwinds dissipate
Policy Recommendation
1. Raise Federal Funds Rate target range by 25 bps
2. Continue to reinvest principal payments in agency
mortgage-backed securities
25
APPENDIX
26
Economy Overview Inflation Policy RecommendationLabor Market
0
1
2
3
2005 2006 2007 2008 2009 2010 2011 2012 2013 2014 2015
HousingUnits(millions)
Total Privately-Owned Housing Starts
Activity in the housing sector remains on a gradual
upward trend
Source: U.S. Department of Housing and Urban Development
27
Economy Overview Inflation Policy RecommendationLabor Market
Source: Federal Reserve Economic Data
Part-time work due to slack has decreased since the
recession
0
1
2
3
4
5
6
7
8
2005 2006 2007 2008 2009 2010 2011 2012 2013 2014 2015
PTER(inmillionsofworkers)
Slack Only found Part Time
Cyclical
Structural
28
Economy Overview Inflation Policy RecommendationLabor Market
Different age groups have different reasons for working
part-time voluntarily
0 10 20 30 40 50 60 70 80
Partially retired
Normal for occupations
Family
Other
Health
School
Share of Age Group (percent)
16-25 26-55 56+
Source: Federal Reserve Bank of Atlanta Data
29
Economy Overview Inflation Policy RecommendationLabor Market
0
1
2
3
4
5
2005 2006 2007 2008 2009 2010 2011 2012 2013 2014 2015
CompoundedAnualRateofChange
AHE ECI
Source: Federal Reserve Economic Data
Measures of wage growth: AHE vs ECI
30
Economy Overview Inflation Policy RecommendationLabor Market
-2.5
-2.0
-1.5
-1.0
-0.5
0.0
0.5
1.0
1.5
2.0
2000 2001 2002 2003 2004 2005 2006 2007 2008 2009 2010 2011 2012 2013 2014 2015
Percentchange
Rent CPI Case-Shiller HPI
May 2006, the peak of
the housing market
There is little evidence that housing price inflation has significantly
outpaced rent inflation since the housing market peak in 2006
Source: Federal Reserve Economic Data
31
Economy Overview Inflation Policy RecommendationLabor Market
3
3.2
3.4
3.6
3.8
4
4.2
4.4
4.6
4.8
5
-2
-1
0
1
2
3
4
5
2000 2001 2002 2003 2004 2005 2006 2007 2008 2009 2010 2011 2012 2013 2014 2015
LogRealImportedOilPrice/Barrel
PercentChange
Headline Inflation Log Real Imported Oil Price
Real imported oil prices per barrel have had historically
high correlation with inflation recently
Source: Federal Reserve Economic Data and U.S. Energy Information Administration
32
Economy Overview Inflation Policy RecommendationLabor Market
TIPS Spreads offer a market view of predicted
inflation
Source: Federal Reserve Economic Data
1.18%
1.50%
-2
-1
0
1
2
3
4
2005 2006 2007 2008 2009 2010 2011 2012 2013 2014 2015
PercentChange
5-year Break Even Inflation Rate 10-year Break Even Inflation Rate
33
Economy Overview Inflation Policy RecommendationLabor Market
0
0.5
1
1.5
2
2.5
3
3.5
4
4.5
5
2007 2008 2009 2010 2011 2012 2013 2014 2015
$trillions
Total Assets Securities Held Outright
$4.5 trn
Recent Balance Sheet Trends
$4.2 trn
Source: Federal Reserve Economic Data
34

Fed final v.f

  • 1.
    Economic Overview and MonetaryPolicy College Fed Challenge - Federal Reserve Bank of Boston November 6, 2015 1
  • 2.
    AGENDA 1. Economic Overview 2.Dual Mandate a. Labor Market and Wages b. Inflation 3. Policy Recommendation: Raise Target Federal Funds Rate by 25 bps 2
  • 3.
    Economy Overview InflationPolicy RecommendationLabor Market -10 -8 -6 -4 -2 0 2 4 6 12 13 14 15 16 17 18 19 2005 2006 2007 2008 2009 2010 2011 2012 2013 2014 2015 ContinuouslyCompoundedAnnualRateofChange GDP(in$trillions) GDP Real GDP growth Source: Federal Reserve Economic Data U.S. GDP has risen steadily at an average rate of 2% in 2015 3
  • 4.
    Economy Overview InflationPolicy RecommendationLabor Market 9 10 10 11 11 12 2005 2007 2009 2011 2013 2015 Consumption(in2009$trillions) 1.7 1.9 2.1 2.3 2.5 2.7 2.9 2005 2007 2009 2011 2013 2015 PrivateInvestment(in2009$trillions) Source: Federal Reserve Economic Data Real consumption increased at an annual rate of 3% in the three months ending in August… …and real private investment has been increasing at a moderate pace 4
  • 5.
    Economy Overview InflationPolicy RecommendationLabor Market Source: Federal Reserve Economic Data 90.0 40 50 60 70 80 90 100 2005 2006 2007 2008 2009 2010 2011 2012 2013 2014 2015 Index University of Michigan Consumer Sentiment Index Rising consumer confidence signals optimism about the strengthening domestic economy 5
  • 6.
    Economy Overview InflationPolicy RecommendationLabor Market Source: Federal Reserve Economic Data Manufacturing sector is at its 34th consecutive month of expansion 30 33 36 39 42 45 48 51 54 57 60 63 2005 2006 2007 2008 2009 2010 2011 2012 2013 2014 2015 Index ISM Manufacturing PMI Composite Index 50.1 6
  • 7.
    Economy Overview InflationPolicy RecommendationLabor Market -900 -800 -700 -600 -500 -400 -300 2005 2006 2007 2008 2009 2010 2011 2012 2013 2014 2015 Exports(in$billions) Source: Federal Reserve Economic Data Real exports have experienced a decrease but remain above pre-recession levels 7
  • 8.
    Economy Overview InflationPolicy RecommendationLabor Market Source: Federal Reserve Economic Data 90 95 100 105 110 115 120 125 2005 2006 2007 2008 2009 2010 2011 2012 2013 2014 2015 Index(January11977=100) Trade Weighted U.S. Dollar Index 119.6 Appreciation in the US Dollar is driven by low commodity prices and a slowdown in China 8
  • 9.
    Economy Overview InflationPolicy RecommendationLabor Market Source: Federal Reserve Economic Data 14.2 Recently US and international markets have been less volatile 0 10 20 30 40 50 60 70 80 90 2005 2006 2007 2008 2009 2010 2011 2012 2013 2014 2015 Index VIX 9
  • 10.
    Economy Overview InflationPolicy RecommendationLabor Market Source: Federal Reserve Economic Data Unemployment rate is approaching long-run norms 0 2 4 6 8 10 12 14 16 18 2005 2006 2007 2008 2009 2010 2011 2012 2013 2014 2015 Percent U3 = 5.1% U4 = 5.4% U6 = 10.0% 10
  • 11.
    Economy Overview InflationPolicy RecommendationLabor Market Source: Federal Reserve Economic Data Total nonfarm payrolls employment is increasing and has surpassed pre-recession levels 120 125 130 135 140 145 2005 2006 2007 2008 2009 2010 2011 2012 2013 2014 2015 Persons(millions) 11
  • 12.
    Economy Overview InflationPolicy RecommendationLabor Market 0 1 2 3 4 2005 2006 2007 2008 2009 2010 2011 2012 2013 2014 2015 Persons(millions) Layoffs and Discharges, Total Nonfarm Quits, Total Nonfarm Source: Federal Reserve Economic Data Workers are increasingly and voluntarily leaving jobs 12
  • 13.
    Economy Overview InflationPolicy RecommendationLabor Market Current Concerns About the Labor Market Elevated Number of Part-Time Workers Long-Term Unemployment Low Labor Force Participation 13
  • 14.
    Economy Overview InflationPolicy RecommendationLabor Market Source: Federal Reserve Economic Data Decreasing unemployment rate has been attributed to a decreasing labor force participation rate 60 61 62 63 64 65 66 67 2005 2006 2007 2008 2009 2010 2011 2012 2013 2014 2015 Participationrate(percent) 62.4% 14
  • 15.
    Economy Overview InflationPolicy RecommendationLabor Market Declining Labor Force Participation Rate Cyclical Attributes (~14%) Unexplained (~36%) Structural Attributes (~50%) Source: “Opportunities and Challenges in the U.S. Labor Market: An Update”, Jason Furman 15
  • 16.
    Economy Overview InflationPolicy RecommendationLabor Market 0 10 20 30 40 50 60 70 80 90 2005 2006 2007 2008 2009 2010 2011 2012 2013 2014 2015 ParticipationRate(percent) 16 to 19 years 20 to 24 years 25 to 54 years 55 years and over Source: Federal Reserve Economic Data Structural changes in the labor force explain much of the low LFPR 55 years and over 16 to 19 years 20 to 24 years 16
  • 17.
    Economy Overview InflationPolicy RecommendationLabor Market Source: Bureau of Labor Statistics Most of the jobs created in the expansion are full-time jobs… …while the number of part time workers remained stagnant 103 105 107 109 111 113 115 117 119 121 123 2007 2008 2009 2010 2011 2012 2013 2014 2015 Full-timeworkers(millions) 22 23 24 25 26 27 28 29 2007 2008 2009 2010 2011 2012 2013 2014 2015 Part-timeworkers(millions) 17
  • 18.
    Economy Overview InflationPolicy RecommendationLabor Market Source: Federal Reserve Economic Data Duration of unemployment has decreased by about 30% over the recovery 0 5 10 15 20 25 30 2005 2006 2007 2008 2009 2010 2011 2012 2013 2014 2015 Weeks Median Duration of Unemployment 11.4 weeks 18
  • 19.
    Economy Overview InflationPolicy RecommendationLabor Market Wage Stagnation Pent-up wage deflation hypothesis Can improve as the economy improves Elevated PTER Decreased participation among prime-age workers Remaining Slack in the Labor Market Other factor 19
  • 20.
    Economy Overview InflationPolicy RecommendationLabor Market Source: Federal Reserve Economic Data, BLS Pent-up wage deflation hypothesis: Wages have reacted slowly to the improvements in the labor market 0 0.5 1 1.5 2 2.5 3 3.5 4 0 2 4 6 8 10 12 ECIGrowth(percentchange) Unemployment Rate (percent) Jan ‘07 Gap: -1% Jan ‘15 20
  • 21.
    Economy Overview InflationPolicy RecommendationLabor Market Source: Federal Reserve Economic Data According to Chicago Fed researchers, as the Quits Rate rises, ECI should increase as well 0.0 0.5 1.0 1.5 2.0 2.5 3.0 0 1 2 3 4 5 2001 2003 2005 2007 2009 2011 2013 2015 QuitsRate(percentchange) ECIWages(percentchange) ECI Wages (left axis) Quits Rate (right axis) 21
  • 22.
    Economy Overview InflationPolicy RecommendationLabor Market Core PCE provides a more accurate view of the current inflationary state than Headline PCE Source: US. Bureau of Economic Analysis 1.3% 0.2% -2 -1 0 1 2 3 4 5 2005 2006 2007 2008 2009 2010 2011 2012 2013 2014 2015 Percentchange Headline Core 22
  • 23.
    Economy Overview InflationPolicy RecommendationLabor Market Inflation in the Service Sector is at the long-term 2% goal while Durable Goods inflation continues to be negative -4 -3 -2 -1 0 1 2 3 4 5 2005 2006 2007 2008 2009 2010 2011 2012 2013 2014 2015 Percentchange Services Durables Source: US. Bureau of Economic Analysis 1.9% - 2.2% 23
  • 24.
    Economy Overview InflationPolicy RecommendationLabor Market 0 1 2 3 4 5 6 2005 2006 2007 2008 2009 2010 2011 2012 2013 2014 2015 PercentChange U. of Mich. Consumer Inflation Expectations FRB Business Inflation Expectations Business Inflation Expectations remain near long-term target and consumer inflation expectations remain high 3.1% 1.8% Source: Federal Reserve Bank of Atlanta 24
  • 25.
    Economy Overview InflationPolicy RecommendationLabor Market Reasoning: 1. Zero bound policy is a last resort 2. The fundamentals of domestic economy are strong 3. The labor market is “on track” 4. Inflation will likely pick up as transitory headwinds dissipate Policy Recommendation 1. Raise Federal Funds Rate target range by 25 bps 2. Continue to reinvest principal payments in agency mortgage-backed securities 25
  • 26.
  • 27.
    Economy Overview InflationPolicy RecommendationLabor Market 0 1 2 3 2005 2006 2007 2008 2009 2010 2011 2012 2013 2014 2015 HousingUnits(millions) Total Privately-Owned Housing Starts Activity in the housing sector remains on a gradual upward trend Source: U.S. Department of Housing and Urban Development 27
  • 28.
    Economy Overview InflationPolicy RecommendationLabor Market Source: Federal Reserve Economic Data Part-time work due to slack has decreased since the recession 0 1 2 3 4 5 6 7 8 2005 2006 2007 2008 2009 2010 2011 2012 2013 2014 2015 PTER(inmillionsofworkers) Slack Only found Part Time Cyclical Structural 28
  • 29.
    Economy Overview InflationPolicy RecommendationLabor Market Different age groups have different reasons for working part-time voluntarily 0 10 20 30 40 50 60 70 80 Partially retired Normal for occupations Family Other Health School Share of Age Group (percent) 16-25 26-55 56+ Source: Federal Reserve Bank of Atlanta Data 29
  • 30.
    Economy Overview InflationPolicy RecommendationLabor Market 0 1 2 3 4 5 2005 2006 2007 2008 2009 2010 2011 2012 2013 2014 2015 CompoundedAnualRateofChange AHE ECI Source: Federal Reserve Economic Data Measures of wage growth: AHE vs ECI 30
  • 31.
    Economy Overview InflationPolicy RecommendationLabor Market -2.5 -2.0 -1.5 -1.0 -0.5 0.0 0.5 1.0 1.5 2.0 2000 2001 2002 2003 2004 2005 2006 2007 2008 2009 2010 2011 2012 2013 2014 2015 Percentchange Rent CPI Case-Shiller HPI May 2006, the peak of the housing market There is little evidence that housing price inflation has significantly outpaced rent inflation since the housing market peak in 2006 Source: Federal Reserve Economic Data 31
  • 32.
    Economy Overview InflationPolicy RecommendationLabor Market 3 3.2 3.4 3.6 3.8 4 4.2 4.4 4.6 4.8 5 -2 -1 0 1 2 3 4 5 2000 2001 2002 2003 2004 2005 2006 2007 2008 2009 2010 2011 2012 2013 2014 2015 LogRealImportedOilPrice/Barrel PercentChange Headline Inflation Log Real Imported Oil Price Real imported oil prices per barrel have had historically high correlation with inflation recently Source: Federal Reserve Economic Data and U.S. Energy Information Administration 32
  • 33.
    Economy Overview InflationPolicy RecommendationLabor Market TIPS Spreads offer a market view of predicted inflation Source: Federal Reserve Economic Data 1.18% 1.50% -2 -1 0 1 2 3 4 2005 2006 2007 2008 2009 2010 2011 2012 2013 2014 2015 PercentChange 5-year Break Even Inflation Rate 10-year Break Even Inflation Rate 33
  • 34.
    Economy Overview InflationPolicy RecommendationLabor Market 0 0.5 1 1.5 2 2.5 3 3.5 4 4.5 5 2007 2008 2009 2010 2011 2012 2013 2014 2015 $trillions Total Assets Securities Held Outright $4.5 trn Recent Balance Sheet Trends $4.2 trn Source: Federal Reserve Economic Data 34