
Report
Share
Download to read offline
Recommended
Recommended
More Related Content
Similar to February 2014 The Woodlands Market Report
Similar to February 2014 The Woodlands Market Report (20)
More from Debra Wymore
More from Debra Wymore (14)
Recently uploaded
Recently uploaded (20)
BDSM⚡Call Girls in Sector 57 Noida Escorts >༒8448380779 Escort Service
BDSM⚡Call Girls in Sector 57 Noida Escorts >༒8448380779 Escort Service
9990771857 Call Girls in Dwarka Sector 3 Delhi (Call Girls) Delhi
9990771857 Call Girls in Dwarka Sector 3 Delhi (Call Girls) Delhi
9990771857 Call Girls in Dwarka Sector 2 Delhi (Call Girls) Delhi
9990771857 Call Girls in Dwarka Sector 2 Delhi (Call Girls) Delhi
Call Girls In Mayur Vihar Delhi ☆↫8447779280 ❤Escorts Service In Delhi
Call Girls In Mayur Vihar Delhi ☆↫8447779280 ❤Escorts Service In Delhi
Best Deal Virtual Space in Satya The Hive Tata Zudio 750 Sqft 1.89 Cr All inc...
Best Deal Virtual Space in Satya The Hive Tata Zudio 750 Sqft 1.89 Cr All inc...
call girls in ganesh nagar Delhi 8264348440 ✅ call girls ❤️
call girls in ganesh nagar Delhi 8264348440 ✅ call girls ❤️
Call Girls in shastri nagar Delhi 8264348440 ✅ call girls ❤️
Call Girls in shastri nagar Delhi 8264348440 ✅ call girls ❤️
Magarpatta Nova Elegance Mundhwa Pune E-Brochure.pdf
Magarpatta Nova Elegance Mundhwa Pune E-Brochure.pdf
Low Rate ↬Call Girls in Trilokpuri Delhi ↫8447779280}Escorts Service In Delhi
Low Rate ↬Call Girls in Trilokpuri Delhi ↫8447779280}Escorts Service In Delhi
Girls in Kalyanpuri }Delhi↫8447779280↬Escort Service. In Delhi NCR
Girls in Kalyanpuri }Delhi↫8447779280↬Escort Service. In Delhi NCR
9990771857 Call Girls in Dwarka Sector 1 Delhi (Call Girls) Delhi
9990771857 Call Girls in Dwarka Sector 1 Delhi (Call Girls) Delhi
9990771857 Call Girls in Dwarka Sector 6 Delhi (Call Girls) Delhi
9990771857 Call Girls in Dwarka Sector 6 Delhi (Call Girls) Delhi
Shapoorji Pallonji Joyville Vista Pune | Spend Your Family Time Together
Shapoorji Pallonji Joyville Vista Pune | Spend Your Family Time Together
Call Girls In Laxmi Nagar Delhi +91-8447779280! !Best Woman Seeking Man Escor...
Call Girls In Laxmi Nagar Delhi +91-8447779280! !Best Woman Seeking Man Escor...
Call Girls in Karkardooma Delhi +91 84487779280}Woman Seeking Man in Delhi NCR
Call Girls in Karkardooma Delhi +91 84487779280}Woman Seeking Man in Delhi NCR
Kohinoor Flats In Hinjewadi Phase 2 | Homes Built To Suit Your Needs
Kohinoor Flats In Hinjewadi Phase 2 | Homes Built To Suit Your Needs
TENANT SCREENING REPORT SERVICES How Tenant Screening Reports Work
TENANT SCREENING REPORT SERVICES How Tenant Screening Reports Work
February 2014 The Woodlands Market Report
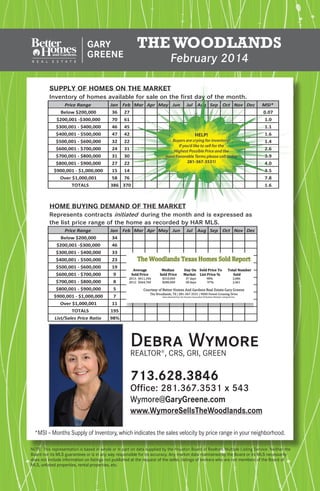
- 1. The Woodlands February 2014 SUPPLY OF HOMES ON THE MARKET Inventory of homes available for sale on the first day of the month. Price Range Jan Feb Mar Apr May Jun Jul Aug Sep Oct Nov Dec MSI* Below $200,000 36 27 $200,001 -$300,000 70 61 0.07 1.0 $300,001 - $400,000 46 45 1.1 $400,001 - $500,000 47 42 1.6 $500,001 - $600,000 32 22 1.4 $600,001 - $700,000 24 31 2.6 $700,001 - $800,000 31 30 3.9 $800,001 - $900,000 27 22 4.0 $900,001 - $1,000,000 15 14 3.5 Over $1,000,001 58 76 7.8 386 370 1.6 TOTALS HOME BUYING DEMAND OF THE MARKET Represents contracts initiated during the month and is expressed as the list price range of the home as recorded by HAR MLS. Price Range Jan Feb Mar Apr May Jun Below $200,000 Jul Aug Sep Oct Nov Dec 34 $200,001 -$300,000 46 $300,001 - $400,000 33 $400,001 - $500,000 23 $500,001 - $600,000 19 $600,001 - $700,000 9 $700,001 - $800,000 8 $800,001 - $900,000 5 $900,001 - $1,000,000 7 Over $1,000,001 TOTALS List/Sales Price Ratio 11 195 98% Debra GRI, GREEN Wymore REALTOR , CRS, ® 713.628.3846 Office: 281.367.3531 x 543 Wymore@GaryGreene.com www.WymoreSellsTheWoodlands.com *MSI – Months Supply of Inventory, which indicates the sales velocity by price range in your neighborhood. NOTE: This representation is based in whole or in part on data supplied by the Houston Board of Realtors Multiple Listing Service. Neither the Board nor its MLS guarantees or is in any way responsible for its accuracy. Any market data maintained by the Board or its MLS necessarily does not include information on listings not published at the request of the seller, listings of brokers who are not members of the Board of MLS, unlisted properties, rental properties, etc.