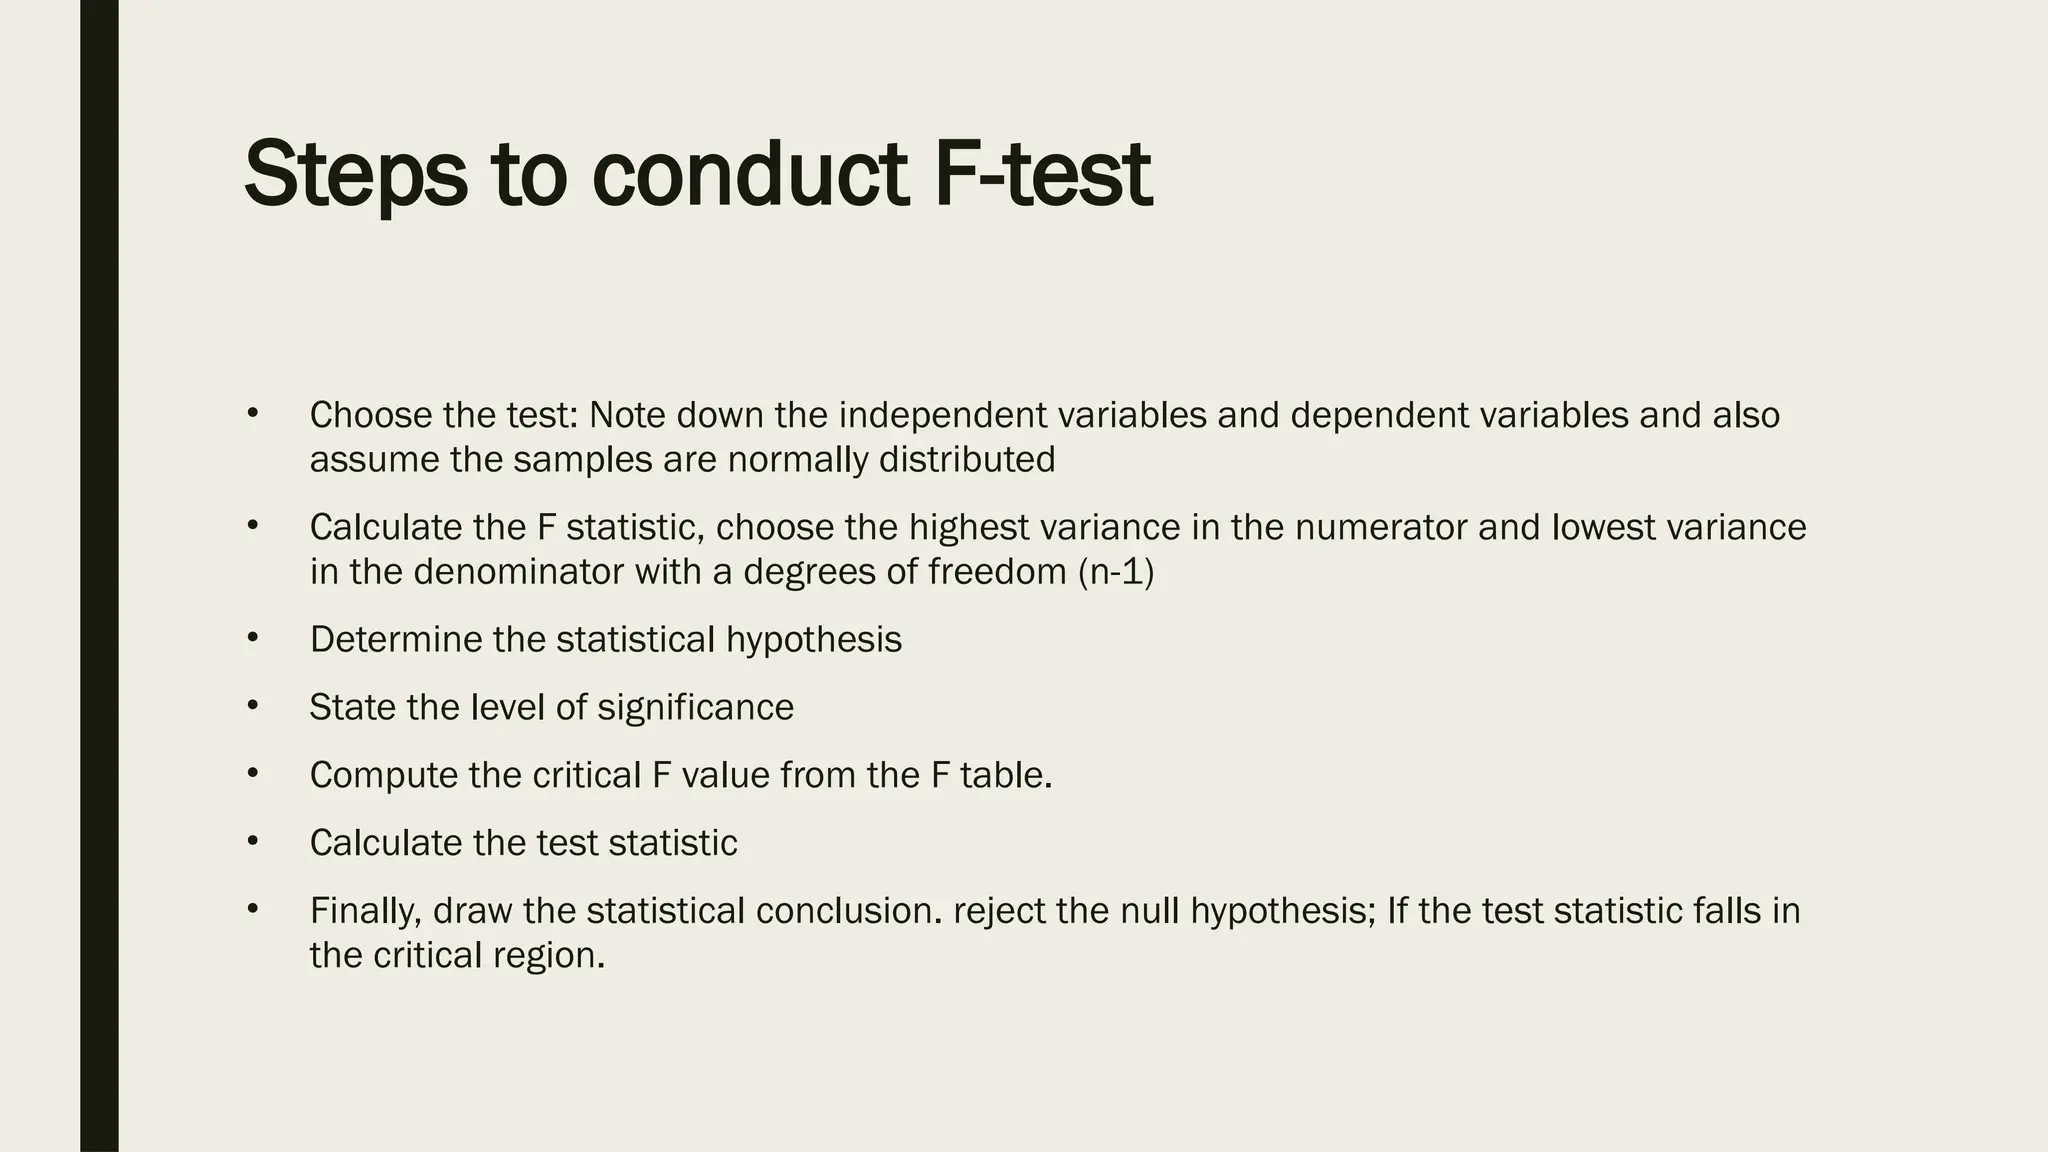
F- TEST
Submitted by,
K.Parkavi
INTRODUCTION
• The F-test was developed by R.A. Fisher.
• The F test is used to check the equality of variances using hypothesis testing.
• F value is based on the ratio of two variance. So, it is also known as variance ratio test.
Objectives
• A two-tailed F test is used to check whether the variances of the two given samples (or
populations) are equal or not.
• However, if an F test checks whether one population variance is either greater than or
lesser than the other, it becomes a one-tailed hypothesis f test.
The following conditions are critical for using the F test to compare the variance of two
populations
1. Normality: the populations must have a normal distribution.
2. Independent and random selection of sample items: the selection of the samples
components should be independent and random.
3. More than unity: the variance ratio must be one or larger than one. It cannot be less
than one. When dividing variance estimate, smaller estimates divide the larger
estimates of variances.
4. The additive property states that the total of different variance components will equal
the total variance, i.e., the total variance between samples and the variance within
samples.
Formula
• F statistic for large samples: F = σ1²/ σ2² ( σ1²>σ2² )
where, σ1² is the variance of the first population,
σ2² is the variance of the second population,
• F statistic for small samples: F = s1²/s2² ( s1²>s2² )
Where, s1² is the variance of the first sample
s2² is the variance of the second sample.
• Variance is square root of standard deviation
• s² = ∑(x- )²/n-1
x̄
• Degree of freedom (ν)
• ν1 (nominator)= n1-1 (larger variance)
• ν2 (denominator)= n2-1( small variance)
• Now the calculated F value will be compared with tabulated F value for ν1 and ν2 at 1%
or 5% level of significance.
• If Calculated F value < table F value
• Null hypothesis is accepted and there is no significant difference between two
variables.
• If calculated F value > table F value
• Null hypothesis is rejected and there is significant difference between two variables.
Properties of F- distribution
• The F-distribution curve is positively skewed towards the right with a range of 0 to ∞
and having roughly the median value 1.
• The value of F is always positive or zero. No negative values.
• The shape of the distribution depends on the degrees of freedom of numerator ν1
and denominator ν2.
• The degree of skewness decreased with an increase in degrees of freedom of the
numerator and denominator.
• The f-distribution curve can never be symmetrical; if degrees of freedom increase it
will be more similar to the symmetrical.
Uses of F -Test
• There are different types of F tests, each for a different purpose.
• In statistics, an F-test of equality of variances is a test for the null hypothesis that
two normal populations have the same variance.
• F-test is to test the equality of several means. While ANOVA uses to test the equality
of means.
• F-tests for linear regression models are to test whether any of the independent
variables in the multiple linear regression are significant or not. It also indicates a
linear relationship between the dependent variable and at least one of the
independent variables.
Steps to conduct F-test
• Choose the test: Note down the independent variables and dependent variables and also
assume the samples are normally distributed
• Calculate the F statistic, choose the highest variance in the numerator and lowest variance
in the denominator with a degrees of freedom (n-1)
• Determine the statistical hypothesis
• State the level of significance
• Compute the critical F value from the F table.
• Calculate the test statistic
• Finally, draw the statistical conclusion. reject the null hypothesis; If the test statistic falls in
the critical region.
Question :1
Two random samples were drawn from two normal populations and their values are
Test whether the two populations have the same variance at 5% level of significance.
A 16 17 25 26 32 34 38 40 42
B 14 16 24 28 32 35 37 42 43 45 47
Solution:
Given data
A – 16,17,25,26,32,34,38,40,42
n=9
= 270/9= 30
x̄
B – 14,16,24,28,32,35,37,42,43,45,47
n= 11
= 363/11= 33
x̄
A (x- )
x̄ (x-x̄)² B (x-x̄) (x-x̄)²
16
17
25
26
32
34
38
40
42
-14
-13
- 5
- 4
2
4
8
10
12
196
169
25
16
4
16
64
100
144
14
16
24
28
32
35
37
42
43
45
47
-19
-17
-9
-5
-1
2
4
9
10
12
14
360
289
81
25
1
4
16
81
100
144
196
270 ∑(x-x)²=
̄ 734 363 ∑(x-x)² = 1298
̄
 F = s1²/s2² ( s1²>s2² ) s² = ∑(x- )²/n-1
x̄
 s2²= 734/8 = 91 .75
 s1² = 1298/10= 129.8
 F= 129.8/ 91.75
 F= 1.4147 (Calculated F value)
 ν1=11-1 = 10
 ν2=9-1 = 8
 F0.05= 3.35(Tabulated value )
Result:
 The calculated value is smaller than tabulated value.
 So, null hypothesis is accepted.
 Two population have same variance.
Thank you

F- TEST, Properties, Uses, and the Examples

  • 1.
  • 2.
    INTRODUCTION • The F-testwas developed by R.A. Fisher. • The F test is used to check the equality of variances using hypothesis testing. • F value is based on the ratio of two variance. So, it is also known as variance ratio test. Objectives • A two-tailed F test is used to check whether the variances of the two given samples (or populations) are equal or not. • However, if an F test checks whether one population variance is either greater than or lesser than the other, it becomes a one-tailed hypothesis f test.
  • 3.
    The following conditionsare critical for using the F test to compare the variance of two populations 1. Normality: the populations must have a normal distribution. 2. Independent and random selection of sample items: the selection of the samples components should be independent and random. 3. More than unity: the variance ratio must be one or larger than one. It cannot be less than one. When dividing variance estimate, smaller estimates divide the larger estimates of variances. 4. The additive property states that the total of different variance components will equal the total variance, i.e., the total variance between samples and the variance within samples.
  • 4.
    Formula • F statisticfor large samples: F = σ1²/ σ2² ( σ1²>σ2² ) where, σ1² is the variance of the first population, σ2² is the variance of the second population, • F statistic for small samples: F = s1²/s2² ( s1²>s2² ) Where, s1² is the variance of the first sample s2² is the variance of the second sample.
  • 5.
    • Variance issquare root of standard deviation • s² = ∑(x- )²/n-1 x̄ • Degree of freedom (ν) • ν1 (nominator)= n1-1 (larger variance) • ν2 (denominator)= n2-1( small variance)
  • 6.
    • Now thecalculated F value will be compared with tabulated F value for ν1 and ν2 at 1% or 5% level of significance. • If Calculated F value < table F value • Null hypothesis is accepted and there is no significant difference between two variables. • If calculated F value > table F value • Null hypothesis is rejected and there is significant difference between two variables.
  • 7.
    Properties of F-distribution • The F-distribution curve is positively skewed towards the right with a range of 0 to ∞ and having roughly the median value 1. • The value of F is always positive or zero. No negative values. • The shape of the distribution depends on the degrees of freedom of numerator ν1 and denominator ν2. • The degree of skewness decreased with an increase in degrees of freedom of the numerator and denominator. • The f-distribution curve can never be symmetrical; if degrees of freedom increase it will be more similar to the symmetrical.
  • 9.
    Uses of F-Test • There are different types of F tests, each for a different purpose. • In statistics, an F-test of equality of variances is a test for the null hypothesis that two normal populations have the same variance. • F-test is to test the equality of several means. While ANOVA uses to test the equality of means. • F-tests for linear regression models are to test whether any of the independent variables in the multiple linear regression are significant or not. It also indicates a linear relationship between the dependent variable and at least one of the independent variables.
  • 10.
    Steps to conductF-test • Choose the test: Note down the independent variables and dependent variables and also assume the samples are normally distributed • Calculate the F statistic, choose the highest variance in the numerator and lowest variance in the denominator with a degrees of freedom (n-1) • Determine the statistical hypothesis • State the level of significance • Compute the critical F value from the F table. • Calculate the test statistic • Finally, draw the statistical conclusion. reject the null hypothesis; If the test statistic falls in the critical region.
  • 11.
    Question :1 Two randomsamples were drawn from two normal populations and their values are Test whether the two populations have the same variance at 5% level of significance. A 16 17 25 26 32 34 38 40 42 B 14 16 24 28 32 35 37 42 43 45 47
  • 12.
    Solution: Given data A –16,17,25,26,32,34,38,40,42 n=9 = 270/9= 30 x̄ B – 14,16,24,28,32,35,37,42,43,45,47 n= 11 = 363/11= 33 x̄
  • 13.
    A (x- ) x̄(x-x̄)² B (x-x̄) (x-x̄)² 16 17 25 26 32 34 38 40 42 -14 -13 - 5 - 4 2 4 8 10 12 196 169 25 16 4 16 64 100 144 14 16 24 28 32 35 37 42 43 45 47 -19 -17 -9 -5 -1 2 4 9 10 12 14 360 289 81 25 1 4 16 81 100 144 196 270 ∑(x-x)²= ̄ 734 363 ∑(x-x)² = 1298 ̄
  • 14.
     F =s1²/s2² ( s1²>s2² ) s² = ∑(x- )²/n-1 x̄  s2²= 734/8 = 91 .75  s1² = 1298/10= 129.8  F= 129.8/ 91.75  F= 1.4147 (Calculated F value)  ν1=11-1 = 10  ν2=9-1 = 8  F0.05= 3.35(Tabulated value )
  • 16.
    Result:  The calculatedvalue is smaller than tabulated value.  So, null hypothesis is accepted.  Two population have same variance.
  • 17.