
More Related Content
Viewers also liked
Similar to Excel test
Similar to Excel test (15)
Excel test
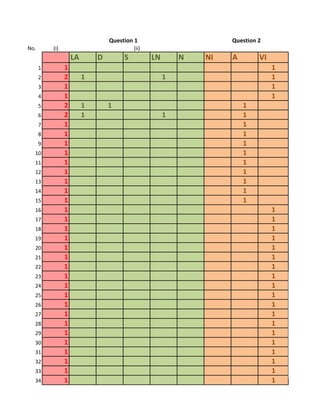
- 1. Question 1 Question 2 No. (i) (ii) LA D S LN N NI A VI 1 1 1 2 2 1 1 1 3 1 1 4 1 1 5 2 1 1 1 6 2 1 1 1 7 1 1 8 1 1 9 1 1 10 1 1 11 1 1 12 1 1 13 1 1 14 1 1 15 1 1 16 1 1 17 1 1 18 1 1 19 1 1 20 1 1 21 1 1 22 1 1 23 1 1 24 1 1 25 1 1 26 1 1 27 1 1 28 1 1 29 1 1 30 1 1 31 1 1 32 1 1 33 1 1 34 1 1
- 2. 35 1 1 36 2 1 1 1 37 2 1 1 1 38 2 1 1 1 39 2 1 1 1 40 2 1 1 1 41 2 1 1 1 42 2 1 1 1 43 2 1 1 1 44 2 1 1 1 45 2 1 1 1 46 2 1 1 1 47 2 1 1 1 48 2 1 1 1 49 2 1 1 1 50 1 1 1 1
- 3. 1) (i) Are you satisfied with the UBD ATM machines provided? No.of people Percentage (%) Yes 33 66 No 17 34 Total 50 100 PEOPLE'S SATISFACTION 35 33 30 No.of people 25 20 17 15 No.of people 10 5 0 Yes No 1) (ii) Reasons for choosing NO :- No.of peoplePercentage(%) LA 18 50 D 10 28 S 0 0 LN 8 22 N 0 0 Total 36 100 Reasons for choosing NO 20 18 18 16 14 No.of people 12 10 10 8 8 No.of people 6 4 2 0 0 0 LA D S LN N
- 4. 2) Importance of ATM machines in UBD No.of people Percentage (%) NI 1 2 A 18 36 VI 31 62 Total 50 100 Importance of ATM 35 31 30 25 No.of people 20 18 15 No.of people 10 5 1 0 NI A VI
- 5. Code Yes 1 No 2 Code Limited range of bank account LA Distance D Safety S Limited number of ATM machine LN None N Code Not important NI Average I Very important VI