Downloaded 1,633 times
![Aim
Todeterminetheoptimumcoagulantdosageforclarifyingthegivensampleofwaterbyusingalumasthecoagulant
andperformingthejartestexperiment.
Principle
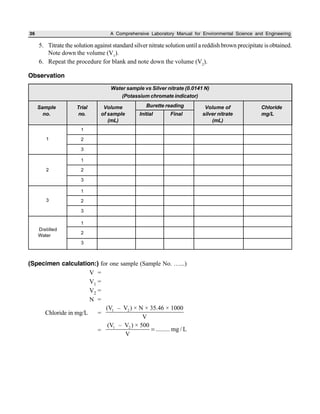
Coagulants are used in water treatment plants
(i) to remove natural suspended and colloidal matter,
(ii) to remove material which do not settle in plain sedimentation, and
(iii) to assist in filtration.
Alum [Al2(SO4)3. 18H2O] is the most widely used coagulant. When alum solution is added to water, the
moleculesdissociatetoyield 2–
4SO andAl3+
.The+vespeciescombinewithnegativelychargedcolloidaltoneutralise
part of the charge on the colloidal particle. Thus, agglomeration takes place. Coagulation is a quite complex
phenomenonandthecoagulantshouldbedistributeduniformlythroughoutthesolution.Aflashmixaccomplishes
this.
Jartestissimpledeviceusedtodeterminethisoptimumcoagulantdoserequired.Thejartest,deviceconsists
ofanumberofstirrers(4to6)providedwithpaddles.Thepaddlescanberotatedwithvaryingspeedwiththehelp
of a motor and regulator. Samples will be taken in jars or beakers and varying dose of coagulant will be added
simultaneously to all the jars. The paddles will be rotated at 100 rpm for 1 minute and at 40 rpm for 20 to 30
minutes, corresponding to the flash mixing and slow mixing in the flocculator of the treatment plant. After 30
minutessettling,supernatantwillbetakencarefullyfromallthejarstomeasureturbidity.Thedose,whichgivesthe
leastturbidity,istakenastheoptimumcoagulantdose.
Apparatus
1. Jar test apparatus 2. Glass beakers
3. Pipette 4. Nephelometer
5. pH meter
JAR TEST FOR DETERMINING OPTIMUM
COAGULANT DOSAGE
Experiment No. ___________________ Date ___________________](https://image.slidesharecdn.com/eelabmanual-150508172603-lva1-app6891/85/Environmental-Engineering-Lab-Manual-38-320.jpg)

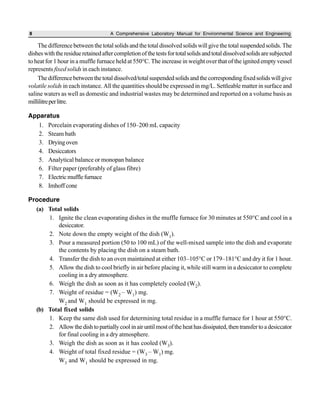
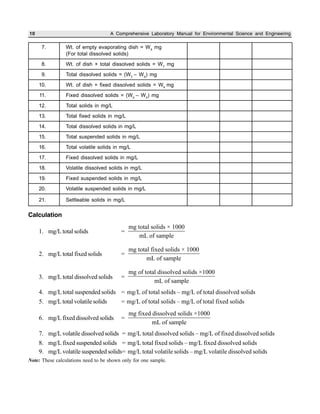
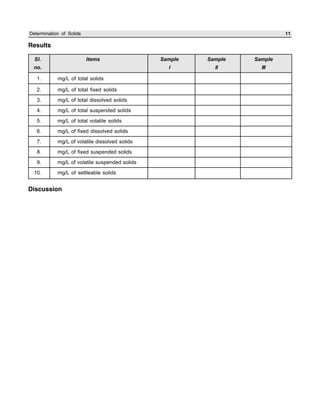
The document outlines procedures for determining various types of solids in water samples, including total solids, fixed solids, volatile solids, total dissolved solids, suspended solids, and settleable solids. Total solids include all materials retained after evaporation and drying of a sample. Fixed solids are the residues remaining after ignition, while volatile solids are lost during ignition. The procedures involve filtering samples, evaporating filtrates to determine dissolved fractions, and weighing residues to calculate concentrations.