Beginners Guide to TikTok for Search - Rachel Pearson - We are Tilt __ Bright...
Environment Graphs July 2010
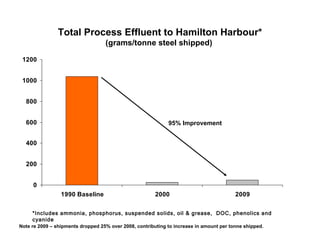
1. *Includes ammonia, phosphorus, suspended solids, oil & grease, DOC, phenolics and cyanide Total Process Effluent to Hamilton Harbour* (grams/tonne steel shipped) Note re 2009 – shipments dropped 25% over 2008, contributing to increase in amount per tonne shipped. 95% Improvement
2. Note re 2009 – shipments dropped 25% over 2008, contributing to increase in amount per tonne shipped. 78% Improvement
4. * Includes point, fugitive and materials handling sources. Note re 2009 – shipments dropped 25% over 2008, contributing to increase in amount per tonne shipped. 35% Improvement
5. Note re 2009 – shipments dropped 25% over 2008, contributing to increase in amount per tonne shipped. No improvement in intensity, but loading dropped by 800 tonnes*
6. Note re 2009 – shipments dropped 25% over 2008, contributing to increase in amount per tonne shipped. 33% Improvement
7. GHG* Emissions (kg/tonne steel shipped) * Includes CO 2 , CH 4 , N 2 O Note re 2009 – shipments dropped 25% over 2008, contributing to increase in amount per tonne shipped. 12% Improvement