This document provides an overview of the Xymon monitoring tool. It describes Xymon's history and capabilities for monitoring services and components across networks. Key features include alerting via web, email, and SMS; functional monitoring; integration with Remedy for ticket linking; and reporting on acknowledge alerts, incidents, and availability. The document also discusses Xymon's licensing as open source and customization for Orange Business Services.
Somasekhara has over 5 years of experience in IT monitoring and administration. He has worked with tools like SolarWinds Orion, CA Nimsoft, NetQoS, Splunk, and ServiceNow. His responsibilities have included monitoring networks and applications, configuring monitoring tools, creating alerts and reports, and troubleshooting issues. He currently works as a senior infrastructure developer at Cognizant, where he monitors tools and infrastructure, generates reports, and follows ITIL processes.
The document discusses web servers and their key components and functions. It covers:
1) The definition of a web server as a program that generates and transmits responses to client requests for web resources by parsing requests, authorizing access, and constructing responses.
2) How web servers handle client requests through steps like parsing requests, authorizing access, and transmitting responses. They can also dynamically generate responses through server-side includes and server scripts.
3) Techniques web servers use like access control through authentication and authorization, passing data to scripts, using cookies, caching responses, and allocating resources through event-driven, process-driven, and hybrid architectures.
The document discusses various tools for monitoring IBM Cognos TM1 servers, including:
1) Using JMeter with the TM1 plugin to monitor servers dynamically or analyze log files statically.
2) Using the TM1 Operations Console to monitor application server metrics and configure watchdog rules to kill processes.
3) Checking the }ClientProperties cube or enabling login logging to monitor user activity.
4) Configuring Windows Error Reporting to capture crash dumps without additional software.
The document discusses use case diagrams and their components. It defines use cases, actors, and associations. It explains how to structure use cases using generalization, include, and extend relationships. The include relationship extracts common behaviors, while extend adds optional or conditional behaviors. Well-structured use case diagrams can form the basis for software requirements.
The document discusses collaborative security for protecting financial critical infrastructures. It describes how financial institutions are increasingly exposed to coordinated cyber attacks. It then introduces the CoMiFin platform, which uses semantic rooms to allow financial organizations to collaboratively monitor for threats, detect fraud, and share threat information in real time. Key features of the CoMiFin platform include its use of private and public cloud deployments, its complex event processing capabilities through tools like AGILIS and Esper, and its semantic rooms for detecting specific attacks like stealthy port scanning and correlating fraud events across organizations. The platform has received several awards and has been evaluated positively by major financial organizations for its potential business value.
Hello everyone,
I'm Darshan,
This video is about presentation and demonstration of simulation project Car Black Box that I have developed during Embedded Systems internship conducted by Emertxe Information Technologies.
This a microcontroller project in which microcontroller PIC16F877A is used.
Black Box implementation in an Automotive System to log critical events. This will help in pro-active vehicle monitoring and maintenance.
The concept of Black Box is mainly heard by us in case of Aero-planes. Upon a catastrophe the Black Box is used to analyze the root cause of the issue. However, the purpose of Black Box can go beyond catastrophe analysis. Also known as an event data recorder (EDR) or Accident data recorder (ADR) the Black Box can be installed in some automobiles to record various events. These events which are electronically sensed can often pro-actively detect any issue in the vehicle (ex: Engine fault) or monitor the fleet (ex: Drive over speeding), thereby doing pro-active maintenance of the Automotive vehicle.
For source code check this:
https://github.com/DarshanGhorpade/Car-Black-Box
Guard Patrol Products has over 30 years of experience providing time management and security solutions to customers across various sectors. They offer a range of time recording products called TimePilot that utilize iButton technology for employees to easily clock in and out. These products include the Tap+, Vetro, and Extreme clocks that can either be used standalone or connected to their TimePilot software over a network. The software provides reporting of work hours and absences to help with payroll processing. Guard Patrol also offers services like system design, training, and technical support.
This document provides instructions on how to use the Reliability Monitor and Performance Monitor tools in Windows to monitor system reliability and performance. It describes how Reliability Monitor calculates a System Stability Index and provides a stability report. It also explains how to open Performance Monitor to view performance data in real time or from log files, and how to connect to remote computers to monitor them. The document recommends increasing monitoring capabilities using Data Collector Sets to store log and trace information as well as general alerts.
OPENSESAME: Unlocking Smartphone Through Handwaving BiometricsNandu B Rajan
This document proposes OpenSesame, a system for unlocking smartphones through handwaving biometrics. It analyzes handwaving patterns collected from 200 users to find unique characteristics. OpenSesame extracts four statistical features from handwaving data using sensors. It uses support vector machines to accurately classify users based on their waving patterns within 1-2 seconds. Experiments show OpenSesame achieves low false positive rates of around 5% on average.
It is well known that transporting dry dusty materials can create explosive atmospheres. Four conditions have to exist in order for the explosive state to occur. First of all, there needs to be high concentration of dust, then there must be oxygen and there should also be an ignition source. If all of these appear in a confined space – an explosion will happen. The most common ignition sources have long been identified as over-heated bearings, misaligned belt, slipping belt and misaligned pulleys.
HP OpenView Operations (HP OV) is a flexible monitoring software that helps system administrators detect and solve problems in networks, systems, and applications. It can be configured to meet the needs of any IT organization. System administrators can expand its capabilities by integrating third-party management applications. OV collects data from managed nodes and uses this to generate messages about events. It can then initiate automatic or manual actions to address problems.
Ibm Tivoli Endpoint Manager Executive SummaryTalyam
IBM's Tivoli Endpoint Manager provides comprehensive endpoint management through a single solution. It allows organizations to discover, inventory, patch, deploy operating systems, and remotely control endpoints from a single console. Customers have seen significant benefits like reducing patch cycles from 3 weeks to 2 days and achieving a 127% return on investment. Tivoli Endpoint Manager scales to manage over 500,000 endpoints through intelligent agents that perform tasks locally on endpoints.
FME 2020 Unleashed webinar highlights new features in FME Server including enhanced security, automation improvements, pay as you go licensing, and server apps. Automations in FME 2020 now support looping, mass data loading, and building enterprise integration patterns. A demonstration shows automations processing thousands of workspaces in parallel and pay as you go licensing launching engines on demand. Attendees are encouraged to try the new features and contact Safe Software with any questions.
This document summarizes a training session on fault management and IT automation using OpManager. It includes an agenda covering alarm severity levels, threshold violation alarms, alarms from event logs, SNMP traps, syslog alarms, and notifications. It also discusses using IT workflows to automate problem remediation.
The document discusses the QueueMetrics add-on for Elastix, which provides call center monitoring and reporting. It describes Icon, an agent interface that allows agents to log on/off queues, handle calls, use a soft phone and CRM integration. It provides steps to set up the add-on with Elastix, including upgrading Asterisk, configuring queues/agents in QueueMetrics and enabling the WebRTC softphone. It also describes functionality within the Icon interface and announces a special promotional offer.
The document summarizes a MuleSoft meetup event that took place in Princeton, NJ on September 23rd, 2023. The meetup agenda included an introduction by the organizers, a presentation and demo on troubleshooting with Anypoint Monitoring by the speaker Beauty Mishra, and a Q&A session. Key points covered in the presentation included an overview of Anypoint Monitoring features for apps running on CloudHub or on-premises servers, how to enable automatic monitoring, configure alerts, and use built-in and custom dashboards. The meetup concluded with a request for feedback and suggestions for future meetup topics.
IOMMU event tracing enables reporting of IOMMU events as they occur during boot and runtime. This includes events like when a device is detached from the host and assigned to a virtual machine. Enabling IOMMU event tracing provides useful information about which devices are using IOMMU and changes in device assignments. The traces can help debug problems in virtualized environments as devices are assigned between the host and VMs.
This document discusses key considerations for choosing a SIEM (security information and event management) solution. It begins with an overview of ManageEngine, a provider of IT management software. It then discusses the importance of log management and security event monitoring. The document outlines 8 critical factors to consider when selecting a SIEM solution: log collection capabilities, user activity monitoring, real-time event correlation, log retention, compliance reporting, file integrity monitoring, log forensics, and dashboards. It presents ManageEngine's SIEM offering and highlights its ease of deployment, cost-effectiveness, customizable dashboards, and universal log collection. The presentation concludes with a Q&A.
For a FREE evaluation of your workflow processes on how we can cut your cost by 20-30% and boost your productivity through automation, simply sign up to our automation priority helplist here at http://automationedge.org/FreeEvaluation.htm
What's New in the Timeseries Toolkit for IBM InfoSphere Streams V4.0lisanl
James Cancilla is a developer working on the Streams Toolkit development team. James' presentation describes new Timeseries Toolkit features available in IBM InfoSphere Streams V4.0.
View related presentations and recordings from the Streams V4.0 Developers Conference at:
https://developer.ibm.com/answers/questions/183353/ibm-infosphere-streams-40-developers-conference-on.html?smartspace=streamsdev
IBM zAware is a software tool that analyzes log and system data to identify unusual system behavior, diagnose problems, and help speed up problem resolution. It monitors z/OS and Linux on IBM System z environments, detects anomalies, and provides a GUI to analyze issues. IBM zAware reduces troubleshooting time by pinpointing problems and identifying their root causes through advanced analytics of system data.
The document outlines the scope for a CCTV central monitoring system. It describes features like role-based access for observers and store managers, setting up reporting items for each store, and automatically triggering alerts from the central system to stores when incidents are observed. Observers will be assigned cameras across 54 store locations and able to monitor live feeds and send alerts to managers for incidents. The system will incorporate workflows for setup, user assignments, and alert reporting.
Blue Medora IBM Tivoli Monitoring (ITM) Agent for Remote SSL CertificatesBlue Medora
This document provides information about Blue Medora and its product portfolio, which includes IBM Tivoli Monitoring agents and Tivoli Common Reporting report packages. Specifically, it discusses the Tivoli Monitoring Agent for Remote SSL Certificates, which extends IBM Tivoli Monitoring to monitor X.509 digital certificates across an enterprise and check for expiration. It is designed to integrate seamlessly with existing Tivoli infrastructures.
MuleSoft Surat Virtual Meetup#37 - Anypoint Monitoring On PremiseJitendra Bafna
This document summarizes a MuleSoft meetup event about monitoring MuleSoft applications with the Anypoint Monitoring plugin for on-premise runtimes. The meetup included introductions from moderators and a speaker, details about the Anypoint Monitoring features, a demonstration of how to install the Anypoint Monitoring plugin and view metrics, and a trivia quiz for participants.
Similar to Enhanced event management Solution (20)
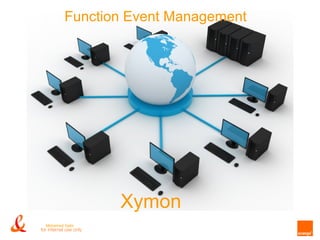
2. Content
• Introduction
• Xymon in Orange
• Enhanced Xymon
• Function Monitoring.
• Alerting System.
• Success Stories.
• Xymon & Genergy (Remedy)
• Generating xymon alarms through emails
• Xymon One Screen Monitoring
• Xymon Reporting Mechanism
• Xymon License.
• Why Xymon is different.
• What could be offered.
• Links and portals
• Portal Demo
2
for internal use only
3. Introduction
• Xymon is a tool for monitoring services. It collects information about
the health of each service component, and their relevant network
connectivity. All those information is presented in a set of simple,
intuitive web pages that are updated frequently to reflect the
changes in the service status.
• Xymon is capable of monitoring any sort of service, on the server,
application , and data flow level, e.g. mail-servers, web-servers
(both plain HTTP and encrypted HTTPS).
3
for internal use only
4. Xymon history
• Initial release of Big Brother was in November 1996.
• Big Brother owned by Quest Software.
• From 2005 until November 2008 the project was called "Hobbit"
• From 2008 until now the project name changed to Xymon
4
for internal use only
5. Xymon in Orange
• Big Brother impended in Equant in 2002.
• Big Brother managed by IBNF.
• It manage lot of services and applications, showing KPI and
availability reports.
5
for internal use only
6. Enhanced Xymon
• Changes done in Xymon core packages to meet OBS business
need.
• Enhanced Xymon can works both Server-Client connection or
Server only connection.
• With Enhanced changes on Xymon no need to add client on the
remote machine.
• Xymon Can monitor any machine connected to network and have IP
address (Linux, Unix, Windows, Router, Switch).
6
for internal use only
7. Service monitoring
• Today’s monitoring concept depends on functional monitoring which
is far from availability monitoring.
• Functional monitoring is to be sure that the a service along with it’s
components, and processes is operating and functional as
designed. (many applications/systems can be up and running but
not functional).
7
for internal use only
8. Service monitoring
• Xymon is enhanced to meet the requirement of a fully integrated
Event Management system.
– The tool has the capabilities to monitor, detect and log all the different events.
– Based on input from application management, the tool performs the required
filtering of the events and automatic determination of each event significance
[information, warning or exception].
– Xymon is as well equipped with a correlation engine specifically designed to
efficiently meet the business requirements in triggering the needed actions for
each event while saving CPU and memory usage of the monitored CI.
• Enhanced Xymon built on new IT market methodology called
SMART MAN (Simulate human daily systematic checks into
automation )
8
for internal use only
9. Alerting System
The tool has the capabilities to monitor, detect and log all the different events.
• Alarms can be alerted through:
• web browser
• graphic screens
• Email alerting to individuals or group of mails.
• SMS alerting ( not implemented yet)
9
for internal use only
10. Xymon alarm generation through emails
What is macros ?
• Microsoft Outlook allow the user to define macros written in Visual Basic to
automate certain activities.
• The doc. Shows brief steps for creating macros
Microsoft Word
Document
10
for internal use only
11. Xymon alarm generation through emails
How does it work ?
• The macro was developed by VB code
• It’s deployed on the monitoring machine
• When the monitoring agent receives any email from specific senders or to
specific receivers (optional)
• The macro will open a connection to xymon and generate an alarm
• Alarm will then be cleared after opening the mail (mark as read)
11
for internal use only
12. Xymon alarm generation through emails
How it’s going to help ?
• A lot of services/processes are monitored only via mail
• A lot of this mails have high priority and large impact
• Some of them are missed by monitoring team
• Using macros to generate alarms will simply avoid missing any mails/alarms
• Providing effective monitoring
12
for internal use only
13. Xymon ONE Screen Monitoring
• Called Critical systems.
• Consist of one window with refresh rate 1 minute, show only alarms
occurred.
13
for internal use only
14. Xymon Admin
• Based on input from application management, the tool performs the required filtering
of the events and automatic determination of each event significance [information,
warning or exception].
14
for internal use only
15. Xymon ONE Screen Monitoring
• When monitoring team open the alert they read instruction of the
action should be taken.
• can acknowledge the alarm and add the incident number.
• Xymon is as well equipped with a correlation engine specifically designed to efficiently
meet the business requirements in triggering the needed actions for each event while
saving CPU and memory usage of the monitored CI.
15
for internal use only
16. Xymon & Genergy (Remedy)
• Integration between Xymon and Remedy to link alarms on Xymon
with tickets created for these alarms.
• This help to detect missing alarms or delay between alarm time and
ticket creation time.
• Built on ITIL concept to link alarm priority with incident priority and
class of the application.
16
for internal use only
17. Xymon Reporting Mechanism
• Xymon consist of different kinds of reporting systems.
• Customized reports for OBS which link alerts with remedy incidents,
consist of:
• Acknowledge Alerts: contains all alerts occurred on Xymon tool,
which appeared on one screen monitoring
17
for internal use only
18. Flow chart
Xymon
Reporting module
g d
ol
t in e n
to
or t s
ep en
er m
th ge
Extract reports
Ala
to na
rm
ils a
t a lt m
De
tec
Incidents details sent to Xymon
Xymon
de fau
ted
Critical view screen
by
rm on
Xym
ala ym
on
X
Arm
la D
ec
tete
dbX
yy
mno
Problem management SLM
Xymon
Service monitoring module
mE
li a
r s
at
Support
m a at c e ed m e gnr oi no M
f sn
Alarms sent via emails BO
ro
to monitoring team
m
Xymon
at i t
on
ti
Service Algorithm
And core module
rala
sm
Monitoring
t
Open Incident thr
r l
ough Remedy
18
for internal use only
19. Flow Chart
Xymon
Xymon
Operate 24x7 on 2 machines
located in DCO PAR
located in DCO PAR
IT helpdesk
monitoring
24x7
DCO CAS Applicatio
n Level 3
24x7 24x7
19
for internal use only
20. Xymon Reporting Mechanism
• Xymon consist of different kinds of reporting systems.
• Customized reports for OBS which link alerts with remedy incidents,
consist of:
• Acknowledge Alerts: contains all alerts occurred on Xymon tool,
which appeared on one screen monitoring
20
for internal use only
21. Xymon Reporting Mechanism
• Remedy Reports: All incidents detailed data created from IT
helpdesk Monitoring team.
21
for internal use only
22. Xymon Reporting Mechanism
• Acknowledge Incidents: its link report between Alarms appeared on
one screen monitoring and incidents created for these alarms.
• All reports can be filtered by Application name , Priority, alarm date
and time , or acknowledge date and time.
• Future reporting will consist of trend analysis and charts for stored
data.
22
for internal use only
23. Xymon Reporting Mechanism
• Availability Report is one of the major driver for Xymon reports
which mainly used by support team to determine monthly KPI for the
applications.
• Currently used in Spectrum, Nest, IAS , Platine and Orchestre.
• Extracted reports used by SLM team for building applications
availability.
• Used for first time in OBS to define service availability.
23
for internal use only
24. Xymon Reporting Mechanism
Link between
• Output reports depends on 99.95 for Class A applications. Availability report
With
and Incident
detailed alarm history which can be stored for years. number
24
for internal use only
25. Xymon License
• Xymon is open-source software, licensed under the GNU GPL
license version 2. This means that You are free to use and
customize Xymon for both personal and commercial use at no cost.
Free as in Freedom
25
for internal use only
26. Xymon License
• Xymon customized to run in OBS environment, free license.
• Hosted on 3 servers , 1 in Cairo and 2 in Paris with class H support
from DCO.
• Source code and hosting can be done in Orange with any
Organization.
• Can use external vendor for software support (Quest Software).
• The tool core was redesigned within IT&S to be easily implemented
as an Event Management System by the responsible team [to be
coordinated with Event Management process owner]
26
for internal use only
27. Why Xymon became different
• Xymon is different than other monitoring tools because it collect
many functions, process and procedure that can be a complete free
license, customized package for event management.
• Its unique because it can be run as Server-Client and in same time
can run as Server Only monitoring.
• Xymon can use any kind of connection methodology to do
monitoring even by polling or trapping.
• Its unique because all kind of powerful Correlation Engine
(calculations, comparing/querying data or process), done local on
the monitoring server which save CPU consumption and high
memory usage of monitored CI.
• Built to be fully integrated with ITIL guidance.
• Customized to use FCAPS concept
• We were able to transform Xymon from a normal monitoring tool,
into a complete customized Event Management System.
27
for internal use only
28. What could be offered
• IP Reporting service
• End – end data flow service.
• Any service functionality monitoring.
28
for internal use only
29. Success Stories
• Now Xymon monitoring wide range of process
and applications in different networks and
different concepts.
• Server-Client base monitoring for Spectrum
pollers.
• Automation monitoring for IAS, Nest,and
Orchestre.
• Mediation monitoring solution
• Server based functional monitoring (smart man
methodology) as IPER E2E.
29
for internal use only
30. Xymon Reporting Mechanism
Other Reports:
• Event log Report
• Top changes
• Snapshot Report
• Config Report
• Metrics Report
• Ghost Clients
• Notification Report
30
for internal use only
31. Portal Demo
http://itsm.equant.com/
31
for internal use only
32. Links and portals
• Major IT wikis added to Xymon links:
• http://itsm.equant.com/wiki/index.php/Main_Page
• http://itsm.equant.com/iperwiki/index.php/Main_Page
• http://itsm.equant.com/mss/index.php/Main_Page
• http://gini.equant.com/wiki/Main_Page
32
for internal use only