SlideShare a Scribd company logo
1 of 5
Download to read offline
Energy & Commodities
            Monthly newsletter from Swedbank’s Economic Research Department                                                        2
            by Jörgen Kennemar                                                                                     No 2 • 2012 02 09


                                Brighter economic signs lift the commodity market
                          Stabilization of the global financial markets and an increased risk appetite
                          among financial investors pushed commodity prices broadly higher in
                          January. Swedbank’s Total Commodity Price Index rose by 2.5% compared
                          with December, reaching its highest level since July of last year. The price
                          index excluding energy commodities, which have fallen since last summer,
                          rebounded in January due to higher metal and food prices.
                          The upswing in the commodity markets has come at the same time that
                          Chinese metal imports rose significantly at the end of last year. Industrial
                          metals reported for the biggest price gains in January, with nickel and copper
                          leading the way. Falling global inventories, especially of copper, create the
                          potential for further price increases going forward. Pulp prices continue to fall,
                          however. In January they dropped for the sixth consecutive month, hitting a
                          two-year low. Further production cutbacks are expected in 2012.
                          There are no obvious signs that oil prices will decline significantly in the short
                          term. Since October 2010 oil has averaged USD 110 a barrel. The risk
                          premium on Brent crude is not likely to change considering the geopolitical
                          uncertainty in the Middle East and risk of supply disruptions. At the same
                          time oil consumption in emerging economies continues to grow, which will
                          increase the need for higher production while also underscoring the
                          importance of efficiency improvements.


                          Energiråvaror             Swedbank’s Total Commodity Price Index, USD

                          250
                                                                                   Total index           Food

 RÃ¥varuprisindex totalt
                   225                                                               Total excl energy
                                                                                     commodities


                          200


sive energiråvaror
                          175
                  Index


                          150


                          125


                          100                                                                       Metals


                           75
                                  05           06            07               08             09Metaller 10             11
                                                                                                                 Source: Swedbank


                                  Economic Research Department. Swedbank. SE-105 34 Stockholm. Phone 46-8-5859 1000.
                                                     E-mail: ek.sekr@swedbank.se www.swedbank.se
                                            Legally responsible publisher: Cecilia Hermansson. 46-8-5859 7720.
                                           Magnus Alvesson. 46-8-5859 334. Jörgen Kennemar. 46-8-5859 7730.
Energy & Commodities

                                                  Monthly newsletter from Swedbank’s Economic Research Department, continue

                                                                                            No 2 • 2012 02 09


         U.S

               The downward trend in commodity prices since the                                               its broad application in industry and construction,
               second half of 2011 has leveled off this year, which                                           rose by an average of 6% and has again passed
               partly covaries with the improvement in global                                                 USD 8 000 a ton. Aluminum, which is used to
               industrial activity. The Global Purchasing Managers                                            manufacture aircraft and machinery, among other
               Index (PMI) rose in January and is in the growth                                               things, saw less of a price decline last fall compared
               zone for the second month in a row. Better growth                                              with other base metals. In January aluminum rose
               numbers from the US are also pushing commodity                                                 by 5.7% after having steadily fallen during the fall.
               prices higher. At the same time investor interest in,                                          Zinc and lead have also risen in price, but at a more
               and risk appetite for, commodities has returned                                                modest pace. Iron ore and scrap rose a modest
               partly because central banks, especially the                                                   1.8% compared with January 2011.
               European Central Bank (ECB), have taken
               aggressive monetary action to boost liquidity in the                                                                       Price trend for industrial metals, January 2011=100
                                                                                                                                    115
               international financial markets after fiscal policies
   EMU         were tightened. This created greater confidence in                                                                   110

               the financial markets and led to lower TED spreads                                                                   105
               in Europe. The stabilization of the financial markets
               rests on shaky ground, however, and could change                                                                     100

               quickly, especially if the sovereign debt crisis in the
                                                                                                              Index, Jan 2011=100


                                                                                                                                     95

               euro zone worsens.
  Sweden                                                                                                                             90


                  Interbanks interest rates minus government treasury, TED                                                           85
                                            spreads
                                                                                                                                     80

                1,50
                                                                                                                                     75


                                                                                                                                     70
                1,25
                                                                                                                                     65
                                                                   EMU                                                                    jan     feb    mar   apr    maj    jun    jul   aug    sep    okt   nov   dec      jan
                                                                                                                                                                                 11                                           12
                1,00                                                                                                                            Copper         Lead         Nickel        Zinc         Aluminium
                                                                                                                                                                                                                    Source: Swedbank
                                                       Sweden


                0,75                                                                                          The rebound in metal prices in the last month has
                                                                                       UK
                                                                                                              happened at the same time that Chinese demand
                0,50
                                                                                                              has risen, as evident by December import data.
                                                                                                              Less concern about a hard landing for the Chinese
                                                                                                              economy and indications of a growing Chinese
                0,25                                                                    USA                   inventory build-up are driving metal prices broadly
Japan
                                                                                                              higher. Inventory changes will mean price volatility,
                0,00                                                                                          however, unless underlying demand strengthens.
                   jan   apr   jul   okt   jan   apr   jul   okt   jan   apr   jul      okt       jan
                               09                      10                      11                    12
                                                                                                              There have also been signs that the Chinese will
                                                                                     Source: Reuters EcoWin
                                                                                                              loosen their monetary policy, which is partly
                                                                                                              supported by a decline in inflation to a more
               Swedbank’s Total Commodity Price Index rose                                                    comfortable 4.1% in December. Temporarily lower
               by 2.5% in January in USD compared with                                                        metal extraction has tightened supply conditions
               December, reaching its highest level since July of                                             during the fall and winter, especially for copper.
               last year. Measured in euro, the increase was 4.7%.                                            Production by the largest mining companies such
               Excluding energy commodities, the index rose by                                                as BHP Billiton, Xstrata, Anglo American and Rio
               2.8% in USD after having fallen for eight                                                      Tinto fell by 273 000 tons or 8.2% in 2011. This has
               consecutive months by a total of 20%. Industrial                                               led to rapidly shrinking copper inventories, which at
               metals saw the fastest price gain in January,                                                  the time of writing are at their lowest levels in over
               climbing as much as 6.1%, the largest monthly                                                  two years. Metal prices in coming quarters will
               change since August 2010. Nickel rose to nearly                                                depend in large part on how much emerging
               USD 19 800 a ton in January, up almost 9% in one                                               economies can keep growing when several OECD
               month. This is a significant increase compared with                                            countries are in recession. This also applies to the
               last year, when nickel had the weakest price trend                                             global financial markets. Additional liquidity-
               of any industrial metal. The price of copper, which is                                         boosting measures by central banks raise the
               considered a reliable economic indicator because of                                            likelihood of a further increase in metal prices,
Energy & Commodity

                                  Monthly newsletter from Swedbank’s Economic Research Department, continue

                                                                          No 2 • 2012 02 09


despite that global growth prospects are relatively                                                 projected to rise by 3.2% in emerging economies,
modest.                                                                                             while continuing to fall, by 0.3%, in mature industrial
                                                                                                    countries. Although China is the world's second
High oil prices are here to stay                                                                    largest oil consumer, per capita it is significantly
Despite that global oil consumption fell in the last                                                below the OECD average, a gap that will gradually
quarter of 2011, prices have been stuck at a high                                                   shrink. Higher oil prices also tend to drive up the
level. Brent crude was an average of 2.4% higher in                                                 price of coal. In January coal rose by 3.4% in USD
January, at USD 110 a barrel, which could hurt the                                                  from the previous month. This is the first time in
already shaky global economy and thus demand for                                                    three months that the price of coal has risen.
oil products. The cold weather in Europe
contributed to a widening price difference between                                                  A cold winter is cutting into food supplies
European Brent crude and US crude.                                                                  Global food prices have fluctuated greatly in recent
                                                                                                    years.     Increased     speculation,    production
                          Brent crude price in USD                                                  disruptions owing to unfavorable weather conditions
          150
                                                                                                    and growing competition between food and energy
          140                                                                                       production are affecting the balance between
          130                                                                                       supply and demand. At the same time the world's
          120                                                                                       population and purchasing power are growing, so
          110
                                                                                                    demand is trending higher, especially in emerging
                                                                                                    economies.
          100
USD/fat


          90                                                                                                                   Grain prices, index
          80
                                                                                                    500
          70

          60                                                                                        450

          50                                                                                                                  Wheat
                                                                                                    400
          40
                                                                                                    350
          30
                05   06      07     08     09        10         11             12
                                                                                                    300        Cereals
                                                          Källa: Swedbank, Reuters EcoWin


                                                                                                    250
The rise in oil prices has also been driven by
                                                                                                    200
uncertainty about supplies and geopolitical
developments in the Middle East. The EU’s oil                                                       150
embargo on Iran, which will have its full effect this
                                                                                                                                  Corn
summer, and the Iranian threat to block or limit oil                                                100

shipments through the Strait of Hormuz have raised                                                   50
oil’s risk premium. The embargo, which represents                                                         05             06      07      08      09   10          11         12
600 000 fat barrels a day, is not expected to have a                                                                                                       Source: Reuters EcoWin


major impact on supplies, since Saudi Arabia has                                                    Increased global food production in 2011 and rising
promised to raise its production. There could be a                                                  inventories contributed to a broad decline in prices
bigger shortage of petroleum products, however,                                                     in the second half-year at the same time that
especially in Italy and Spain, where refineries                                                     investors were seeking out safe harbors in the wake
mainly process lighter, low-sulfur Iranian oil. Iran is                                             of the fiscal crisis. After peaking in February 2011,
the fifth largest oil producer at 3.6 million barrels a                                             Swedbank’s Commodity Price Index fell by nearly
day, most of which is exported to China, India and                                                  20% in USD through last December. In January,
Japan – economies with growing demand. In                                                           however, prices rose by an average of 2.3% in USD
Japan, this is mainly due to the tsunami disaster                                                   after having fallen for four consecutive months. The
and shutdown of a number of nuclear power plants.                                                   unusually cold weather in Russia and Ukraine and
None of these countries is planning to cut back on                                                  speculation about Russian export restrictions on
their imports from Iran, which should also reduce                                                   grain have driven prices higher. An extended cold
the risk of increased imbalances in the global oil                                                  snap could also have a negative effect on
market. At the same time there is a clear shift in                                                  production over the course of 2012.
global oil consumption, where emerging economies
led by Asia are taking a growing slice. This trend is                                               Prices of forest commodities continued to fall during
expected to continue. This year consumption is                                                      the first month of the year. Pulp prices fell in USD


                                                                                            3 (6)
Energy & Commodities

                                                      Monthly newsletter from Swedbank’s Economic Research Department, continue

                                                                                             No 2 • 2012 02 09


by 1.7% between December and January, which                                                                          interest. Silver has risen in USD by slightly over
was a smaller decline than in recent months. Weak                                                                    20% since the beginning of the year, against 13%
global demand and overcapacity are contributing to                                                                   for gold. This is also a sign of an increased risk
the downward trend, because of which pulp has                                                                        appetite in the financial markets. In addition to
fallen by 18% since peaking in July 2011 at just                                                                     greater speculation, the price rise is being driven by
over USD 1 000 a ton. This is also a signal of                                                                       higher industrial consumption of silver. The fiscal
further production cutbacks going forward.                                                                           crisis in the EMU countries and liquidity support
                                                                                                                     from central banks suggest further price increases
                          Price trend for various agricultural products, USD                                         for precious metals.
                   1200                                                                           225
                                                                                                                                                              Gold and silver, index
                   1100                                                                           200
                                                                                                                             1000
                                                                                                                                     Index, 2000=100
                   1000                                                                           175
                                                                                                                             900

                   900                                                                            150                        800
USD/Ton (metric)


                                                                                                         USc/Pound


                   800                                                                            125                        700


                   700                                                                            100                        600
                                                                                                                     Index


                                                                                                                             500
                   600                                                                              75

                                                                                                                             400
                   500                                                                              50
                                                                                                                             300
                   400                                                                              25
                          00      01   02   03   04    05   06   07   08   09   10      11                                   200
                               Pulp    Cotton
                                                                                     Source: Reuters EcoWin                  100
                                                                                                                               jan     maj        sep   jan      maj        sep   jan   maj     sep   jan   maj        sep   jan
                                                                                                                                             08                        09                     10                  11           12
Increased liquidity lifts precious metals                                                                                               Gold            Silver
                                                                                                                                                                                                              Source: Reuters EcoWin

The decline in the prices of gold and silver last fall
has been followed this year by renewed investor                                                                                                                                               Jörgen Kennemar
Energy & Commodities
Monthly newsletter from Swedbank’s Economic Research Department                                                                                                      2
by Jörgen Kennemar                                                                                                                                   No 2 • 2012 02 09


Swedbank Commodity Index                                              - US$ -         Swedbank Commodity Index                                            - SKr -
Basis 2000 = 1oo                                                       10-02-12       Basis 2000 = 1oo                                                     10-02-12
                                            11.2011       12.2011        1.2012                                                   11.2011     12.2011       1.2012
T otal index                                  365,0         359,7         368,7       T otal index                                  267,4       267,8        274,5
                Per cent change month ago         2,5          -1,4           2,5                     Per cent change month ago         3,9         0,2          2,5
                Per cent change year ago        22,8          14,5          12,7                      Per cent change year ago        21,4        14,6         15,8
T otal index exclusive energy                 269,5         264,1         271,5       T otal index exclusive energy                 197,4       196,6        202,2
                Per cent change month ago        -4,6          -2,0           2,8                     Per cent change month ago        -3,3        -0,4          2,8
                Per cent change year ago         -5,0          -9,8        -12,0                      Per cent change year ago         -6,2        -9,6         -9,7
    Food, tropical beverages                  268,6         258,7         264,8           Food, tropical beverages                  196,8       192,6        197,2
                Per cent change month ago        -2,3          -3,7           2,4                     Per cent change month ago        -1,0        -2,1          2,4
                Per cent change year ago         -0,6          -9,6        -12,5                      Per cent change year ago         -1,7        -9,5       -10,1
        Cereals                               277,2         269,0         275,5               Cereals                               203,1       200,3        205,1
                Per cent change month ago        -1,6          -3,0           2,4                     Per cent change month ago        -0,3        -1,4          2,4
                Per cent change year ago          7,8          -3,5          -6,5                     Per cent change year ago          6,6        -3,4         -4,0
        T ropical beverages and tobacco       286,5         274,0         277,0               T ropical beverages and tobacco       209,9       204,0        206,2
                Per cent change month ago        -2,5          -4,4           1,1                     Per cent change month ago        -1,2        -2,8          1,1
                Per cent change year ago          0,5          -9,1        -12,6                      Per cent change year ago         -0,7        -9,0       -10,3
            Coffee                            193,7         189,1         188,7                   Coffee                            141,9       140,8        140,5
                Per cent change month ago        -0,2          -2,4          -0,2                     Per cent change month ago         1,1        -0,8         -0,2
                Per cent change year ago        11,4            2,9          -4,4                     Per cent change year ago        10,1          3,0         -1,8
        Oilseeds and oil                      224,2         218,8         231,3               Oilseeds and oil                      164,3       162,9        172,2
                Per cent change month ago        -2,4          -2,4           5,7                     Per cent change month ago        -1,1        -0,8          5,7
                Per cent change year ago         -8,9        -15,2         -16,3                      Per cent change year ago       -10,0       -15,1        -14,1
    Industrial raw materials                  269,8         265,7         273,5           Industrial raw materials                  197,6       197,8        203,6
                Per cent change month ago        -5,2          -1,5           2,9                     Per cent change month ago        -3,9         0,1          2,9
                Per cent change year ago         -6,3          -9,8        -11,9                      Per cent change year ago         -7,4        -9,7         -9,5
        Agricultural raw materials            173,7         167,1         166,8               Agricultural raw materials            127,3       124,4        124,2
                Per cent change month ago        -7,1          -3,8          -0,2                     Per cent change month ago        -5,8        -2,2         -0,2
                Per cent change year ago         -8,9        -13,5         -16,9                      Per cent change year ago       -10,0       -13,4        -14,7
            Cotton                             96,2          89,1          96,3                   Cotton                             70,5        66,3         71,7
                Per cent change month ago        -4,9          -7,4           8,1                     Per cent change month ago        -3,7        -5,9          8,1
                Per cent change year ago       -27,1         -36,7         -36,5                      Per cent change year ago       -28,0       -36,6        -34,8
            Softwood                          138,3         132,3         129,7                   Softwood                          101,3        98,5         96,6
                Per cent change month ago        -4,4          -4,3          -2,0                     Per cent change month ago        -3,1        -2,8         -2,0
                Per cent change year ago         -7,4          -8,5        -10,1                      Per cent change year ago         -8,5        -8,4         -7,6
            W oodpulp                         887,3         846,0         831,6                   W oodpulp                         650,0       629,9        619,2
                Per cent change month ago        -4,6          -4,7          -1,7                     Per cent change month ago        -3,3        -3,1         -1,7
                Per cent change year ago         -7,3        -10,9         -12,4                      Per cent change year ago         -8,4      -10,8        -10,0
        N on-ferrous metals                   232,3         229,6         243,6               Non-ferrous metals                    170,2       171,0        181,4
                Per cent change month ago        -1,9          -1,2           6,1                     Per cent change month ago        -0,5         0,5          6,1
                                                                                                      Per cent change year ago       -13,0       -16,6        -13,2
                Per cent change year ago       -12,0         -16,7         -15,5
                                                                                                  Copper                           5532,2      5635,0       5972,0
            Copper                           7551,4        7568,2        8020,8
                                                                                                      Per cent change month ago         3,8         1,9          6,0
                Per cent change month ago         2,4           0,2           6,0
                                                                                                      Per cent change year ago       -11,9       -17,0        -13,9
                Per cent change year ago       -10,8         -17,1         -16,1
                                                                                                  Aluminium                        1518,8      1504,0       1590,3
            Aluminium                        2073,2        2020,0        2135,9
                                                                                                      Per cent change month ago        -3,4        -1,0          5,7
                Per cent change month ago        -4,7          -2,6           5,7
                                                                                                      Per cent change year ago       -12,2       -13,8        -10,1
                Per cent change year ago       -11,1         -13,9         -12,5
                                                                                                  Lead                             1451,7      1501,8       1555,1
            Lead                             1981,6        2017,0        2088,6
                                                                                                      Per cent change month ago         3,2         3,4          3,5
                Per cent change month ago         1,8           1,8           3,5
                                                                                                      Per cent change year ago       -17,6       -16,0        -17,5
                Per cent change year ago       -16,6         -16,1         -19,7
                                                                                                  Z inc                            1403,5      1424,0       1469,3
            Z inc                            1915,7        1912,5        1973,4
                                                                                                      Per cent change month ago         4,4         1,5          3,2
                Per cent change month ago         3,0          -0,2           3,2
                                                                                                      Per cent change year ago       -17,4       -15,7        -14,6
                Per cent change year ago       -16,4         -15,8         -16,9
                                                                                                  Nickel                          13098,6     13530,0      14703,8
            N ickel                         17879,4       18171,7       19748,2
                                                                                                      Per cent change month ago        -4,2         3,3          8,7
                Per cent change month ago        -5,5           1,6           8,7
                                                                                                      Per cent change year ago       -22,9       -24,3        -20,8
                Per cent change year ago       -21,9         -24,5         -22,9
                                                                                              Iron ore, steel scrap                 454,9       461,0        469,4
        Iron ore, steel scrap                 620,9         619,2         630,4
                                                                                                      Per cent change month ago        -6,0         1,4          1,8
                Per cent change month ago        -7,2          -0,3           1,8
                                                                                                      Per cent change year ago          1,8         2,2         -0,9
                Per cent change year ago          3,0           2,0          -3,5         Energy raw materials                      298,4       299,4        306,6
    Energy raw materials                      407,4         402,1         411,8                       Per cent change month ago         6,2         0,3          2,4
                Per cent change month ago         4,8          -1,3           2,4                     Per cent change year ago        32,8        24,4         26,2
                Per cent change year ago        34,4          24,2          22,9              Coking coal                           313,8       314,8        326,5
        Coking coal                           428,4         422,8         438,5                       Per cent change month ago        -3,3         0,3          3,7
                Per cent change month ago        -4,6          -1,3           3,7                     Per cent change year ago          4,1        -6,9         -8,2
                Per cent change year ago          5,3          -7,0        -10,6              Crude oil                             297,7       298,7        305,7
        Crude oil                             406,4         401,2         410,6                       Per cent change month ago         6,7         0,3          2,3
                Per cent change month ago         5,3          -1,3           2,3                     Per cent change year ago        34,6        26,4         28,5
                Per cent change year ago        36,2          26,2          25,1

Source : SW ED BAN K and H W W A-Institute for Economic R esearch H amburg        c   Source : SW EDBANK and HW W A-Institute for Economic Research Hamburg


Swedbank
                                                        Swedbank’s monthly Energy & Commodities newsletter is published as s service to our
Economic Research Department                            customers. We believe that we have used reliable sources and methods in the preparation
                                                        of the analyses reported in this publication. However, we cannot guarantee the accuracy or
SE-105 34 Stockholm, Sweden
                                                        completeness of the report and cannot be held responsible for any error or omission in the
Phone 46-8-5859 7740
                                                        underlying material or its use. Readers are encouraged to base any (investment) decisions
ek.sekr@swedbank.se
                                                        on otjer material as well. Neither Swedbank nor its employees may be held responsible for
www.swedbank.se
                                                        losses or damages, direct or indirect, owing to any errors or omissions in Swedbanks
Legally responsible publisher                           monthly Energy & Commodities newsletter.
Cecilia Hermansson, 46-8-5859 7720.
Magnus Alvesson, 46-8-5859 3341
Jörgen Kennemar, 46-8-5859 7730


                            Economic Research Department. Swedbank. SE-105 34 Stockholm. Phone 46-8-5859 1000.
                                               E-mail: ek.sekr@swedbank.se www.swedbank.se
                                      Legally responsible publisher: Cecilia Hermansson. 46-8-5859 7720.
                                     Magnus Alvesson. 46-8-5859 334. Jörgen Kennemar. 46-8-5859 7730.

More Related Content

What's hot

Energy & Commodities, No. 3 - March 19, 2012
Energy & Commodities, No. 3 - March 19, 2012Energy & Commodities, No. 3 - March 19, 2012
Energy & Commodities, No. 3 - March 19, 2012Swedbank
 
Energy & Commodities, No.5, 16 May 2011
Energy & Commodities, No.5, 16 May 2011 Energy & Commodities, No.5, 16 May 2011
Energy & Commodities, No.5, 16 May 2011 Swedbank
 
Flash Comment: Latvia - November 8, 2011
Flash Comment: Latvia - November 8, 2011Flash Comment: Latvia - November 8, 2011
Flash Comment: Latvia - November 8, 2011Swedbank
 
Flash comment: Latvia - August 8, 2012
Flash comment: Latvia  - August 8, 2012Flash comment: Latvia  - August 8, 2012
Flash comment: Latvia - August 8, 2012Swedbank
 
Energy & Commodities - 2010 - August/September
Energy & Commodities - 2010 - August/SeptemberEnergy & Commodities - 2010 - August/September
Energy & Commodities - 2010 - August/SeptemberSwedbank
 
Eastern European Outlook October 2010
Eastern European Outlook October 2010Eastern European Outlook October 2010
Eastern European Outlook October 2010The Benche
 
Flash comment: Lithuania - May 9, 2012
Flash comment: Lithuania - May 9, 2012Flash comment: Lithuania - May 9, 2012
Flash comment: Lithuania - May 9, 2012Swedbank
 
Flash Comment: Latvia - January 9, 2012
Flash Comment: Latvia - January 9, 2012Flash Comment: Latvia - January 9, 2012
Flash Comment: Latvia - January 9, 2012Swedbank
 
Flash comment: Latvia - March 8, 2012
Flash comment: Latvia - March 8, 2012Flash comment: Latvia - March 8, 2012
Flash comment: Latvia - March 8, 2012Swedbank
 
Flash Comment: Latvia - February 8, 2012
Flash Comment: Latvia - February 8, 2012Flash Comment: Latvia - February 8, 2012
Flash Comment: Latvia - February 8, 2012Swedbank
 
Flash Comment: Lithuania - October 10, 2011
Flash Comment: Lithuania - October 10, 2011Flash Comment: Lithuania - October 10, 2011
Flash Comment: Lithuania - October 10, 2011Swedbank
 
Flash Comment - July 11, 2011
Flash Comment - July 11, 2011Flash Comment - July 11, 2011
Flash Comment - July 11, 2011Swedbank
 
Commodity Research Report 06 february 2017 Ways2Capital
Commodity Research Report 06 february 2017 Ways2CapitalCommodity Research Report 06 february 2017 Ways2Capital
Commodity Research Report 06 february 2017 Ways2CapitalWays2Capital | Investment Advisor
 
Flash Coment: Lithuania - January 9, 2012
Flash Coment: Lithuania - January 9, 2012Flash Coment: Lithuania - January 9, 2012
Flash Coment: Lithuania - January 9, 2012Swedbank
 
Flash comment: Lithuania - July 10, 2012
Flash comment: Lithuania - July 10, 2012Flash comment: Lithuania - July 10, 2012
Flash comment: Lithuania - July 10, 2012Swedbank
 
Flash Comment: Lithuania - February 14, 2012
Flash Comment: Lithuania - February 14, 2012Flash Comment: Lithuania - February 14, 2012
Flash Comment: Lithuania - February 14, 2012Swedbank
 
Commodities rally is partial and unlikely to be sustained
Commodities rally is partial and unlikely to be sustainedCommodities rally is partial and unlikely to be sustained
Commodities rally is partial and unlikely to be sustainedQNB Group
 
Flash comment: Lithuania - June 8, 2012
Flash comment: Lithuania - June 8, 2012Flash comment: Lithuania - June 8, 2012
Flash comment: Lithuania - June 8, 2012Swedbank
 
Flash Comment: Lithuania - November 8, 2011
Flash Comment: Lithuania - November 8, 2011Flash Comment: Lithuania - November 8, 2011
Flash Comment: Lithuania - November 8, 2011Swedbank
 
Energy & Commodities - 2010, July/August
Energy & Commodities - 2010, July/AugustEnergy & Commodities - 2010, July/August
Energy & Commodities - 2010, July/AugustSwedbank
 

What's hot (20)

Energy & Commodities, No. 3 - March 19, 2012
Energy & Commodities, No. 3 - March 19, 2012Energy & Commodities, No. 3 - March 19, 2012
Energy & Commodities, No. 3 - March 19, 2012
 
Energy & Commodities, No.5, 16 May 2011
Energy & Commodities, No.5, 16 May 2011 Energy & Commodities, No.5, 16 May 2011
Energy & Commodities, No.5, 16 May 2011
 
Flash Comment: Latvia - November 8, 2011
Flash Comment: Latvia - November 8, 2011Flash Comment: Latvia - November 8, 2011
Flash Comment: Latvia - November 8, 2011
 
Flash comment: Latvia - August 8, 2012
Flash comment: Latvia  - August 8, 2012Flash comment: Latvia  - August 8, 2012
Flash comment: Latvia - August 8, 2012
 
Energy & Commodities - 2010 - August/September
Energy & Commodities - 2010 - August/SeptemberEnergy & Commodities - 2010 - August/September
Energy & Commodities - 2010 - August/September
 
Eastern European Outlook October 2010
Eastern European Outlook October 2010Eastern European Outlook October 2010
Eastern European Outlook October 2010
 
Flash comment: Lithuania - May 9, 2012
Flash comment: Lithuania - May 9, 2012Flash comment: Lithuania - May 9, 2012
Flash comment: Lithuania - May 9, 2012
 
Flash Comment: Latvia - January 9, 2012
Flash Comment: Latvia - January 9, 2012Flash Comment: Latvia - January 9, 2012
Flash Comment: Latvia - January 9, 2012
 
Flash comment: Latvia - March 8, 2012
Flash comment: Latvia - March 8, 2012Flash comment: Latvia - March 8, 2012
Flash comment: Latvia - March 8, 2012
 
Flash Comment: Latvia - February 8, 2012
Flash Comment: Latvia - February 8, 2012Flash Comment: Latvia - February 8, 2012
Flash Comment: Latvia - February 8, 2012
 
Flash Comment: Lithuania - October 10, 2011
Flash Comment: Lithuania - October 10, 2011Flash Comment: Lithuania - October 10, 2011
Flash Comment: Lithuania - October 10, 2011
 
Flash Comment - July 11, 2011
Flash Comment - July 11, 2011Flash Comment - July 11, 2011
Flash Comment - July 11, 2011
 
Commodity Research Report 06 february 2017 Ways2Capital
Commodity Research Report 06 february 2017 Ways2CapitalCommodity Research Report 06 february 2017 Ways2Capital
Commodity Research Report 06 february 2017 Ways2Capital
 
Flash Coment: Lithuania - January 9, 2012
Flash Coment: Lithuania - January 9, 2012Flash Coment: Lithuania - January 9, 2012
Flash Coment: Lithuania - January 9, 2012
 
Flash comment: Lithuania - July 10, 2012
Flash comment: Lithuania - July 10, 2012Flash comment: Lithuania - July 10, 2012
Flash comment: Lithuania - July 10, 2012
 
Flash Comment: Lithuania - February 14, 2012
Flash Comment: Lithuania - February 14, 2012Flash Comment: Lithuania - February 14, 2012
Flash Comment: Lithuania - February 14, 2012
 
Commodities rally is partial and unlikely to be sustained
Commodities rally is partial and unlikely to be sustainedCommodities rally is partial and unlikely to be sustained
Commodities rally is partial and unlikely to be sustained
 
Flash comment: Lithuania - June 8, 2012
Flash comment: Lithuania - June 8, 2012Flash comment: Lithuania - June 8, 2012
Flash comment: Lithuania - June 8, 2012
 
Flash Comment: Lithuania - November 8, 2011
Flash Comment: Lithuania - November 8, 2011Flash Comment: Lithuania - November 8, 2011
Flash Comment: Lithuania - November 8, 2011
 
Energy & Commodities - 2010, July/August
Energy & Commodities - 2010, July/AugustEnergy & Commodities - 2010, July/August
Energy & Commodities - 2010, July/August
 

Similar to Energy & Commodities, No. 2 - February 9, 2012

Energy & Commodities, No.8 - October 25, 2011
Energy & Commodities, No.8 - October 25, 2011 Energy & Commodities, No.8 - October 25, 2011
Energy & Commodities, No.8 - October 25, 2011 Swedbank
 
Energy & Commodities, No. 1 - January 19, 2012
Energy & Commodities, No. 1 - January 19, 2012 Energy & Commodities, No. 1 - January 19, 2012
Energy & Commodities, No. 1 - January 19, 2012 Swedbank
 
Energy & Commodities, No. 6 - June 8, 2012
Energy & Commodities, No. 6 - June 8, 2012Energy & Commodities, No. 6 - June 8, 2012
Energy & Commodities, No. 6 - June 8, 2012Swedbank
 
Energy & Commodities, No. 5 - May 11, 2012
Energy & Commodities, No. 5 - May 11, 2012Energy & Commodities, No. 5 - May 11, 2012
Energy & Commodities, No. 5 - May 11, 2012Swedbank
 
Energy & Commodities - 2010 - October
Energy & Commodities - 2010 - October Energy & Commodities - 2010 - October
Energy & Commodities - 2010 - October Swedbank
 
Energy & Commodities, No. 7 - August 27, 2012
 Energy & Commodities, No. 7 - August 27, 2012 Energy & Commodities, No. 7 - August 27, 2012
Energy & Commodities, No. 7 - August 27, 2012Swedbank
 
The Swedish Economy No.9 - December 22, 2011
The Swedish Economy No.9 - December 22, 2011 The Swedish Economy No.9 - December 22, 2011
The Swedish Economy No.9 - December 22, 2011 Swedbank
 
Energy & Commodities, 2010, regarding May
Energy & Commodities, 2010, regarding MayEnergy & Commodities, 2010, regarding May
Energy & Commodities, 2010, regarding MaySwedbank
 
KBank Economics update Mar 2012
KBank Economics update   Mar 2012KBank Economics update   Mar 2012
KBank Economics update Mar 2012KBank Fx Dealing Room
 
Energy & Commodities, 2010 regarding March
Energy & Commodities, 2010 regarding MarchEnergy & Commodities, 2010 regarding March
Energy & Commodities, 2010 regarding MarchSwedbank
 
July 2012: SEI Market Commentary
July 2012:  SEI Market CommentaryJuly 2012:  SEI Market Commentary
July 2012: SEI Market Commentarymgallivan19
 
Commodities rally is partial and unlikely to be sustained
Commodities rally is partial and unlikely to be sustainedCommodities rally is partial and unlikely to be sustained
Commodities rally is partial and unlikely to be sustainedQNB Group
 
Atradius - market monitor september 2012
Atradius -  market monitor september 2012Atradius -  market monitor september 2012
Atradius - market monitor september 2012ted6
 
Atradius Market Monitor September 2012
Atradius Market Monitor September 2012Atradius Market Monitor September 2012
Atradius Market Monitor September 2012ted6
 
Base metals: outlook for supply and demand
Base metals: outlook for supply and demandBase metals: outlook for supply and demand
Base metals: outlook for supply and demandMining On Top
 
The Swedish Economy No.3 - May 29, 2012
The Swedish Economy No.3 - May 29, 2012 The Swedish Economy No.3 - May 29, 2012
The Swedish Economy No.3 - May 29, 2012 Swedbank
 
November 2011 - Energy Index Press Release
November 2011 - Energy Index Press ReleaseNovember 2011 - Energy Index Press Release
November 2011 - Energy Index Press ReleaseBord Gáis Energy
 
The Swedish Economy No.4 - June 26, 2012
The Swedish Economy No.4 - June 26, 2012 The Swedish Economy No.4 - June 26, 2012
The Swedish Economy No.4 - June 26, 2012 Swedbank
 
Lithuanian Economy, No. 2 - March 9, 2012
Lithuanian Economy, No. 2 - March 9,  2012Lithuanian Economy, No. 2 - March 9,  2012
Lithuanian Economy, No. 2 - March 9, 2012Swedbank
 
Inflation Watch: February 17, 2011
Inflation Watch: February 17, 2011Inflation Watch: February 17, 2011
Inflation Watch: February 17, 2011NAR Research
 

Similar to Energy & Commodities, No. 2 - February 9, 2012 (20)

Energy & Commodities, No.8 - October 25, 2011
Energy & Commodities, No.8 - October 25, 2011 Energy & Commodities, No.8 - October 25, 2011
Energy & Commodities, No.8 - October 25, 2011
 
Energy & Commodities, No. 1 - January 19, 2012
Energy & Commodities, No. 1 - January 19, 2012 Energy & Commodities, No. 1 - January 19, 2012
Energy & Commodities, No. 1 - January 19, 2012
 
Energy & Commodities, No. 6 - June 8, 2012
Energy & Commodities, No. 6 - June 8, 2012Energy & Commodities, No. 6 - June 8, 2012
Energy & Commodities, No. 6 - June 8, 2012
 
Energy & Commodities, No. 5 - May 11, 2012
Energy & Commodities, No. 5 - May 11, 2012Energy & Commodities, No. 5 - May 11, 2012
Energy & Commodities, No. 5 - May 11, 2012
 
Energy & Commodities - 2010 - October
Energy & Commodities - 2010 - October Energy & Commodities - 2010 - October
Energy & Commodities - 2010 - October
 
Energy & Commodities, No. 7 - August 27, 2012
 Energy & Commodities, No. 7 - August 27, 2012 Energy & Commodities, No. 7 - August 27, 2012
Energy & Commodities, No. 7 - August 27, 2012
 
The Swedish Economy No.9 - December 22, 2011
The Swedish Economy No.9 - December 22, 2011 The Swedish Economy No.9 - December 22, 2011
The Swedish Economy No.9 - December 22, 2011
 
Energy & Commodities, 2010, regarding May
Energy & Commodities, 2010, regarding MayEnergy & Commodities, 2010, regarding May
Energy & Commodities, 2010, regarding May
 
KBank Economics update Mar 2012
KBank Economics update   Mar 2012KBank Economics update   Mar 2012
KBank Economics update Mar 2012
 
Energy & Commodities, 2010 regarding March
Energy & Commodities, 2010 regarding MarchEnergy & Commodities, 2010 regarding March
Energy & Commodities, 2010 regarding March
 
July 2012: SEI Market Commentary
July 2012:  SEI Market CommentaryJuly 2012:  SEI Market Commentary
July 2012: SEI Market Commentary
 
Commodities rally is partial and unlikely to be sustained
Commodities rally is partial and unlikely to be sustainedCommodities rally is partial and unlikely to be sustained
Commodities rally is partial and unlikely to be sustained
 
Atradius - market monitor september 2012
Atradius -  market monitor september 2012Atradius -  market monitor september 2012
Atradius - market monitor september 2012
 
Atradius Market Monitor September 2012
Atradius Market Monitor September 2012Atradius Market Monitor September 2012
Atradius Market Monitor September 2012
 
Base metals: outlook for supply and demand
Base metals: outlook for supply and demandBase metals: outlook for supply and demand
Base metals: outlook for supply and demand
 
The Swedish Economy No.3 - May 29, 2012
The Swedish Economy No.3 - May 29, 2012 The Swedish Economy No.3 - May 29, 2012
The Swedish Economy No.3 - May 29, 2012
 
November 2011 - Energy Index Press Release
November 2011 - Energy Index Press ReleaseNovember 2011 - Energy Index Press Release
November 2011 - Energy Index Press Release
 
The Swedish Economy No.4 - June 26, 2012
The Swedish Economy No.4 - June 26, 2012 The Swedish Economy No.4 - June 26, 2012
The Swedish Economy No.4 - June 26, 2012
 
Lithuanian Economy, No. 2 - March 9, 2012
Lithuanian Economy, No. 2 - March 9,  2012Lithuanian Economy, No. 2 - March 9,  2012
Lithuanian Economy, No. 2 - March 9, 2012
 
Inflation Watch: February 17, 2011
Inflation Watch: February 17, 2011Inflation Watch: February 17, 2011
Inflation Watch: February 17, 2011
 

More from Swedbank

Swedbank corporate presentation April 25 2017
Swedbank corporate presentation April 25 2017Swedbank corporate presentation April 25 2017
Swedbank corporate presentation April 25 2017Swedbank
 
Swedbank foretagspresentation 25 april 2017
Swedbank foretagspresentation 25 april 2017Swedbank foretagspresentation 25 april 2017
Swedbank foretagspresentation 25 april 2017Swedbank
 
Delårsrapport kv1 2017
Delårsrapport kv1 2017Delårsrapport kv1 2017
Delårsrapport kv1 2017Swedbank
 
Interim report q1 2017
Interim report q1 2017Interim report q1 2017
Interim report q1 2017Swedbank
 
Year end report 2016
Year end report 2016Year end report 2016
Year end report 2016Swedbank
 
Bokslutskommuniké 2016
Bokslutskommuniké 2016Bokslutskommuniké 2016
Bokslutskommuniké 2016Swedbank
 
Swedbank företagspresentation, 2 februari 2017
Swedbank företagspresentation, 2 februari 2017Swedbank företagspresentation, 2 februari 2017
Swedbank företagspresentation, 2 februari 2017Swedbank
 
Swedbank corporate presentation, February 2 2017
Swedbank corporate presentation, February 2 2017Swedbank corporate presentation, February 2 2017
Swedbank corporate presentation, February 2 2017Swedbank
 
Swedbank Corporate Presentation, October 25 2016
Swedbank Corporate Presentation, October 25 2016Swedbank Corporate Presentation, October 25 2016
Swedbank Corporate Presentation, October 25 2016Swedbank
 
Swedbank företagspresentation, 25 oktober 2016
Swedbank företagspresentation, 25 oktober 2016Swedbank företagspresentation, 25 oktober 2016
Swedbank företagspresentation, 25 oktober 2016Swedbank
 
Swedbank Corporate Presentation, June 30 2016
Swedbank Corporate Presentation, June 30 2016Swedbank Corporate Presentation, June 30 2016
Swedbank Corporate Presentation, June 30 2016Swedbank
 
Swedbank företagspresentation, 30 juni 2016
Swedbank företagspresentation, 30 juni 2016Swedbank företagspresentation, 30 juni 2016
Swedbank företagspresentation, 30 juni 2016Swedbank
 
Swedbank corporate presentation Q1, 2016
Swedbank corporate presentation Q1, 2016Swedbank corporate presentation Q1, 2016
Swedbank corporate presentation Q1, 2016Swedbank
 
Swedbank företagspresentation kvartal 1, 2016.
Swedbank företagspresentation kvartal 1, 2016.Swedbank företagspresentation kvartal 1, 2016.
Swedbank företagspresentation kvartal 1, 2016.Swedbank
 
Swedbank corporate presentation Q4, 2015
Swedbank corporate presentation Q4, 2015Swedbank corporate presentation Q4, 2015
Swedbank corporate presentation Q4, 2015Swedbank
 
Swedbank företagspresentation kvartal 4,2015
Swedbank företagspresentation kvartal 4,2015Swedbank företagspresentation kvartal 4,2015
Swedbank företagspresentation kvartal 4,2015Swedbank
 
Year end report 2015
Year end report 2015Year end report 2015
Year end report 2015Swedbank
 
Bokslutskommuniké 2015
Bokslutskommuniké 2015Bokslutskommuniké 2015
Bokslutskommuniké 2015Swedbank
 
Swedbank Företagspresentation, September 2015
Swedbank Företagspresentation, September 2015Swedbank Företagspresentation, September 2015
Swedbank Företagspresentation, September 2015Swedbank
 
Swedbank Corporate Presentation, September 2015
Swedbank Corporate Presentation, September 2015Swedbank Corporate Presentation, September 2015
Swedbank Corporate Presentation, September 2015Swedbank
 

More from Swedbank (20)

Swedbank corporate presentation April 25 2017
Swedbank corporate presentation April 25 2017Swedbank corporate presentation April 25 2017
Swedbank corporate presentation April 25 2017
 
Swedbank foretagspresentation 25 april 2017
Swedbank foretagspresentation 25 april 2017Swedbank foretagspresentation 25 april 2017
Swedbank foretagspresentation 25 april 2017
 
Delårsrapport kv1 2017
Delårsrapport kv1 2017Delårsrapport kv1 2017
Delårsrapport kv1 2017
 
Interim report q1 2017
Interim report q1 2017Interim report q1 2017
Interim report q1 2017
 
Year end report 2016
Year end report 2016Year end report 2016
Year end report 2016
 
Bokslutskommuniké 2016
Bokslutskommuniké 2016Bokslutskommuniké 2016
Bokslutskommuniké 2016
 
Swedbank företagspresentation, 2 februari 2017
Swedbank företagspresentation, 2 februari 2017Swedbank företagspresentation, 2 februari 2017
Swedbank företagspresentation, 2 februari 2017
 
Swedbank corporate presentation, February 2 2017
Swedbank corporate presentation, February 2 2017Swedbank corporate presentation, February 2 2017
Swedbank corporate presentation, February 2 2017
 
Swedbank Corporate Presentation, October 25 2016
Swedbank Corporate Presentation, October 25 2016Swedbank Corporate Presentation, October 25 2016
Swedbank Corporate Presentation, October 25 2016
 
Swedbank företagspresentation, 25 oktober 2016
Swedbank företagspresentation, 25 oktober 2016Swedbank företagspresentation, 25 oktober 2016
Swedbank företagspresentation, 25 oktober 2016
 
Swedbank Corporate Presentation, June 30 2016
Swedbank Corporate Presentation, June 30 2016Swedbank Corporate Presentation, June 30 2016
Swedbank Corporate Presentation, June 30 2016
 
Swedbank företagspresentation, 30 juni 2016
Swedbank företagspresentation, 30 juni 2016Swedbank företagspresentation, 30 juni 2016
Swedbank företagspresentation, 30 juni 2016
 
Swedbank corporate presentation Q1, 2016
Swedbank corporate presentation Q1, 2016Swedbank corporate presentation Q1, 2016
Swedbank corporate presentation Q1, 2016
 
Swedbank företagspresentation kvartal 1, 2016.
Swedbank företagspresentation kvartal 1, 2016.Swedbank företagspresentation kvartal 1, 2016.
Swedbank företagspresentation kvartal 1, 2016.
 
Swedbank corporate presentation Q4, 2015
Swedbank corporate presentation Q4, 2015Swedbank corporate presentation Q4, 2015
Swedbank corporate presentation Q4, 2015
 
Swedbank företagspresentation kvartal 4,2015
Swedbank företagspresentation kvartal 4,2015Swedbank företagspresentation kvartal 4,2015
Swedbank företagspresentation kvartal 4,2015
 
Year end report 2015
Year end report 2015Year end report 2015
Year end report 2015
 
Bokslutskommuniké 2015
Bokslutskommuniké 2015Bokslutskommuniké 2015
Bokslutskommuniké 2015
 
Swedbank Företagspresentation, September 2015
Swedbank Företagspresentation, September 2015Swedbank Företagspresentation, September 2015
Swedbank Företagspresentation, September 2015
 
Swedbank Corporate Presentation, September 2015
Swedbank Corporate Presentation, September 2015Swedbank Corporate Presentation, September 2015
Swedbank Corporate Presentation, September 2015
 

Recently uploaded

Independent Lucknow Call Girls 8923113531WhatsApp Lucknow Call Girls make you...
Independent Lucknow Call Girls 8923113531WhatsApp Lucknow Call Girls make you...Independent Lucknow Call Girls 8923113531WhatsApp Lucknow Call Girls make you...
Independent Lucknow Call Girls 8923113531WhatsApp Lucknow Call Girls make you...makika9823
 
OAT_RI_Ep19 WeighingTheRisks_Apr24_TheYellowMetal.pptx
OAT_RI_Ep19 WeighingTheRisks_Apr24_TheYellowMetal.pptxOAT_RI_Ep19 WeighingTheRisks_Apr24_TheYellowMetal.pptx
OAT_RI_Ep19 WeighingTheRisks_Apr24_TheYellowMetal.pptxhiddenlevers
 
VIP Call Girls Thane Sia 8617697112 Independent Escort Service Thane
VIP Call Girls Thane Sia 8617697112 Independent Escort Service ThaneVIP Call Girls Thane Sia 8617697112 Independent Escort Service Thane
VIP Call Girls Thane Sia 8617697112 Independent Escort Service ThaneCall girls in Ahmedabad High profile
 
letter-from-the-chair-to-the-fca-relating-to-british-steel-pensions-scheme-15...
letter-from-the-chair-to-the-fca-relating-to-british-steel-pensions-scheme-15...letter-from-the-chair-to-the-fca-relating-to-british-steel-pensions-scheme-15...
letter-from-the-chair-to-the-fca-relating-to-british-steel-pensions-scheme-15...Henry Tapper
 
High Class Call Girls Nagpur Grishma Call 7001035870 Meet With Nagpur Escorts
High Class Call Girls Nagpur Grishma Call 7001035870 Meet With Nagpur EscortsHigh Class Call Girls Nagpur Grishma Call 7001035870 Meet With Nagpur Escorts
High Class Call Girls Nagpur Grishma Call 7001035870 Meet With Nagpur Escortsranjana rawat
 
VIP Call Girls LB Nagar ( Hyderabad ) Phone 8250192130 | ₹5k To 25k With Room...
VIP Call Girls LB Nagar ( Hyderabad ) Phone 8250192130 | ₹5k To 25k With Room...VIP Call Girls LB Nagar ( Hyderabad ) Phone 8250192130 | ₹5k To 25k With Room...
VIP Call Girls LB Nagar ( Hyderabad ) Phone 8250192130 | ₹5k To 25k With Room...Suhani Kapoor
 
How Automation is Driving Efficiency Through the Last Mile of Reporting
How Automation is Driving Efficiency Through the Last Mile of ReportingHow Automation is Driving Efficiency Through the Last Mile of Reporting
How Automation is Driving Efficiency Through the Last Mile of ReportingAggregage
 
Log your LOA pain with Pension Lab's brilliant campaign
Log your LOA pain with Pension Lab's brilliant campaignLog your LOA pain with Pension Lab's brilliant campaign
Log your LOA pain with Pension Lab's brilliant campaignHenry Tapper
 
High Class Call Girls Nashik Maya 7001305949 Independent Escort Service Nashik
High Class Call Girls Nashik Maya 7001305949 Independent Escort Service NashikHigh Class Call Girls Nashik Maya 7001305949 Independent Escort Service Nashik
High Class Call Girls Nashik Maya 7001305949 Independent Escort Service NashikCall Girls in Nagpur High Profile
 
Dharavi Russian callg Girls, { 09892124323 } || Call Girl In Mumbai ...
Dharavi Russian callg Girls, { 09892124323 } || Call Girl In Mumbai ...Dharavi Russian callg Girls, { 09892124323 } || Call Girl In Mumbai ...
Dharavi Russian callg Girls, { 09892124323 } || Call Girl In Mumbai ...Pooja Nehwal
 
Instant Issue Debit Cards - School Designs
Instant Issue Debit Cards - School DesignsInstant Issue Debit Cards - School Designs
Instant Issue Debit Cards - School Designsegoetzinger
 
Monthly Market Risk Update: April 2024 [SlideShare]
Monthly Market Risk Update: April 2024 [SlideShare]Monthly Market Risk Update: April 2024 [SlideShare]
Monthly Market Risk Update: April 2024 [SlideShare]Commonwealth
 
Andheri Call Girls In 9825968104 Mumbai Hot Models
Andheri Call Girls In 9825968104 Mumbai Hot ModelsAndheri Call Girls In 9825968104 Mumbai Hot Models
Andheri Call Girls In 9825968104 Mumbai Hot Modelshematsharma006
 
Dividend Policy and Dividend Decision Theories.pptx
Dividend Policy and Dividend Decision Theories.pptxDividend Policy and Dividend Decision Theories.pptx
Dividend Policy and Dividend Decision Theories.pptxanshikagoel52
 
Russian Call Girls In Gtb Nagar (Delhi) 9711199012 💋✔💕😘 Naughty Call Girls Se...
Russian Call Girls In Gtb Nagar (Delhi) 9711199012 💋✔💕😘 Naughty Call Girls Se...Russian Call Girls In Gtb Nagar (Delhi) 9711199012 💋✔💕😘 Naughty Call Girls Se...
Russian Call Girls In Gtb Nagar (Delhi) 9711199012 💋✔💕😘 Naughty Call Girls Se...shivangimorya083
 
Vip B Aizawl Call Girls #9907093804 Contact Number Escorts Service Aizawl
Vip B Aizawl Call Girls #9907093804 Contact Number Escorts Service AizawlVip B Aizawl Call Girls #9907093804 Contact Number Escorts Service Aizawl
Vip B Aizawl Call Girls #9907093804 Contact Number Escorts Service Aizawlmakika9823
 
VIP Kolkata Call Girl Serampore 👉 8250192130 Available With Room
VIP Kolkata Call Girl Serampore 👉 8250192130  Available With RoomVIP Kolkata Call Girl Serampore 👉 8250192130  Available With Room
VIP Kolkata Call Girl Serampore 👉 8250192130 Available With Roomdivyansh0kumar0
 
20240417-Calibre-April-2024-Investor-Presentation.pdf
20240417-Calibre-April-2024-Investor-Presentation.pdf20240417-Calibre-April-2024-Investor-Presentation.pdf
20240417-Calibre-April-2024-Investor-Presentation.pdfAdnet Communications
 
Call Girls In Yusuf Sarai Women Seeking Men 9654467111
Call Girls In Yusuf Sarai Women Seeking Men 9654467111Call Girls In Yusuf Sarai Women Seeking Men 9654467111
Call Girls In Yusuf Sarai Women Seeking Men 9654467111Sapana Sha
 
Call Girls Service Nagpur Maya Call 7001035870 Meet With Nagpur Escorts
Call Girls Service Nagpur Maya Call 7001035870 Meet With Nagpur EscortsCall Girls Service Nagpur Maya Call 7001035870 Meet With Nagpur Escorts
Call Girls Service Nagpur Maya Call 7001035870 Meet With Nagpur Escortsranjana rawat
 

Recently uploaded (20)

Independent Lucknow Call Girls 8923113531WhatsApp Lucknow Call Girls make you...
Independent Lucknow Call Girls 8923113531WhatsApp Lucknow Call Girls make you...Independent Lucknow Call Girls 8923113531WhatsApp Lucknow Call Girls make you...
Independent Lucknow Call Girls 8923113531WhatsApp Lucknow Call Girls make you...
 
OAT_RI_Ep19 WeighingTheRisks_Apr24_TheYellowMetal.pptx
OAT_RI_Ep19 WeighingTheRisks_Apr24_TheYellowMetal.pptxOAT_RI_Ep19 WeighingTheRisks_Apr24_TheYellowMetal.pptx
OAT_RI_Ep19 WeighingTheRisks_Apr24_TheYellowMetal.pptx
 
VIP Call Girls Thane Sia 8617697112 Independent Escort Service Thane
VIP Call Girls Thane Sia 8617697112 Independent Escort Service ThaneVIP Call Girls Thane Sia 8617697112 Independent Escort Service Thane
VIP Call Girls Thane Sia 8617697112 Independent Escort Service Thane
 
letter-from-the-chair-to-the-fca-relating-to-british-steel-pensions-scheme-15...
letter-from-the-chair-to-the-fca-relating-to-british-steel-pensions-scheme-15...letter-from-the-chair-to-the-fca-relating-to-british-steel-pensions-scheme-15...
letter-from-the-chair-to-the-fca-relating-to-british-steel-pensions-scheme-15...
 
High Class Call Girls Nagpur Grishma Call 7001035870 Meet With Nagpur Escorts
High Class Call Girls Nagpur Grishma Call 7001035870 Meet With Nagpur EscortsHigh Class Call Girls Nagpur Grishma Call 7001035870 Meet With Nagpur Escorts
High Class Call Girls Nagpur Grishma Call 7001035870 Meet With Nagpur Escorts
 
VIP Call Girls LB Nagar ( Hyderabad ) Phone 8250192130 | ₹5k To 25k With Room...
VIP Call Girls LB Nagar ( Hyderabad ) Phone 8250192130 | ₹5k To 25k With Room...VIP Call Girls LB Nagar ( Hyderabad ) Phone 8250192130 | ₹5k To 25k With Room...
VIP Call Girls LB Nagar ( Hyderabad ) Phone 8250192130 | ₹5k To 25k With Room...
 
How Automation is Driving Efficiency Through the Last Mile of Reporting
How Automation is Driving Efficiency Through the Last Mile of ReportingHow Automation is Driving Efficiency Through the Last Mile of Reporting
How Automation is Driving Efficiency Through the Last Mile of Reporting
 
Log your LOA pain with Pension Lab's brilliant campaign
Log your LOA pain with Pension Lab's brilliant campaignLog your LOA pain with Pension Lab's brilliant campaign
Log your LOA pain with Pension Lab's brilliant campaign
 
High Class Call Girls Nashik Maya 7001305949 Independent Escort Service Nashik
High Class Call Girls Nashik Maya 7001305949 Independent Escort Service NashikHigh Class Call Girls Nashik Maya 7001305949 Independent Escort Service Nashik
High Class Call Girls Nashik Maya 7001305949 Independent Escort Service Nashik
 
Dharavi Russian callg Girls, { 09892124323 } || Call Girl In Mumbai ...
Dharavi Russian callg Girls, { 09892124323 } || Call Girl In Mumbai ...Dharavi Russian callg Girls, { 09892124323 } || Call Girl In Mumbai ...
Dharavi Russian callg Girls, { 09892124323 } || Call Girl In Mumbai ...
 
Instant Issue Debit Cards - School Designs
Instant Issue Debit Cards - School DesignsInstant Issue Debit Cards - School Designs
Instant Issue Debit Cards - School Designs
 
Monthly Market Risk Update: April 2024 [SlideShare]
Monthly Market Risk Update: April 2024 [SlideShare]Monthly Market Risk Update: April 2024 [SlideShare]
Monthly Market Risk Update: April 2024 [SlideShare]
 
Andheri Call Girls In 9825968104 Mumbai Hot Models
Andheri Call Girls In 9825968104 Mumbai Hot ModelsAndheri Call Girls In 9825968104 Mumbai Hot Models
Andheri Call Girls In 9825968104 Mumbai Hot Models
 
Dividend Policy and Dividend Decision Theories.pptx
Dividend Policy and Dividend Decision Theories.pptxDividend Policy and Dividend Decision Theories.pptx
Dividend Policy and Dividend Decision Theories.pptx
 
Russian Call Girls In Gtb Nagar (Delhi) 9711199012 💋✔💕😘 Naughty Call Girls Se...
Russian Call Girls In Gtb Nagar (Delhi) 9711199012 💋✔💕😘 Naughty Call Girls Se...Russian Call Girls In Gtb Nagar (Delhi) 9711199012 💋✔💕😘 Naughty Call Girls Se...
Russian Call Girls In Gtb Nagar (Delhi) 9711199012 💋✔💕😘 Naughty Call Girls Se...
 
Vip B Aizawl Call Girls #9907093804 Contact Number Escorts Service Aizawl
Vip B Aizawl Call Girls #9907093804 Contact Number Escorts Service AizawlVip B Aizawl Call Girls #9907093804 Contact Number Escorts Service Aizawl
Vip B Aizawl Call Girls #9907093804 Contact Number Escorts Service Aizawl
 
VIP Kolkata Call Girl Serampore 👉 8250192130 Available With Room
VIP Kolkata Call Girl Serampore 👉 8250192130  Available With RoomVIP Kolkata Call Girl Serampore 👉 8250192130  Available With Room
VIP Kolkata Call Girl Serampore 👉 8250192130 Available With Room
 
20240417-Calibre-April-2024-Investor-Presentation.pdf
20240417-Calibre-April-2024-Investor-Presentation.pdf20240417-Calibre-April-2024-Investor-Presentation.pdf
20240417-Calibre-April-2024-Investor-Presentation.pdf
 
Call Girls In Yusuf Sarai Women Seeking Men 9654467111
Call Girls In Yusuf Sarai Women Seeking Men 9654467111Call Girls In Yusuf Sarai Women Seeking Men 9654467111
Call Girls In Yusuf Sarai Women Seeking Men 9654467111
 
Call Girls Service Nagpur Maya Call 7001035870 Meet With Nagpur Escorts
Call Girls Service Nagpur Maya Call 7001035870 Meet With Nagpur EscortsCall Girls Service Nagpur Maya Call 7001035870 Meet With Nagpur Escorts
Call Girls Service Nagpur Maya Call 7001035870 Meet With Nagpur Escorts
 

Energy & Commodities, No. 2 - February 9, 2012

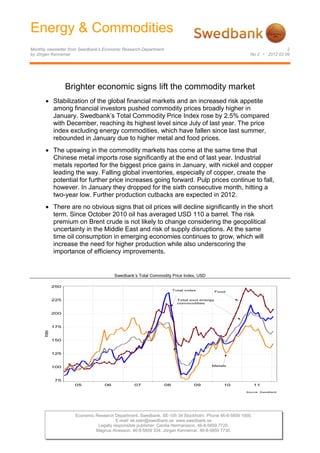
  • 1. Energy & Commodities Monthly newsletter from Swedbank’s Economic Research Department 2 by Jörgen Kennemar No 2 • 2012 02 09 Brighter economic signs lift the commodity market Stabilization of the global financial markets and an increased risk appetite among financial investors pushed commodity prices broadly higher in January. Swedbank’s Total Commodity Price Index rose by 2.5% compared with December, reaching its highest level since July of last year. The price index excluding energy commodities, which have fallen since last summer, rebounded in January due to higher metal and food prices. The upswing in the commodity markets has come at the same time that Chinese metal imports rose significantly at the end of last year. Industrial metals reported for the biggest price gains in January, with nickel and copper leading the way. Falling global inventories, especially of copper, create the potential for further price increases going forward. Pulp prices continue to fall, however. In January they dropped for the sixth consecutive month, hitting a two-year low. Further production cutbacks are expected in 2012. There are no obvious signs that oil prices will decline significantly in the short term. Since October 2010 oil has averaged USD 110 a barrel. The risk premium on Brent crude is not likely to change considering the geopolitical uncertainty in the Middle East and risk of supply disruptions. At the same time oil consumption in emerging economies continues to grow, which will increase the need for higher production while also underscoring the importance of efficiency improvements. EnergirÃ¥varor Swedbank’s Total Commodity Price Index, USD 250 Total index Food RÃ¥varuprisindex totalt 225 Total excl energy commodities 200 sive energirÃ¥varor 175 Index 150 125 100 Metals 75 05 06 07 08 09Metaller 10 11 Source: Swedbank Economic Research Department. Swedbank. SE-105 34 Stockholm. Phone 46-8-5859 1000. E-mail: ek.sekr@swedbank.se www.swedbank.se Legally responsible publisher: Cecilia Hermansson. 46-8-5859 7720. Magnus Alvesson. 46-8-5859 334. Jörgen Kennemar. 46-8-5859 7730.
  • 2. Energy & Commodities Monthly newsletter from Swedbank’s Economic Research Department, continue No 2 • 2012 02 09 U.S The downward trend in commodity prices since the its broad application in industry and construction, second half of 2011 has leveled off this year, which rose by an average of 6% and has again passed partly covaries with the improvement in global USD 8 000 a ton. Aluminum, which is used to industrial activity. The Global Purchasing Managers manufacture aircraft and machinery, among other Index (PMI) rose in January and is in the growth things, saw less of a price decline last fall compared zone for the second month in a row. Better growth with other base metals. In January aluminum rose numbers from the US are also pushing commodity by 5.7% after having steadily fallen during the fall. prices higher. At the same time investor interest in, Zinc and lead have also risen in price, but at a more and risk appetite for, commodities has returned modest pace. Iron ore and scrap rose a modest partly because central banks, especially the 1.8% compared with January 2011. European Central Bank (ECB), have taken aggressive monetary action to boost liquidity in the Price trend for industrial metals, January 2011=100 115 international financial markets after fiscal policies EMU were tightened. This created greater confidence in 110 the financial markets and led to lower TED spreads 105 in Europe. The stabilization of the financial markets rests on shaky ground, however, and could change 100 quickly, especially if the sovereign debt crisis in the Index, Jan 2011=100 95 euro zone worsens. Sweden 90 Interbanks interest rates minus government treasury, TED 85 spreads 80 1,50 75 70 1,25 65 EMU jan feb mar apr maj jun jul aug sep okt nov dec jan 11 12 1,00 Copper Lead Nickel Zinc Aluminium Source: Swedbank Sweden 0,75 The rebound in metal prices in the last month has UK happened at the same time that Chinese demand 0,50 has risen, as evident by December import data. Less concern about a hard landing for the Chinese economy and indications of a growing Chinese 0,25 USA inventory build-up are driving metal prices broadly Japan higher. Inventory changes will mean price volatility, 0,00 however, unless underlying demand strengthens. jan apr jul okt jan apr jul okt jan apr jul okt jan 09 10 11 12 There have also been signs that the Chinese will Source: Reuters EcoWin loosen their monetary policy, which is partly supported by a decline in inflation to a more Swedbank’s Total Commodity Price Index rose comfortable 4.1% in December. Temporarily lower by 2.5% in January in USD compared with metal extraction has tightened supply conditions December, reaching its highest level since July of during the fall and winter, especially for copper. last year. Measured in euro, the increase was 4.7%. Production by the largest mining companies such Excluding energy commodities, the index rose by as BHP Billiton, Xstrata, Anglo American and Rio 2.8% in USD after having fallen for eight Tinto fell by 273 000 tons or 8.2% in 2011. This has consecutive months by a total of 20%. Industrial led to rapidly shrinking copper inventories, which at metals saw the fastest price gain in January, the time of writing are at their lowest levels in over climbing as much as 6.1%, the largest monthly two years. Metal prices in coming quarters will change since August 2010. Nickel rose to nearly depend in large part on how much emerging USD 19 800 a ton in January, up almost 9% in one economies can keep growing when several OECD month. This is a significant increase compared with countries are in recession. This also applies to the last year, when nickel had the weakest price trend global financial markets. Additional liquidity- of any industrial metal. The price of copper, which is boosting measures by central banks raise the considered a reliable economic indicator because of likelihood of a further increase in metal prices,
  • 3. Energy & Commodity Monthly newsletter from Swedbank’s Economic Research Department, continue No 2 • 2012 02 09 despite that global growth prospects are relatively projected to rise by 3.2% in emerging economies, modest. while continuing to fall, by 0.3%, in mature industrial countries. Although China is the world's second High oil prices are here to stay largest oil consumer, per capita it is significantly Despite that global oil consumption fell in the last below the OECD average, a gap that will gradually quarter of 2011, prices have been stuck at a high shrink. Higher oil prices also tend to drive up the level. Brent crude was an average of 2.4% higher in price of coal. In January coal rose by 3.4% in USD January, at USD 110 a barrel, which could hurt the from the previous month. This is the first time in already shaky global economy and thus demand for three months that the price of coal has risen. oil products. The cold weather in Europe contributed to a widening price difference between A cold winter is cutting into food supplies European Brent crude and US crude. Global food prices have fluctuated greatly in recent years. Increased speculation, production Brent crude price in USD disruptions owing to unfavorable weather conditions 150 and growing competition between food and energy 140 production are affecting the balance between 130 supply and demand. At the same time the world's 120 population and purchasing power are growing, so 110 demand is trending higher, especially in emerging economies. 100 USD/fat 90 Grain prices, index 80 500 70 60 450 50 Wheat 400 40 350 30 05 06 07 08 09 10 11 12 300 Cereals Källa: Swedbank, Reuters EcoWin 250 The rise in oil prices has also been driven by 200 uncertainty about supplies and geopolitical developments in the Middle East. The EU’s oil 150 embargo on Iran, which will have its full effect this Corn summer, and the Iranian threat to block or limit oil 100 shipments through the Strait of Hormuz have raised 50 oil’s risk premium. The embargo, which represents 05 06 07 08 09 10 11 12 600 000 fat barrels a day, is not expected to have a Source: Reuters EcoWin major impact on supplies, since Saudi Arabia has Increased global food production in 2011 and rising promised to raise its production. There could be a inventories contributed to a broad decline in prices bigger shortage of petroleum products, however, in the second half-year at the same time that especially in Italy and Spain, where refineries investors were seeking out safe harbors in the wake mainly process lighter, low-sulfur Iranian oil. Iran is of the fiscal crisis. After peaking in February 2011, the fifth largest oil producer at 3.6 million barrels a Swedbank’s Commodity Price Index fell by nearly day, most of which is exported to China, India and 20% in USD through last December. In January, Japan – economies with growing demand. In however, prices rose by an average of 2.3% in USD Japan, this is mainly due to the tsunami disaster after having fallen for four consecutive months. The and shutdown of a number of nuclear power plants. unusually cold weather in Russia and Ukraine and None of these countries is planning to cut back on speculation about Russian export restrictions on their imports from Iran, which should also reduce grain have driven prices higher. An extended cold the risk of increased imbalances in the global oil snap could also have a negative effect on market. At the same time there is a clear shift in production over the course of 2012. global oil consumption, where emerging economies led by Asia are taking a growing slice. This trend is Prices of forest commodities continued to fall during expected to continue. This year consumption is the first month of the year. Pulp prices fell in USD 3 (6)
  • 4. Energy & Commodities Monthly newsletter from Swedbank’s Economic Research Department, continue No 2 • 2012 02 09 by 1.7% between December and January, which interest. Silver has risen in USD by slightly over was a smaller decline than in recent months. Weak 20% since the beginning of the year, against 13% global demand and overcapacity are contributing to for gold. This is also a sign of an increased risk the downward trend, because of which pulp has appetite in the financial markets. In addition to fallen by 18% since peaking in July 2011 at just greater speculation, the price rise is being driven by over USD 1 000 a ton. This is also a signal of higher industrial consumption of silver. The fiscal further production cutbacks going forward. crisis in the EMU countries and liquidity support from central banks suggest further price increases Price trend for various agricultural products, USD for precious metals. 1200 225 Gold and silver, index 1100 200 1000 Index, 2000=100 1000 175 900 900 150 800 USD/Ton (metric) USc/Pound 800 125 700 700 100 600 Index 500 600 75 400 500 50 300 400 25 00 01 02 03 04 05 06 07 08 09 10 11 200 Pulp Cotton Source: Reuters EcoWin 100 jan maj sep jan maj sep jan maj sep jan maj sep jan 08 09 10 11 12 Increased liquidity lifts precious metals Gold Silver Source: Reuters EcoWin The decline in the prices of gold and silver last fall has been followed this year by renewed investor Jörgen Kennemar
  • 5. Energy & Commodities Monthly newsletter from Swedbank’s Economic Research Department 2 by Jörgen Kennemar No 2 • 2012 02 09 Swedbank Commodity Index - US$ - Swedbank Commodity Index - SKr - Basis 2000 = 1oo 10-02-12 Basis 2000 = 1oo 10-02-12 11.2011 12.2011 1.2012 11.2011 12.2011 1.2012 T otal index 365,0 359,7 368,7 T otal index 267,4 267,8 274,5 Per cent change month ago 2,5 -1,4 2,5 Per cent change month ago 3,9 0,2 2,5 Per cent change year ago 22,8 14,5 12,7 Per cent change year ago 21,4 14,6 15,8 T otal index exclusive energy 269,5 264,1 271,5 T otal index exclusive energy 197,4 196,6 202,2 Per cent change month ago -4,6 -2,0 2,8 Per cent change month ago -3,3 -0,4 2,8 Per cent change year ago -5,0 -9,8 -12,0 Per cent change year ago -6,2 -9,6 -9,7 Food, tropical beverages 268,6 258,7 264,8 Food, tropical beverages 196,8 192,6 197,2 Per cent change month ago -2,3 -3,7 2,4 Per cent change month ago -1,0 -2,1 2,4 Per cent change year ago -0,6 -9,6 -12,5 Per cent change year ago -1,7 -9,5 -10,1 Cereals 277,2 269,0 275,5 Cereals 203,1 200,3 205,1 Per cent change month ago -1,6 -3,0 2,4 Per cent change month ago -0,3 -1,4 2,4 Per cent change year ago 7,8 -3,5 -6,5 Per cent change year ago 6,6 -3,4 -4,0 T ropical beverages and tobacco 286,5 274,0 277,0 T ropical beverages and tobacco 209,9 204,0 206,2 Per cent change month ago -2,5 -4,4 1,1 Per cent change month ago -1,2 -2,8 1,1 Per cent change year ago 0,5 -9,1 -12,6 Per cent change year ago -0,7 -9,0 -10,3 Coffee 193,7 189,1 188,7 Coffee 141,9 140,8 140,5 Per cent change month ago -0,2 -2,4 -0,2 Per cent change month ago 1,1 -0,8 -0,2 Per cent change year ago 11,4 2,9 -4,4 Per cent change year ago 10,1 3,0 -1,8 Oilseeds and oil 224,2 218,8 231,3 Oilseeds and oil 164,3 162,9 172,2 Per cent change month ago -2,4 -2,4 5,7 Per cent change month ago -1,1 -0,8 5,7 Per cent change year ago -8,9 -15,2 -16,3 Per cent change year ago -10,0 -15,1 -14,1 Industrial raw materials 269,8 265,7 273,5 Industrial raw materials 197,6 197,8 203,6 Per cent change month ago -5,2 -1,5 2,9 Per cent change month ago -3,9 0,1 2,9 Per cent change year ago -6,3 -9,8 -11,9 Per cent change year ago -7,4 -9,7 -9,5 Agricultural raw materials 173,7 167,1 166,8 Agricultural raw materials 127,3 124,4 124,2 Per cent change month ago -7,1 -3,8 -0,2 Per cent change month ago -5,8 -2,2 -0,2 Per cent change year ago -8,9 -13,5 -16,9 Per cent change year ago -10,0 -13,4 -14,7 Cotton 96,2 89,1 96,3 Cotton 70,5 66,3 71,7 Per cent change month ago -4,9 -7,4 8,1 Per cent change month ago -3,7 -5,9 8,1 Per cent change year ago -27,1 -36,7 -36,5 Per cent change year ago -28,0 -36,6 -34,8 Softwood 138,3 132,3 129,7 Softwood 101,3 98,5 96,6 Per cent change month ago -4,4 -4,3 -2,0 Per cent change month ago -3,1 -2,8 -2,0 Per cent change year ago -7,4 -8,5 -10,1 Per cent change year ago -8,5 -8,4 -7,6 W oodpulp 887,3 846,0 831,6 W oodpulp 650,0 629,9 619,2 Per cent change month ago -4,6 -4,7 -1,7 Per cent change month ago -3,3 -3,1 -1,7 Per cent change year ago -7,3 -10,9 -12,4 Per cent change year ago -8,4 -10,8 -10,0 N on-ferrous metals 232,3 229,6 243,6 Non-ferrous metals 170,2 171,0 181,4 Per cent change month ago -1,9 -1,2 6,1 Per cent change month ago -0,5 0,5 6,1 Per cent change year ago -13,0 -16,6 -13,2 Per cent change year ago -12,0 -16,7 -15,5 Copper 5532,2 5635,0 5972,0 Copper 7551,4 7568,2 8020,8 Per cent change month ago 3,8 1,9 6,0 Per cent change month ago 2,4 0,2 6,0 Per cent change year ago -11,9 -17,0 -13,9 Per cent change year ago -10,8 -17,1 -16,1 Aluminium 1518,8 1504,0 1590,3 Aluminium 2073,2 2020,0 2135,9 Per cent change month ago -3,4 -1,0 5,7 Per cent change month ago -4,7 -2,6 5,7 Per cent change year ago -12,2 -13,8 -10,1 Per cent change year ago -11,1 -13,9 -12,5 Lead 1451,7 1501,8 1555,1 Lead 1981,6 2017,0 2088,6 Per cent change month ago 3,2 3,4 3,5 Per cent change month ago 1,8 1,8 3,5 Per cent change year ago -17,6 -16,0 -17,5 Per cent change year ago -16,6 -16,1 -19,7 Z inc 1403,5 1424,0 1469,3 Z inc 1915,7 1912,5 1973,4 Per cent change month ago 4,4 1,5 3,2 Per cent change month ago 3,0 -0,2 3,2 Per cent change year ago -17,4 -15,7 -14,6 Per cent change year ago -16,4 -15,8 -16,9 Nickel 13098,6 13530,0 14703,8 N ickel 17879,4 18171,7 19748,2 Per cent change month ago -4,2 3,3 8,7 Per cent change month ago -5,5 1,6 8,7 Per cent change year ago -22,9 -24,3 -20,8 Per cent change year ago -21,9 -24,5 -22,9 Iron ore, steel scrap 454,9 461,0 469,4 Iron ore, steel scrap 620,9 619,2 630,4 Per cent change month ago -6,0 1,4 1,8 Per cent change month ago -7,2 -0,3 1,8 Per cent change year ago 1,8 2,2 -0,9 Per cent change year ago 3,0 2,0 -3,5 Energy raw materials 298,4 299,4 306,6 Energy raw materials 407,4 402,1 411,8 Per cent change month ago 6,2 0,3 2,4 Per cent change month ago 4,8 -1,3 2,4 Per cent change year ago 32,8 24,4 26,2 Per cent change year ago 34,4 24,2 22,9 Coking coal 313,8 314,8 326,5 Coking coal 428,4 422,8 438,5 Per cent change month ago -3,3 0,3 3,7 Per cent change month ago -4,6 -1,3 3,7 Per cent change year ago 4,1 -6,9 -8,2 Per cent change year ago 5,3 -7,0 -10,6 Crude oil 297,7 298,7 305,7 Crude oil 406,4 401,2 410,6 Per cent change month ago 6,7 0,3 2,3 Per cent change month ago 5,3 -1,3 2,3 Per cent change year ago 34,6 26,4 28,5 Per cent change year ago 36,2 26,2 25,1 Source : SW ED BAN K and H W W A-Institute for Economic R esearch H amburg c Source : SW EDBANK and HW W A-Institute for Economic Research Hamburg Swedbank Swedbank’s monthly Energy & Commodities newsletter is published as s service to our Economic Research Department customers. We believe that we have used reliable sources and methods in the preparation of the analyses reported in this publication. However, we cannot guarantee the accuracy or SE-105 34 Stockholm, Sweden completeness of the report and cannot be held responsible for any error or omission in the Phone 46-8-5859 7740 underlying material or its use. Readers are encouraged to base any (investment) decisions ek.sekr@swedbank.se on otjer material as well. Neither Swedbank nor its employees may be held responsible for www.swedbank.se losses or damages, direct or indirect, owing to any errors or omissions in Swedbanks Legally responsible publisher monthly Energy & Commodities newsletter. Cecilia Hermansson, 46-8-5859 7720. Magnus Alvesson, 46-8-5859 3341 Jörgen Kennemar, 46-8-5859 7730 Economic Research Department. Swedbank. SE-105 34 Stockholm. Phone 46-8-5859 1000. E-mail: ek.sekr@swedbank.se www.swedbank.se Legally responsible publisher: Cecilia Hermansson. 46-8-5859 7720. Magnus Alvesson. 46-8-5859 334. Jörgen Kennemar. 46-8-5859 7730.