Download to read offline
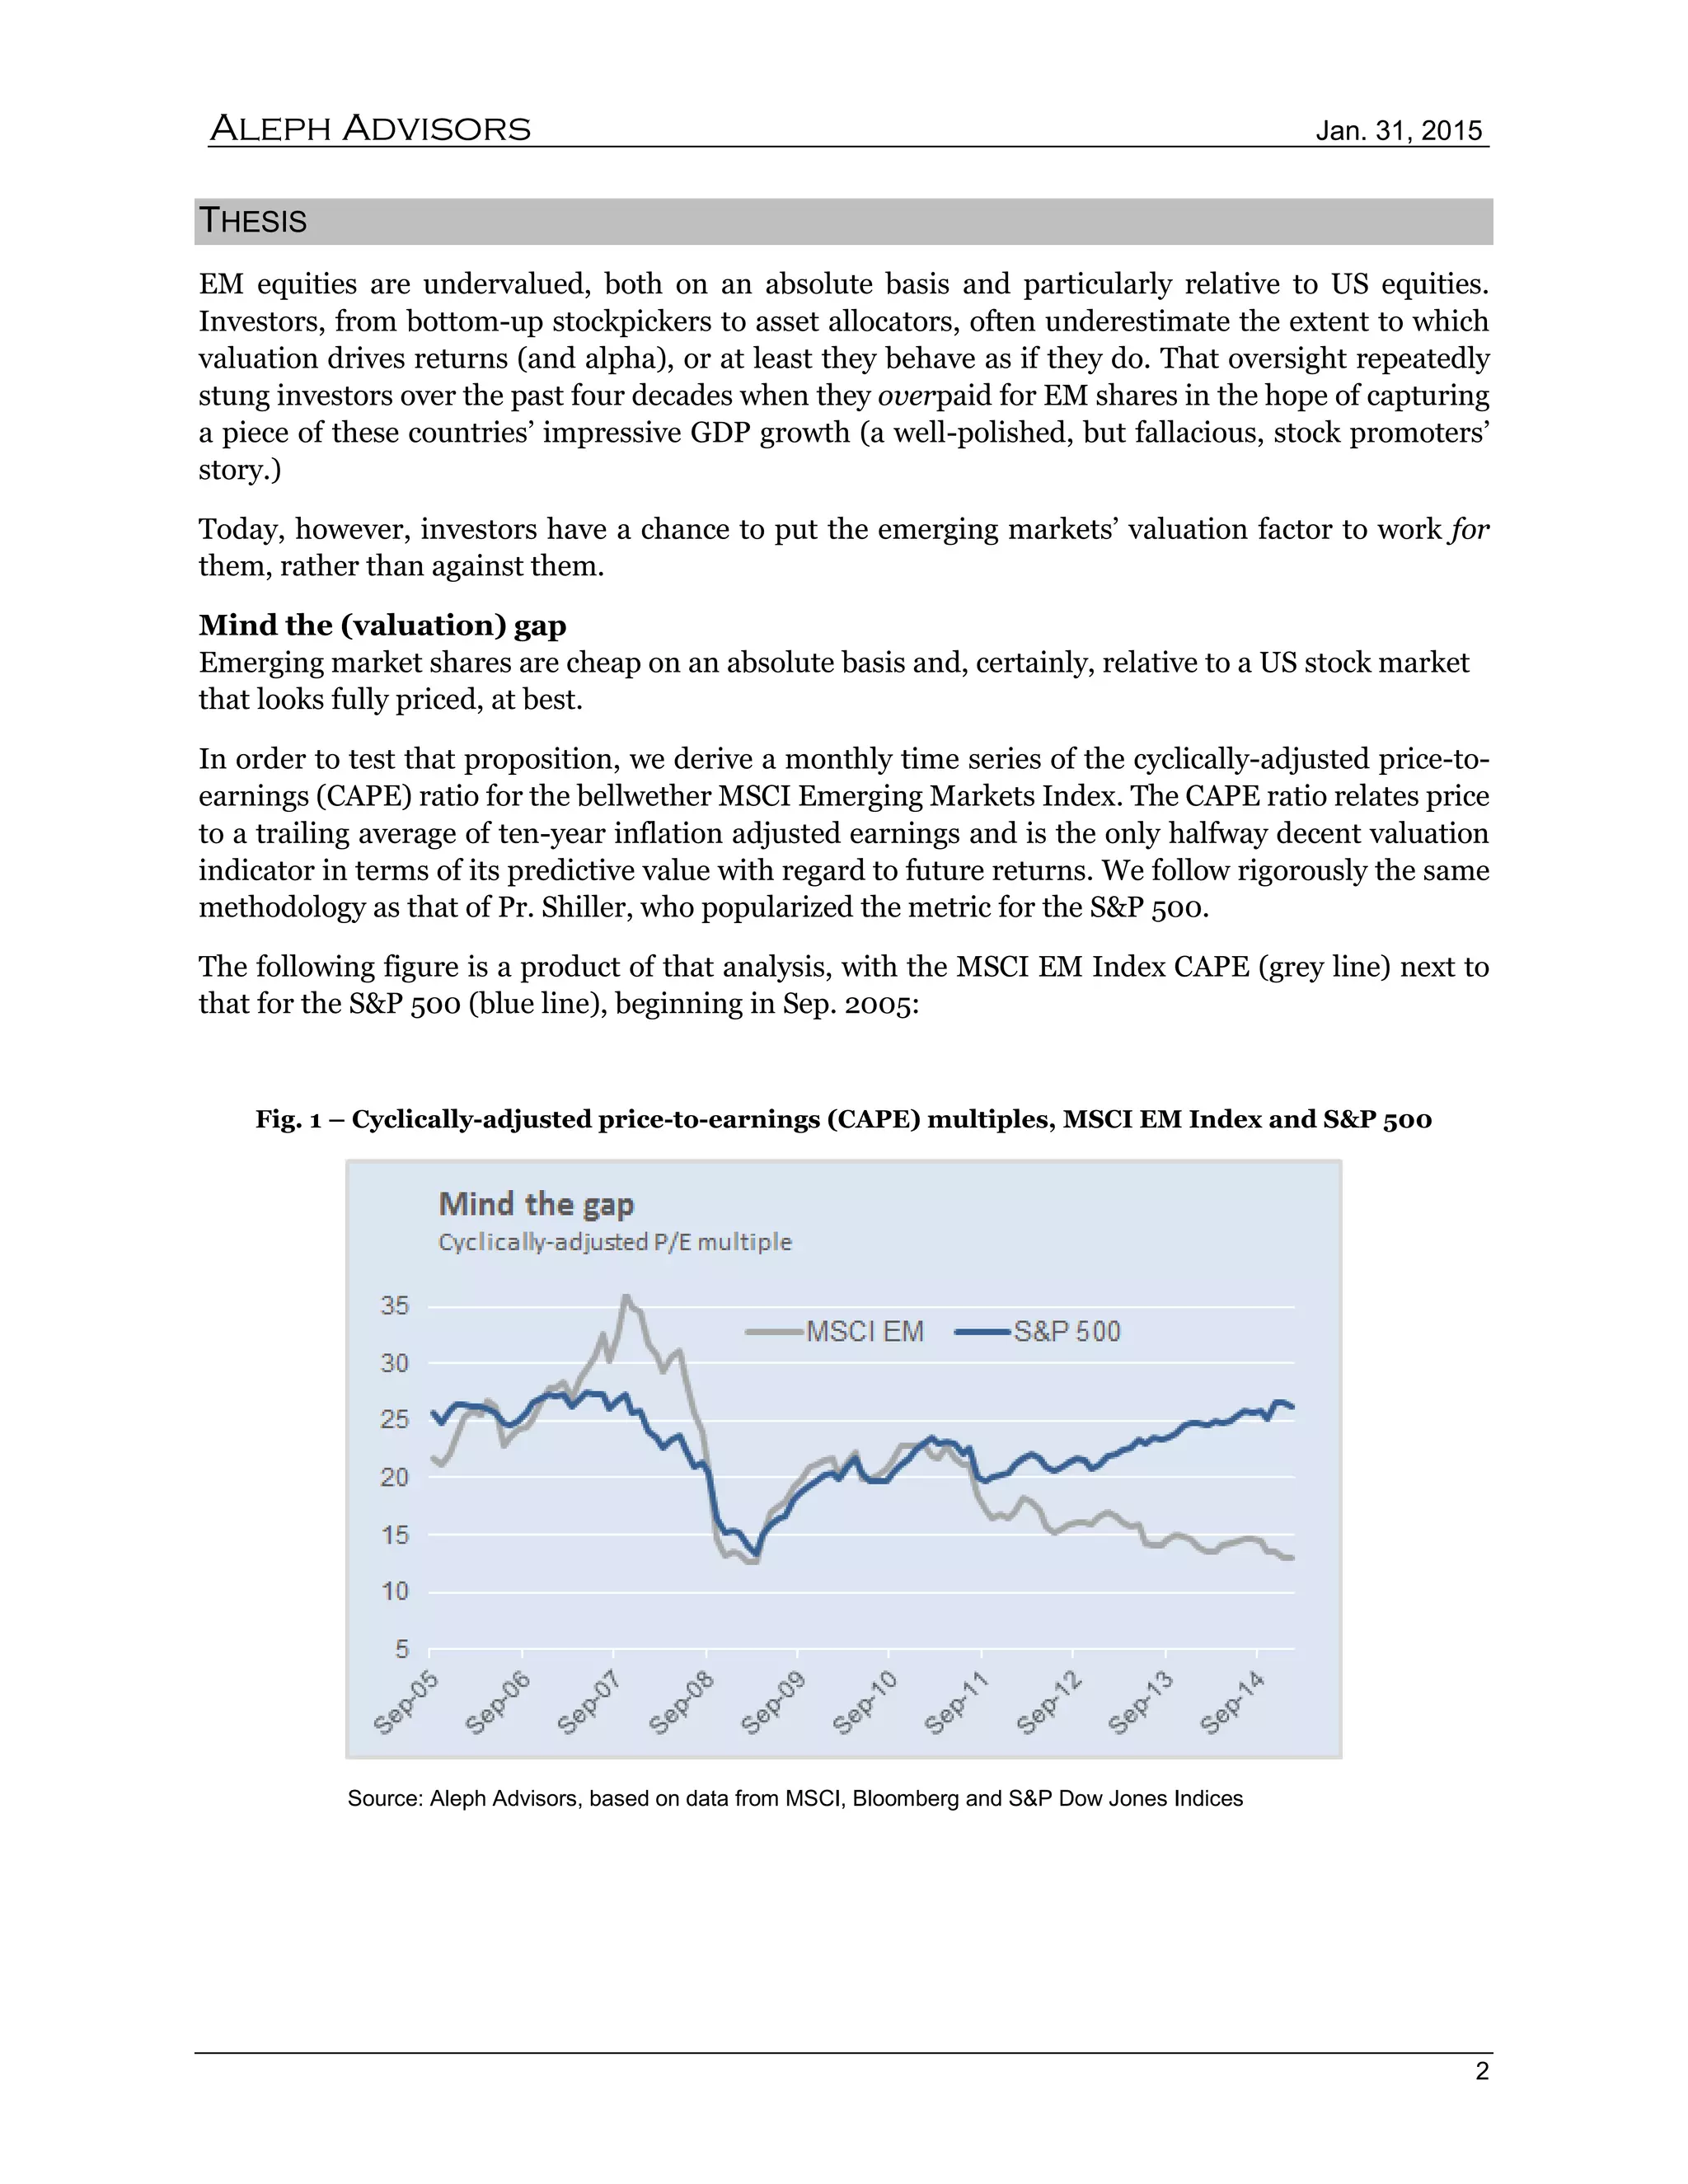
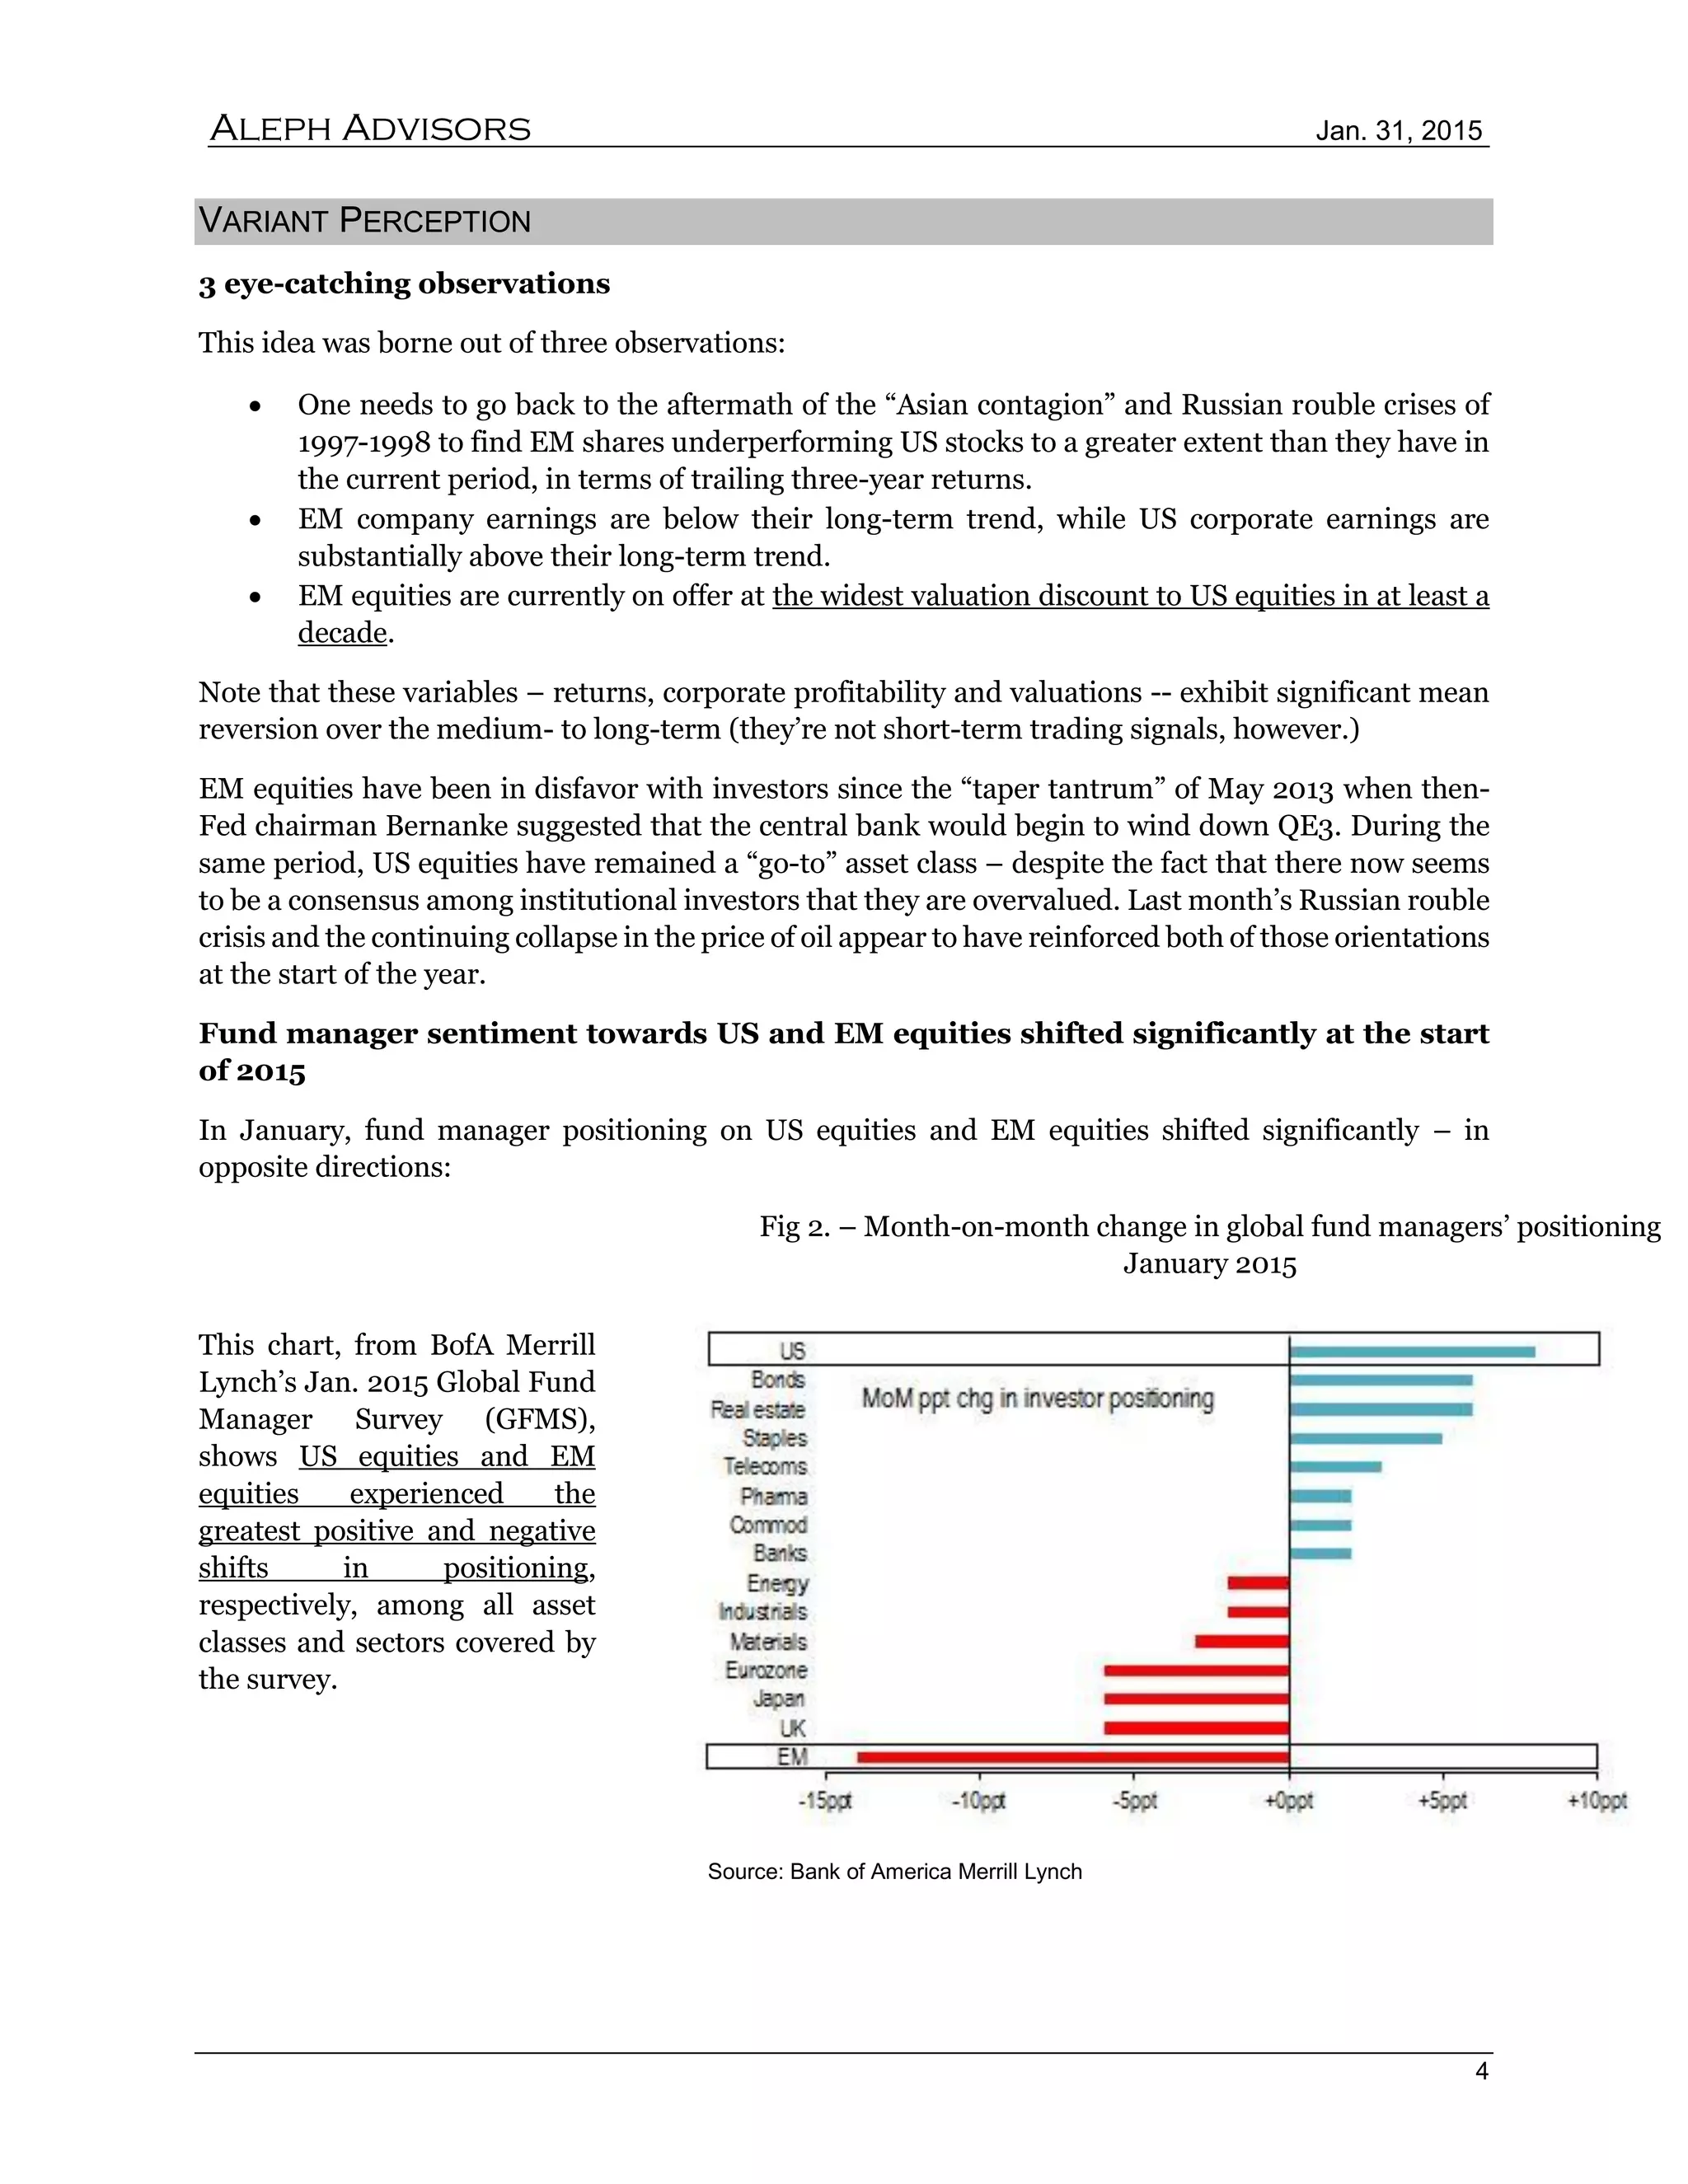
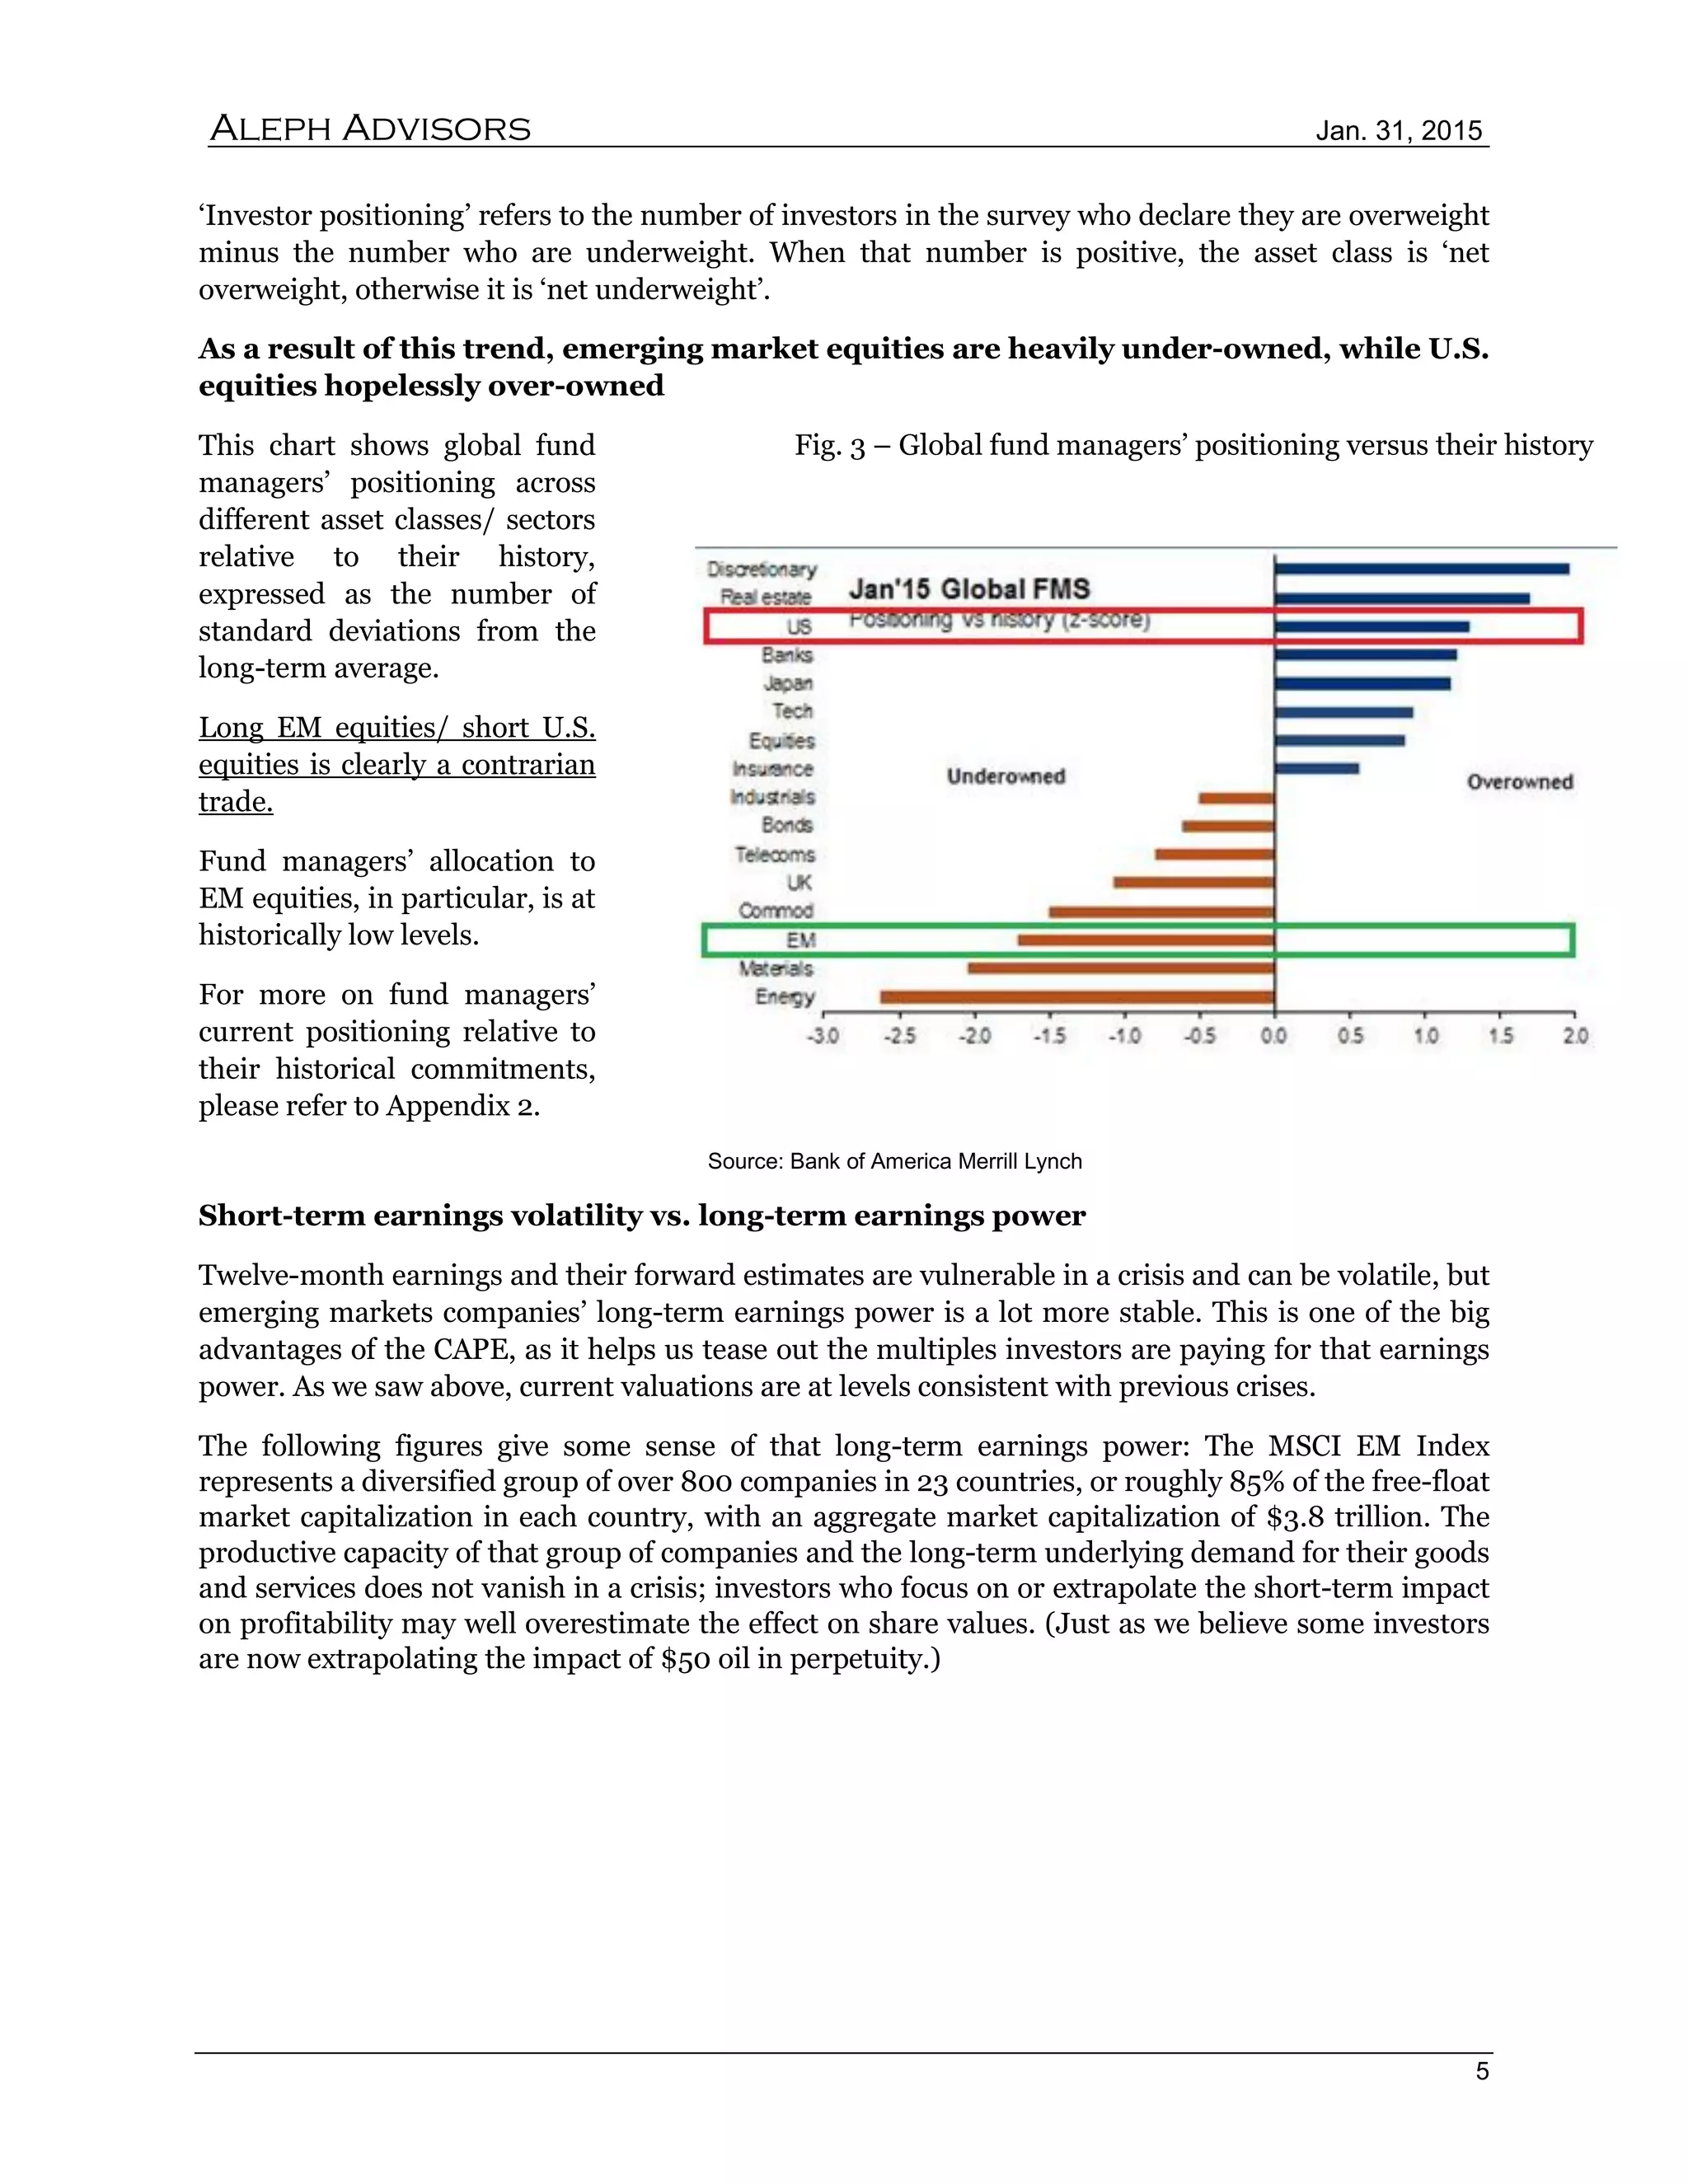

The document proposes a long position in emerging market equities and a short position in US equities based on the valuation gap between the two. Emerging market equities are significantly undervalued on an absolute basis and relative to the US market according to their cyclically adjusted price-to-earnings ratios. This valuation gap is the widest it has been in over a decade. The document also notes that emerging market earnings are below trend while US earnings are above trend and that investor positioning surveys show emerging markets are heavily underowned while the US is overowned, presenting an opportunity for mean reversion. The risks include a potential hard landing in China or full emerging market crisis pushing out returns.


