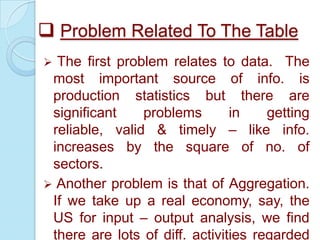
MANAGERIAL
ECONOMY
PRESENTATION
GROUP MEMBERS
NAME

ROLL NO.

MANOJ YADAV

40

REKHA YADAV

41

Submitted To
Prof.
Rachna
INPUT – OUTPUT
ANALYSIS
What is Input – Output Analysis?




Introduction:
“Analysis of inter – industry (or inter –
sector) flows (or deliveries) or analysis
of inter – industry relation.”
Input – output analysis may be
described as a mathematical study of
production structure of economy.
 Three points may be noted
input - output analysis


First, it studies the production structure or
output – mix of an economy consisting of a
number of production sectors.
 Secondly, the input – output analysis takes
into account the fact that the various
production
sectors
are
mutually
interdependent.
 Thirdly, the input – output analysis is
mathematical in character. It consists of
solving a set of simultaneous equations to
ascertain unknowns.
 THE METHODS OF INPUT – OUTPUT
ANALYSIS
First Step: Preparing Input – Output
Table.
 Second Step: Computing Technical
Coefficients.
 Third Step: Obtaining The Required Set
of Equations and Solving Them.
 Fourth Step: Towards an Exercise in
Substitution.

Second Step- Computing Technical
Coefficients:
Purchase From Agriculture to Agriculture :
1.00 / 5.00 = 0.20 Agriculture Input
Purchase From Agriculture to Industry:
2.00 / 5.00 = 0.40 Industrial Input
Purchase From Agriculture to Services:
0.20 / 5.00 = 0.04 Services Input
Purchase From Industry to Agriculture :
2.25 / 25 = 0.09 Agriculture Input
Purchase From Industry to Industry :
6.00 / 25 = 0.24 Industrial Input
Purchase From Industry to Services :
3.00 / 25 = 0.12 Services Input
Purchase From Services to Agriculture :
0.2 / 20 = 0.01 Agriculture Input
Purchase From Services to Industry :
1.00 / 20 = 0.05 Industrial Input
Purchase From Services to Services :
1.8 / 20 = 0.09 Services Input
Third Step-Obtaining the required set
of equations & Solving them
Agriculture must produce enough to
deliver to agriculture 0.20 of its total
production i.e. 0.20 A
2. Agriculture must produce enough to
deliver to Industry 0.09 of total Industrial
Production i.e. 0.09 I
3. Agriculture must produce enough to
deliver to service 0.01 of total services
Production i.e. 0.01 S
4. Besides, agriculture must deliver to
consumer Rs. 1.55 billion worth of
agricultural production. Thus we get
1.
A = 0.2 A+0.09 I+0.01 S+1.55
OR 0.8 A-0.09 I-0.01 S = 1.55
In the same way with the help of the
Second Row, we get
I = 0.40 A+0.24 I+0.05 S+16
OR -0.40 A+0.76 I-0.05 S=16
Finally with help of third row of the table
of technical coefficient, we get
S = 0.04 A+0.12 I+0.09 S+15
OR -0.04 A+0.12 I+0.91 S=15
Total Output A=5, I=25 & S=20.
Fourth Step-Exercise In Substitution:
Thus our three equations 1, 2 & 3 will look
as follows:
0.8 A-0.09 I-0.01 S=CA
-0.4 A+0.76 I+0.05 S=CI
-0.04 A-0.12 I+0.91 S=CS
We can solve this set of equation for A, I
& S & obtain:
A=1.3319CA+0.1614CI+0.0235CS
I=0.7110CA+1.4135CI+0.0855CS
S=0.1523CA+0.1935CI+1.1112CS
Now for any amount of CA, CI & CS, we can
immediately determine how much should be
produced in each of the sector with the help
of below example:
Suppose CA =1.55, CI =16.00 & CS =15.00
We then get, by substitution,
A=1.3319x1.55+0.1614x16+0.0235x15=5.00
I=0.7110x1.55+1.4135x16+0.0855x15=25.00
S=0.1523x1.55+0.1935x16+1.1112x15=20.0
0
We can check up these results with the
Input-Output
table
where
given
CA=1.55, CI=25.00 & CS=25.00, Agriculture is
Rs.5billion,
Industrial
Production
is
Rs.25billion & Services Production is
 Problem Related To The Table
The first problem relates to data. The
most important source of info. is
production statistics but there are
significant
problems
in
getting
reliable, valid & timely – like info.
increases by the square of no. of
sectors.
 Another problem is that of Aggregation.
If we take up a real economy, say, the
US for input – output analysis, we find
there are lots of diff. activities regarded

 Uses Of Input – Output Analysis
input – output table today is more
than record of past history & is
considered a very useful tool of
economic analysis.
 It is used for economic forecasting in
developed countries & economic
planning or programming in the
developing countries.
 Also useful for comparative analysis of
growth.
 An
THANK
YOU…

Eco

  • 1.
  • 2.
    GROUP MEMBERS NAME ROLL NO. MANOJYADAV 40 REKHA YADAV 41 Submitted To Prof. Rachna
  • 3.
  • 4.
    What is Input– Output Analysis?   Introduction: “Analysis of inter – industry (or inter – sector) flows (or deliveries) or analysis of inter – industry relation.” Input – output analysis may be described as a mathematical study of production structure of economy.
  • 5.
     Three pointsmay be noted input - output analysis  First, it studies the production structure or output – mix of an economy consisting of a number of production sectors.  Secondly, the input – output analysis takes into account the fact that the various production sectors are mutually interdependent.  Thirdly, the input – output analysis is mathematical in character. It consists of solving a set of simultaneous equations to ascertain unknowns.
  • 6.
     THE METHODSOF INPUT – OUTPUT ANALYSIS First Step: Preparing Input – Output Table.  Second Step: Computing Technical Coefficients.  Third Step: Obtaining The Required Set of Equations and Solving Them.  Fourth Step: Towards an Exercise in Substitution. 
  • 7.
    Second Step- ComputingTechnical Coefficients: Purchase From Agriculture to Agriculture : 1.00 / 5.00 = 0.20 Agriculture Input Purchase From Agriculture to Industry: 2.00 / 5.00 = 0.40 Industrial Input Purchase From Agriculture to Services: 0.20 / 5.00 = 0.04 Services Input Purchase From Industry to Agriculture : 2.25 / 25 = 0.09 Agriculture Input Purchase From Industry to Industry : 6.00 / 25 = 0.24 Industrial Input Purchase From Industry to Services : 3.00 / 25 = 0.12 Services Input
  • 8.
    Purchase From Servicesto Agriculture : 0.2 / 20 = 0.01 Agriculture Input Purchase From Services to Industry : 1.00 / 20 = 0.05 Industrial Input Purchase From Services to Services : 1.8 / 20 = 0.09 Services Input
  • 9.
    Third Step-Obtaining therequired set of equations & Solving them Agriculture must produce enough to deliver to agriculture 0.20 of its total production i.e. 0.20 A 2. Agriculture must produce enough to deliver to Industry 0.09 of total Industrial Production i.e. 0.09 I 3. Agriculture must produce enough to deliver to service 0.01 of total services Production i.e. 0.01 S 4. Besides, agriculture must deliver to consumer Rs. 1.55 billion worth of agricultural production. Thus we get 1.
  • 10.
    A = 0.2A+0.09 I+0.01 S+1.55 OR 0.8 A-0.09 I-0.01 S = 1.55 In the same way with the help of the Second Row, we get I = 0.40 A+0.24 I+0.05 S+16 OR -0.40 A+0.76 I-0.05 S=16 Finally with help of third row of the table of technical coefficient, we get S = 0.04 A+0.12 I+0.09 S+15 OR -0.04 A+0.12 I+0.91 S=15 Total Output A=5, I=25 & S=20.
  • 11.
    Fourth Step-Exercise InSubstitution: Thus our three equations 1, 2 & 3 will look as follows: 0.8 A-0.09 I-0.01 S=CA -0.4 A+0.76 I+0.05 S=CI -0.04 A-0.12 I+0.91 S=CS We can solve this set of equation for A, I & S & obtain: A=1.3319CA+0.1614CI+0.0235CS I=0.7110CA+1.4135CI+0.0855CS S=0.1523CA+0.1935CI+1.1112CS
  • 12.
    Now for anyamount of CA, CI & CS, we can immediately determine how much should be produced in each of the sector with the help of below example: Suppose CA =1.55, CI =16.00 & CS =15.00 We then get, by substitution, A=1.3319x1.55+0.1614x16+0.0235x15=5.00 I=0.7110x1.55+1.4135x16+0.0855x15=25.00 S=0.1523x1.55+0.1935x16+1.1112x15=20.0 0 We can check up these results with the Input-Output table where given CA=1.55, CI=25.00 & CS=25.00, Agriculture is Rs.5billion, Industrial Production is Rs.25billion & Services Production is
  • 13.
     Problem RelatedTo The Table The first problem relates to data. The most important source of info. is production statistics but there are significant problems in getting reliable, valid & timely – like info. increases by the square of no. of sectors.  Another problem is that of Aggregation. If we take up a real economy, say, the US for input – output analysis, we find there are lots of diff. activities regarded 
  • 14.
     Uses OfInput – Output Analysis input – output table today is more than record of past history & is considered a very useful tool of economic analysis.  It is used for economic forecasting in developed countries & economic planning or programming in the developing countries.  Also useful for comparative analysis of growth.  An
  • 15.