Download to read offline


![23
2.2 Remuneration benchmarking exercise
2.2.1 Information on the benchmarking sample and main remuneration trends
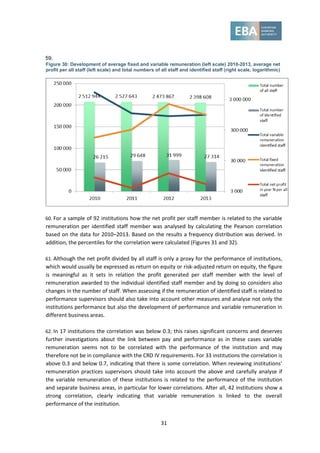
38. The sample of institutions included in the benchmarking exercise covers a major part of the
banking sector in the Union, containing groups of different sizes. Data were reported by EU
competent authorities and the Norwegian competent authority. The EBA has no information
detailing to what extent the data provided cover the market within each individual Member State.
39. In contrast to the data on high earners, the data reported for the benchmarking exercise
contain information on institutions’ staff within the full scope of prudential consolidation
(including activities in third countries). However, the last row of Figure 20, showing the number of
staff in EU credit institutions, refers to staff in EU credit institutions only.
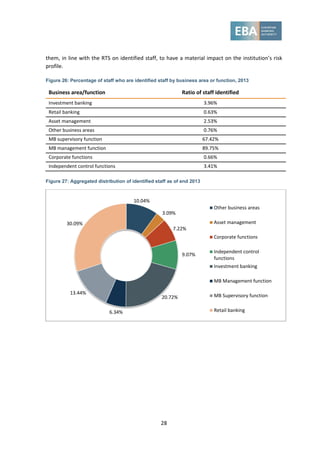
40. All institutions need to identify staff whose professional activities have a material impact on
the institution’s risk profile. The remuneration requirements apply at a consolidated level,
including subsidiaries that are not themselves subject to the CRD IV provisions. Identified staff’s
variable remuneration is in particular subject to additional prudential requirements including
deferral and pay out in instruments.
41. While there were a few changes within the sample, following mergers, acquisitions and the
withdrawal of an authorisation, its core remained stable over time. A few additional institutions
were added in 2013, mainly to reflect changes in market shares. Despite those additions the
number of staff represented within the sample decreased by around 83 000. The absolute
number of identified staff decreased slightly from 2012 to 2013; an increase can be expected
following the adoption of the RTS on identified staff in 2014.
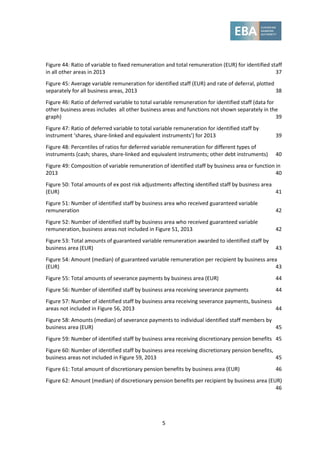
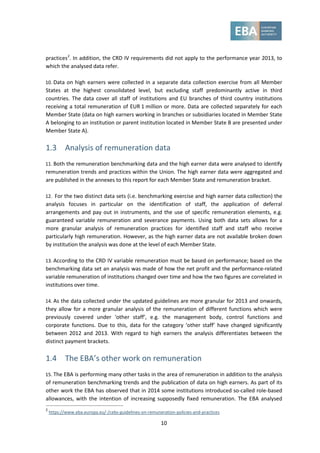
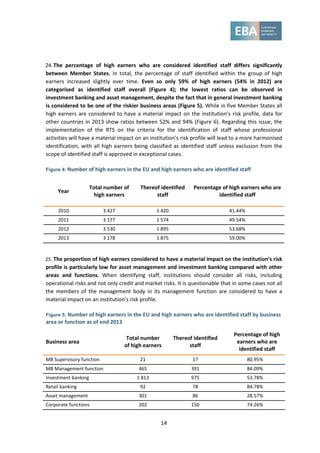
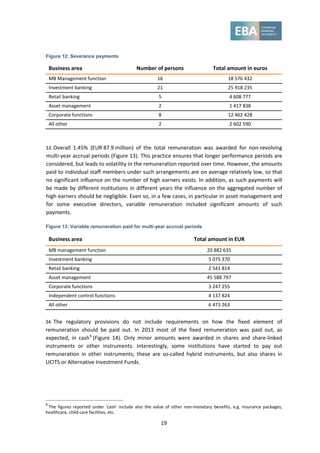
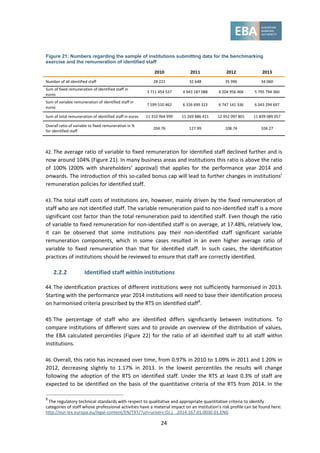
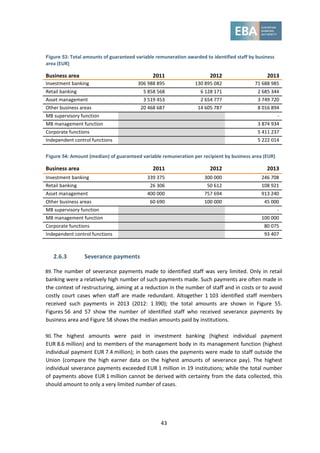
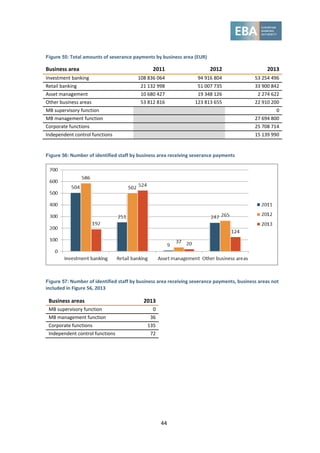
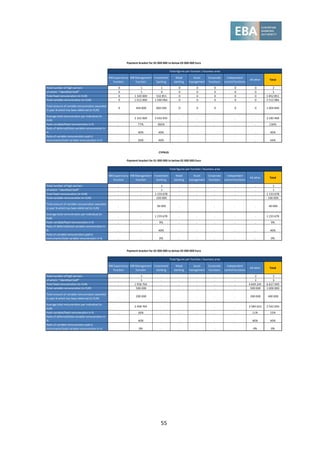
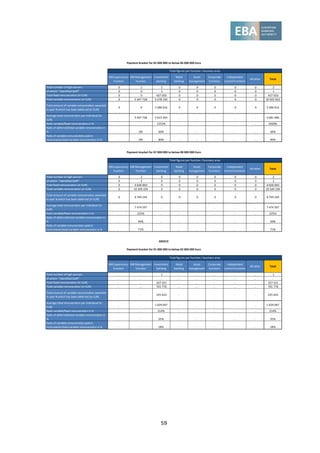
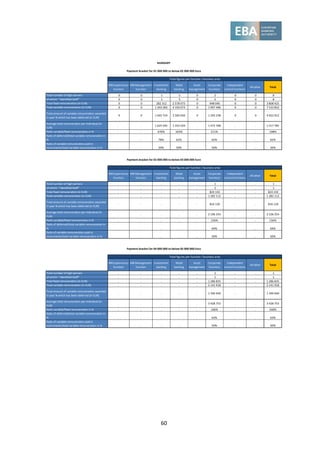
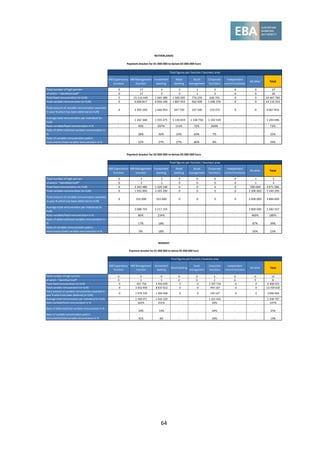
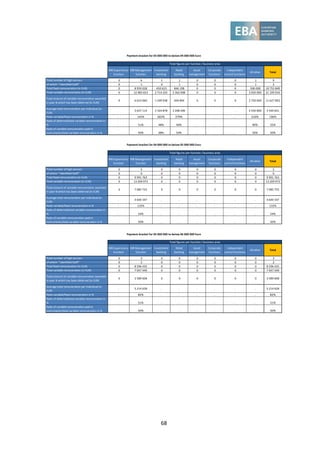
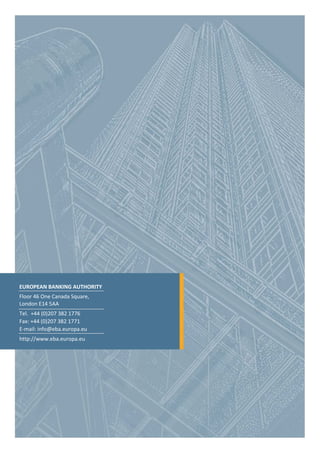
Figure 20: Numbers regarding the sample of institutions submitting data for the benchmarking exercise
and the remuneration of staff who are not identified staff
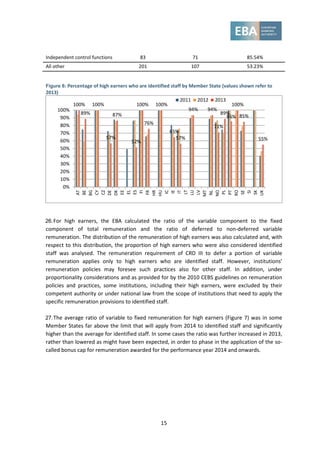
2010 2011 2012 2013
Number of groups of institutions 112 124 137 140
Number of all staff reported (includes all group
entities within the EEA)
2 915 962 2 992 753 2 993 067 2 910 229
Sum of fixed remuneration of non-identified staff - - - 131 009 588 354
Sum of variable remuneration of non-identified staff - - - 22 897 802 218
Overall ratio of variable to fixed remuneration in %
for non-identified staff
- - - 17.48
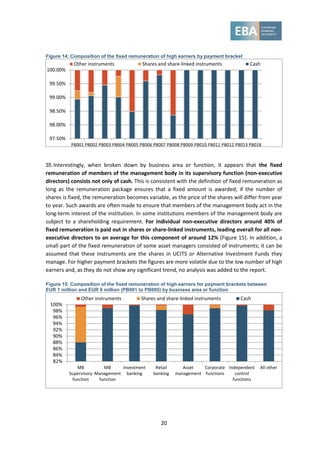
Number of staff in credit institutions within the EU
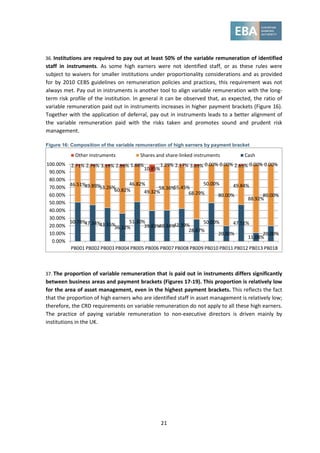
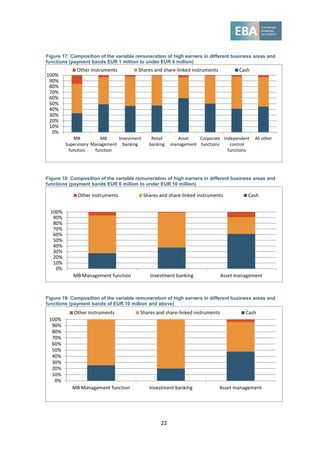
7]
3 111 352 3 115 199 3 063 539 2 987 976
7
Data from ECB statistical warehouse. The data in this row is referring to the number of staff in EU credit institutions
only, while the other data refers to institutions (i.e. credit institutions and investment firms) in the scope of prudential
consolidation (including activities in third countries) of the reporting institution.](https://image.slidesharecdn.com/ebamillionarbankers-150908121243-lva1-app6891/85/EBA-report-Bankers-2013-23-320.jpg)
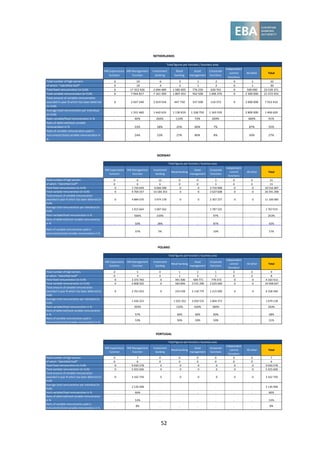


This document summarizes a report by the European Banking Authority (EBA) on benchmarking remuneration practices and data on high earners across the European Union in 2013. Key findings include: the number of high earners earning over 1 million euros increased slightly from 2010 to 2013; the percentage of high earners who were classified as "identified staff" with a material impact on risk also increased slightly over time but differed significantly between institutions; variable pay as a percentage of fixed pay and the use of deferred compensation also varied substantially between institutions and business lines.


