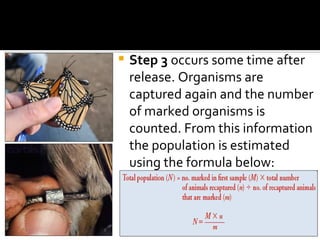
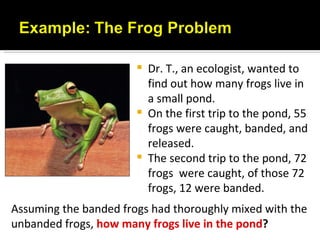
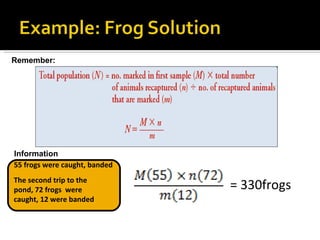
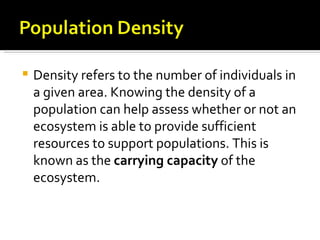
Unit 2: Dynamic Ecosytems
   The environment refers to all the factors
    present that impact on an organism. We
    categorise an environment into the abiotic
    and biotic factors.
   Abiotic factors are the physical and chemical
    factors present in an environment. Some
    examples are temperature, light intensity, pH
    of the soil, concentration of oxygen in water,
    etc.
   Biotic factors refer to the living things within
    the environment. Some examples include the
    presence of organisms of the same species,
    competitors (compete for food, water, etc),
    collaborators (work with the species to an
    advantage), predators, parasites, etc.
   Differences in physical conditions vertically
    across a habitat give rise to stratification.
   Differences in abiotic conditions give rise to
    stratification. These differences include the
    amount of light present, the strength of the
    wind and the humidity.

   These different conditions support different
    communities of organisms.
    Just are varying abiotic factors in a rainforest
     lead to stratification, the changing water
    level associated
    with tides creates
    intertidal zonation.
   It is important to measure factors within environments to
    better understand how they function. This knowledge is vital
    to conservation and restoration of the natural environment.
    Qualitative data refers to descriptions not involving
    numbers. E.g. the environment on the side of the cliff is
    rocky and very exposed to the elements.
   Quantitative data involves measurements e.g. the average
    temperature during the day was 32 degrees.
 Geographic range refers
                            to the area over which
                            can organism is found.
                           Geographic distribution
                            refers to the spread of an
                            organism within an
                            ecosystem.
                           Abundance refers to the
                            number of organisms
Geographic Range of the
                            present in an ecosystem
Platypus.
   What limits range and distribution? The resources
    available in an environment and the ability of the
    organism to obtain these resources (dependent on
    adaptations) limit the organisms range and
    distribution. Generally the greater the tolerance
    range of an organism the greater its range and
    distribution. Biotic factors can be responsible for
    limiting distribution within an ecosystem. Such
    factors include food sources and predators.
 It is important to know not only which species
  of organisms are present in an ecosystem and
  the relationships that exist between then but
  also where exactly these species are located
  within the ecosystem and how many of them
  are alive.
 Species are rarely spread evenly through an
  ecosystem rather they occur in patterns of
  distribution. Some common patterns are:
   Random distribution-
    organisms are irregularly
    spaced and the location
    of one species does not
    appear to affect the
    location of another;
    more common in plant
    populations.
   Uniform or continuous
    distribution- organisms
    are evenly spaced the
    presence of one
    organism determines
    how close or distant
    another organism will
    be; common in animal
    populations that are
    territorial.
   Clumped or grouped
    distribution- a number
    of individuals are
    grouped together and
    the groups make up
    the population as a
    whole; this may be to
    do with social
    behaviours such as
    schools of fish
 It is not always possible to directly measure a
  population. How can you count all of the
  birds within an ecosystem or all of the blades
  of grass?
 Instead ecologists use sampling techniques
  to provide estimates of populations.

   Such techniques include transects, quadrats,
    and capture-mark-recapture.
For organisms that do not move a quadrat can be a good
  method of estimating distribution and abundance.
  Quadrats can also be used to measure density. The
  position of quadrats within an ecosystem is selected at
  random. The number of particular species within the
  quadrat are counted and recorded. The total of all of the
  quadrats are averaged.
   A line transect can be used to
    measure the distribution of species
    in an ecosystem. They are especially
    helpful where we see environmental
    gradients- gradual changes in an
    ecosystem.
   We can also use vertical transect to
    investigate stratification in forests
    for example where different
    amounts of light, humidity and wind
    levels impact different species.
 Capture-mark-recapture is a method used to
  estimate the population of mobile species.
 Step 1 is to capture organisms randomly in a
  way that they are not harmed.
 Step 2 is to mark these organisms ensuring that
  the marking does not attract predators or cause
  harm. Tagging is a common form of marking
  animals. Insects are usually marked with a dot of
  ink. The animals are then returned to the
  environment.
   Step 3 occurs some time after
    release. Organisms are
    captured again and the number
    of marked organisms is
    counted. From this information
    the population is estimated
    using the formula below:
   Dr. T., an ecologist, wanted to
                           find out how many frogs live in
                           a small pond.
                          On the first trip to the pond, 55
                           frogs were caught, banded, and
                           released.
                          The second trip to the pond, 72
                           frogs were caught, of those 72
                           frogs, 12 were banded.
Assuming the banded frogs had thoroughly mixed with the
unbanded frogs, how many frogs live in the pond?
Remember:


Information
55 frogs were caught, banded
The second trip to the
pond, 72 frogs were            = 330frogs
caught, 12 were banded
   Density refers to the number of individuals in
    a given area. Knowing the density of a
    population can help assess whether or not an
    ecosystem is able to provide sufficient
    resources to support populations. This is
    known as the carrying capacity of the
    ecosystem.

Dynamic ecosystems - Population Sampling

  • 1.
    Unit 2: DynamicEcosytems
  • 2.
    The environment refers to all the factors present that impact on an organism. We categorise an environment into the abiotic and biotic factors.
  • 3.
    Abiotic factors are the physical and chemical factors present in an environment. Some examples are temperature, light intensity, pH of the soil, concentration of oxygen in water, etc.
  • 4.
    Biotic factors refer to the living things within the environment. Some examples include the presence of organisms of the same species, competitors (compete for food, water, etc), collaborators (work with the species to an advantage), predators, parasites, etc.
  • 5.
    Differences in physical conditions vertically across a habitat give rise to stratification.
  • 6.
    Differences in abiotic conditions give rise to stratification. These differences include the amount of light present, the strength of the wind and the humidity.  These different conditions support different communities of organisms.
  • 7.
    Just are varying abiotic factors in a rainforest lead to stratification, the changing water level associated with tides creates intertidal zonation.
  • 9.
    It is important to measure factors within environments to better understand how they function. This knowledge is vital to conservation and restoration of the natural environment.  Qualitative data refers to descriptions not involving numbers. E.g. the environment on the side of the cliff is rocky and very exposed to the elements.  Quantitative data involves measurements e.g. the average temperature during the day was 32 degrees.
  • 10.
     Geographic rangerefers to the area over which can organism is found.  Geographic distribution refers to the spread of an organism within an ecosystem.  Abundance refers to the number of organisms Geographic Range of the present in an ecosystem Platypus.
  • 11.
    What limits range and distribution? The resources available in an environment and the ability of the organism to obtain these resources (dependent on adaptations) limit the organisms range and distribution. Generally the greater the tolerance range of an organism the greater its range and distribution. Biotic factors can be responsible for limiting distribution within an ecosystem. Such factors include food sources and predators.
  • 13.
     It isimportant to know not only which species of organisms are present in an ecosystem and the relationships that exist between then but also where exactly these species are located within the ecosystem and how many of them are alive.  Species are rarely spread evenly through an ecosystem rather they occur in patterns of distribution. Some common patterns are:
  • 14.
    Random distribution- organisms are irregularly spaced and the location of one species does not appear to affect the location of another; more common in plant populations.
  • 15.
    Uniform or continuous distribution- organisms are evenly spaced the presence of one organism determines how close or distant another organism will be; common in animal populations that are territorial.
  • 16.
    Clumped or grouped distribution- a number of individuals are grouped together and the groups make up the population as a whole; this may be to do with social behaviours such as schools of fish
  • 17.
     It isnot always possible to directly measure a population. How can you count all of the birds within an ecosystem or all of the blades of grass?  Instead ecologists use sampling techniques to provide estimates of populations.  Such techniques include transects, quadrats, and capture-mark-recapture.
  • 18.
    For organisms thatdo not move a quadrat can be a good method of estimating distribution and abundance. Quadrats can also be used to measure density. The position of quadrats within an ecosystem is selected at random. The number of particular species within the quadrat are counted and recorded. The total of all of the quadrats are averaged.
  • 19.
    A line transect can be used to measure the distribution of species in an ecosystem. They are especially helpful where we see environmental gradients- gradual changes in an ecosystem.  We can also use vertical transect to investigate stratification in forests for example where different amounts of light, humidity and wind levels impact different species.
  • 20.
     Capture-mark-recapture isa method used to estimate the population of mobile species.  Step 1 is to capture organisms randomly in a way that they are not harmed.  Step 2 is to mark these organisms ensuring that the marking does not attract predators or cause harm. Tagging is a common form of marking animals. Insects are usually marked with a dot of ink. The animals are then returned to the environment.
  • 21.
    Step 3 occurs some time after release. Organisms are captured again and the number of marked organisms is counted. From this information the population is estimated using the formula below:
  • 22.
    Dr. T., an ecologist, wanted to find out how many frogs live in a small pond.  On the first trip to the pond, 55 frogs were caught, banded, and released.  The second trip to the pond, 72 frogs were caught, of those 72 frogs, 12 were banded. Assuming the banded frogs had thoroughly mixed with the unbanded frogs, how many frogs live in the pond?
  • 23.
    Remember: Information 55 frogs werecaught, banded The second trip to the pond, 72 frogs were = 330frogs caught, 12 were banded
  • 24.
    Density refers to the number of individuals in a given area. Knowing the density of a population can help assess whether or not an ecosystem is able to provide sufficient resources to support populations. This is known as the carrying capacity of the ecosystem.