Download to read offline
![Sukhdeep Kaur et al Int. Journal of Engineering Research and Applications
ISSN : 2248-9622, Vol. 3, Issue 6, Nov-Dec 2013, pp.749-754
RESEARCH ARTICLE
www.ijera.com
OPEN ACCESS
Enhancement of Speech Recognition Algorithm Using DCT and
Inverse Wave Transformation
Sukhdeep Kaur, Er. Gurwinder Kaur
Research Student, Assistant Professor
(Electronics and Communication Engineering Department Yadavindra College of Engineering (YCoE)
Talwandi Sabo, District Bathinda, Punjab, India.)
Electronics and Communication Engineering Department Yadavindra College of Engineering (YCoE),
Talwandi Sabo, District Bathinda, Punjab, India.)
ABSTRACT
This research work focus on providing better performance in speech recognition algorithm by integrating digital
signal transposition with speech recognition techniques. This is an approach for improving the performance of
speech recognition algorithm using butterworth stopband filter and discrete cosine transformation based speech
compression with inverse wave transformation. The main objective is to integrate filtering with speech
recognition algorithm to improve the results when noise is present in the signal. In this work, the matching is
done using inverse wave transformations which reduce the time for recognition of voices. Proposed algorithm is
designed and implemented in MATLAB. The proposed algorithm has been tested on the given samples and
evaluated using different recognizable and unrecognizable samples obtaining a recognition ratio about 98%. It is
shown that the proposed algorithm provides better results than existing techniques. Proposed algorithm increase
the accuracy of the speech recognition system.
Keywords: filter, inverse wave transformation, speech recognition, wave format.
I.
Introduction
The speech recognition is defined as the
process of considering the spoken word as an input
speech and matches it with the previously recorded
speeches on basis of various parameters. This can be
done by various methods. It is a process of
automatically recognizing who is speaking on the
basis of features of speaker of the speech signal.
Speech recognition features has some of the
advantages like speech input is easy to do because it
does not demand a specialized skill as does typing or
push button procedures. Information can be input
even when the user is not constant or doing other
activities including the hands, eyes, legs or ears.
Since a telephone or microphone can be used as an
input terminal [1].
Basically, speaker recognition is classified
in to speaker identification and speaker verification.
Wide application of speech recognition system
includes control access to services such as database
access services banking by telephone, voice dialing
telephone shopping. Now speech recognition
technology is the most desirable technology to create
new services.
II.
Classification of Speech Recognition
Systems
Most speech recognition systems can be
classified according to the following categories [2]:
www.ijera.com
Speaker
Dependent
versus
Speaker
Independent
A speaker‐dependent speech recognition
system is one that is trained to recognize the speech
of only one speaker. A speaker‐independent system
is one that is independence is difficult to attain, as
speech recognition organizations tend to become
adjusted to the speakers they are trained on, resulting
in error rates are higher than speaker dependent
system.
Isolated versus Continuous
In isolated speech the speaker pauses
shortly between every word, while in continuous
speech the speaker speaks in a continuous and
possibly long stream with little or no breaks in
between. Isolated speech recognition systems are
easy to build. Words spoken in continuous speech on
the other hand are subjected to the co-articulation
effect, in which the pronunciation of a word is
modified by the words surrounding it.
Keyword based versus Subword unit based
A speech recognition system can be trained
to recognize whole words, like dog or cat. This is
useful in applications like voice‐command‐systems,
in which the system need only recognize a small set
of words. This approach is simple but not scalable.
As the dictionary of recognized words grow, so too
the complexity and execution time of the recognizer.
749 | P a g e](https://image.slidesharecdn.com/dy36749754-131122003154-phpapp02/85/Dy36749754-1-320.jpg)
![Sukhdeep Kaur et al Int. Journal of Engineering Research and Applications
ISSN : 2248-9622, Vol. 3, Issue 6, Nov-Dec 2013, pp.749-754
III.
www.ijera.com
Approaches to Speech Recognition
Basically there exist three approaches to
speech recognition. They are [11]:
Acoustic Phonetic Approach
Acoustic-phonetic approach assumes that
the phonetic units are broadly characterized by a set
of
features
such
as
format
frequency,
voiced/unvoiced and pitch. These features are
extracted from the speech signal and are used to
segment and level the speech.
Pattern Recognition Approach
Pattern recognition approach requires no
explicit knowledge of speech. This approach has two
steps – namely, training of speech patterns based on
some generic spectral parameter set and recognition
of patterns via pattern comparison. The popular
pattern recognition techniques include template
matching, Hidden Markov Model
Artificial Intelligence Approach
Knowledge based approach attempts to
mechanize the recognition procedure according to
the way a person applies its intelligence in
visualizing, analyzing and finally making a decision
on the measured acoustic features. Expert system is
used widely in this approach.
IV.
Problem Definition
In problem definition define different
problems in existing approaches and how these
problems will be eliminated or reduced using
improved audio recognition algorithm.
The methods developed so far fail or not give
efficient results when there exist noise in the
audio signal.
Noises add too much disturbance on the given
signal and which decreases the audio
recognition algorithm accuracy rate.
Noise leaves bad effects on the bandwidth of a
given network so it becomes major issue in
audio signals.
Exiting networks such as neural networks take
much time in training period
V.
Proposed Work
In the proposed method, the goal is to detect
the speaker from the previously recorded wave
samples. The main concentration is on accuracy and
speed. The proposed method is implemented using
MatLab.
www.ijera.com
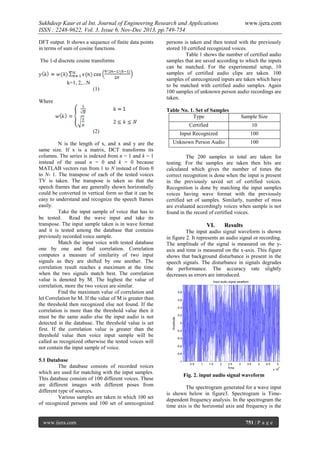
Fig.1. flow-chart for speech recognition algorithm
In the proposed algorithm samples of
dummy speeches are taken for experiments and a
database is prepared in which these speeches are
saved. The speech samples are taken in the wave
format. The input samples are taken from various
persons by recording their voices. These are the
tested voices TVi for the given system. In the testing
phase test voice is match with the stored input voice
and recognition decisions are made.
Butterworth filter is used to remove the
noise from the system. Speech signals degrade due to
the presence of background noise and noise
reduction is an important field of speech processing.
Butterworth stopband filter is used to minimize the
disturbance from the speech signals.
Discrete cosine transforms (DCT) based
speech compression is used to reduce the size of the
speech information. It is used to speed up the system
by remove the redundancy from audio information.
Compression is the process of elimination of
redundancy and duplicity. The DCT is very common
when encoding video and speech tracks on
computers. The DCT is very similar to the DFT but
the output values of DCT are real numbers and the
output vector is approximately twice as long as the
750 | P a g e](https://image.slidesharecdn.com/dy36749754-131122003154-phpapp02/85/Dy36749754-2-320.jpg)
![Sukhdeep Kaur et al Int. Journal of Engineering Research and Applications
ISSN : 2248-9622, Vol. 3, Issue 6, Nov-Dec 2013, pp.749-754
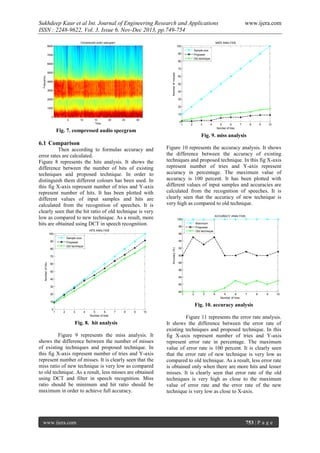
ERROR RATE ANALYSIS
100
Maximum
Proposed
Old technique
90
80
[2]
Error rate(%)
70
60
50
[3]
40
30
20
10
0
1
2
3
4
5
6
Number of tries
7
8
9
10
[4]
Fig. 11. error rate analysis
VII.
CONCLUSION AND FUTURE
WORK
7.1 Conclusion
The technique is able to authenticate the
particular speaker based on the individual
information that is included in the audio signal. The
performance of the new technique is better than the
existing techniques. Most of existing techniques does
recognition of speech through the text wrapping.
These techniques take too much time in recognizing
the speech and are not accurate in the noisy
environment. So the DCT and Butterworth stopband
filter is used with inverse wave transformation to
obtain the more accuracy and speed up the system.
The DCT packs energy in the low frequency regions.
The waveforms and specgrams showed that new
technique provides high accuracy rate and consumes
very less time in recognition. The error rate of the
proposed algorithm is very low as compared to old
algorithm.
7.2 Future Scope
In the future, the focus can be on reducing
the noise or background disturbance that is
introduced in the speech samples automatically
while recording. Modified discrete cosine transform
(MDCT) will be future compression algorithm,
whether standalone or combination of speech and
still or moving images. The various filtering
techniques can be applied in order to reduce
disturbance. By using these various filter techniques
speech recognition will be more accurate and fast.
The results can be further generalized if we are able
to unite voice activation detection with this
procedure we can perform speech recognition on live
voices and speech. More research has to be done on
this particular area to obtain more security.
References
[1]
Susanta Kumar Sarangi, and Goutam Saha,
“A Novel Approach in Feature Level for
Robust
Text-Independent
Speaker
Identification
systemhigher”,
IEEE
Proceedings
of
4th
International
www.ijera.com
[5]
[6]
[7]
[8]
[9]
[10]
[11]
www.ijera.com
Conference on Intelligent Human Computer
Interaction, December 27-29, 2012
Santosh K.Gaikwad, Bharti W. Gawali, and
Pravin Yannawar, “A Review on Speech
Recognition Technique”, International
Journal of Computer Applications (0975 –
8887), Vol.10– No.3, November 2010.
K. Ramamohan Rao and P. Yip, “Discrete
Cosine
Transform:
Algorithms,
Advantages, Applications”, Academic
Press Professional, Inc san Diego, CA,
USA, 1990.
Swapnil D. Daphal, and Sonal K. Jagtap,
“DSP Based Improved Speech Recognition
System”, International Conference on
Communication,
Information
and
Computing Technology, IEEE 2012.
C. Y. Fook, “Malay Speech Recognition
and Audio Visual Speech Recognition”,
International Conference on Biomedical
Engineering (ICoBE), pp. 479-484, Feb.
2012.
D. Addou, S.A. Selouani, M. Boudraa, and
B. Boudraa “Transform-based multi-feature
optimization for robust distributed speech
recognition”, IEEE GCC conference and
exhibition, februaury, 2011.
M.D. Pawar, and S.M. Badave,”Speaker
Identification System Using Wavelet
Transformation and Neural Network”,
International
Journal
of
Computer
Applications in Engineering Sciences, Vol.
1, special issue on CNS, July 2011.
Yu Shao, “Bayesian Separation with
Sparsity Promotion in Perceptual Wavelet
Domain for Speech Enhancement and
Hybrid Speech Recognition”, IEEE
Transactions on Systems, Vol. 41, pp. 284294, March 2011.
Ozlem Kalinli, Michael L. Seltzer, Jasha
Droppo, and Alex Acero,” Noise Adaptive
Training for Robust Automatic Speech
Recognition”, IEEE Transactions On
Audio, Speech and Language Processing,
Vol. 18, No. 8, November 2010.
Mohamad Adnan Al-Alaoui, Lina Al-Kanj,
Jimmy Azar1, and Elias Yaacoub, “Speech
Recognition using Artificial Neural
Networks and Hidden Markov Models”,
IMCL 2008 Conference, 16-18 April 2008.
Patricia Scanlon, Daniel P. W. Ellis, and
Richard B. Reilly, “Using Broad Phonetic
Group Experts for
Improved Speech
Recognition” IEEE Transactions on audio,
speech and language processing, Vol. 15,
pp. 803-812, March 2007.
754 | P a g e](https://image.slidesharecdn.com/dy36749754-131122003154-phpapp02/85/Dy36749754-6-320.jpg)

This research article presents an enhanced speech recognition algorithm that integrates digital signal processing techniques, specifically the Butterworth stopband filter and discrete cosine transformation, to improve recognition accuracy in the presence of noise. The implemented MATLAB-based algorithm achieves a recognition ratio of approximately 98%, outperforming existing methods. A thorough evaluation demonstrates significant improvements in accuracy, speed, and noise reduction effectiveness, making it a valuable advancement in speech recognition technology.


![[Tobias herbig, franz_gerl]_self-learning_speaker_(book_zz.org)](https://cdn.slidesharecdn.com/ss_thumbnails/tobiasherbigfranzgerlself-learningspeakerbookzz-150520140217-lva1-app6892-thumbnail.jpg?width=640&height=640&fit=bounds)


