


![47 | © 2016 RingCentral, Inc. All rights reserved.
USF – source wiki
The Universal Service Fund (USF) is a system of telecommunications
subsidies and fees managed by the United States Federal
Communications Commission (FCC) intended to promote universal
access to telecommunications services in the United States. The FCC
established the fund in 1997 in compliance with the Telecommunications
Act of 1996. The fund reported a total of $7.82 billion in disbursements
in 2014,[1] divided among its four programs. The fund is supported by
charging telecommunications companies a fee which is set quarterly. As
of the third quarter of 2016, the rate is 17.9% of a telecom
company's interstate and international end-user revenues.](https://image.slidesharecdn.com/ringcentralwebinarwithstreamsetsaug22017-170802203525/85/Driving-Better-Products-with-Customer-Intelligence-47-320.jpg)


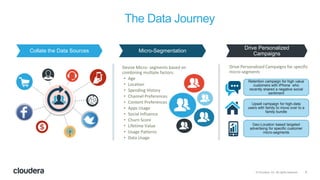
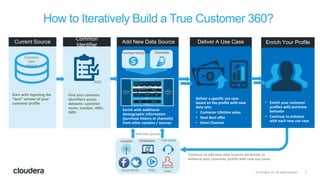
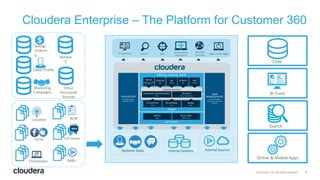
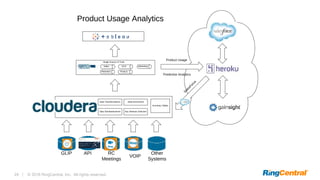
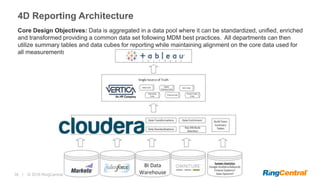
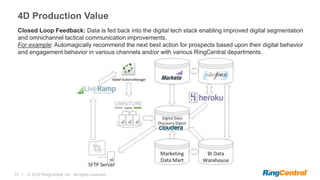
The document discusses the importance of leveraging customer intelligence and data integration to drive personalized marketing campaigns and improve product offerings. It emphasizes the necessity of building a holistic customer profile using diverse data sources to enhance engagement and retain customers. The Cloudera platform is noted as a solution for managing and analyzing large datasets to facilitate these efforts.