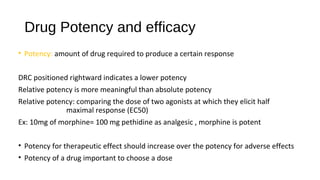
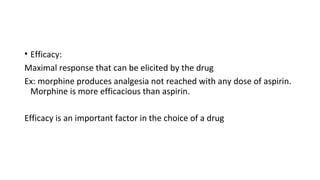
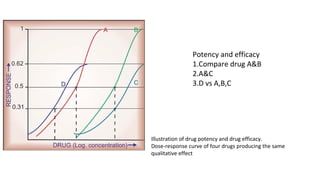
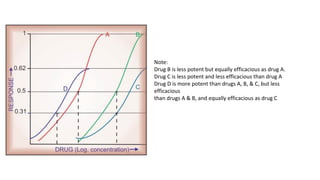
Downloaded 462 times

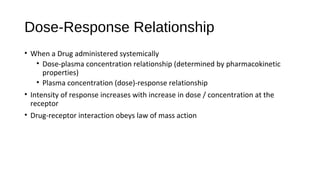
![Emax * [D]
E=
KD +[D]
E- observed effect
D- dose
Emax- maximal response
Kd- dissociation constant of the drug-receptor complex](https://image.slidesharecdn.com/dose-responserelationship-151216072142/85/Dose-response-relationship-4-320.jpg)
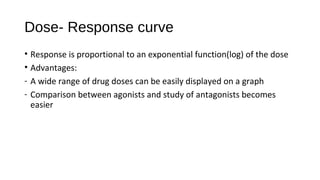
![Dose-Response Curve
E =
Emax X [D]
Kd + [D]
Dose-response and log dose-response
curves](https://image.slidesharecdn.com/dose-responserelationship-151216072142/85/Dose-response-relationship-5-320.jpg)

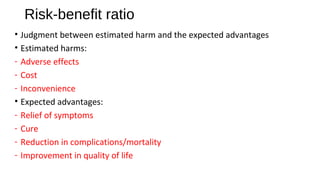
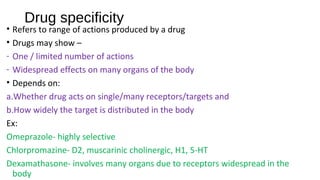
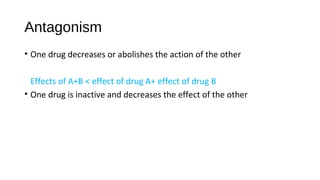
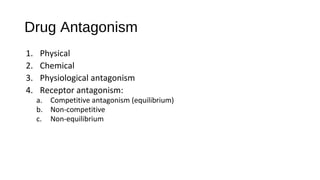
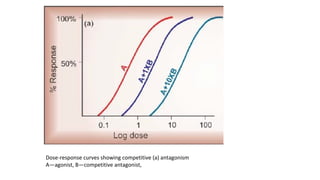
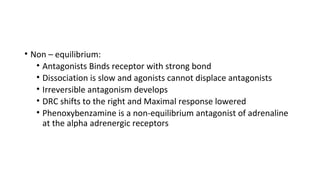


This document describes key concepts related to dose-response relationships and drug interactions. It defines dose-response relationships and curves, and explains how drug potency, efficacy, selectivity, and therapeutic index are determined based on these curves. It also discusses how drugs can have synergistic or antagonistic effects when combined, including competitive and non-competitive receptor antagonism. The overall intent is to explain important pharmacological concepts for understanding how drug effects are produced at varying doses both alone and when administered together with other drugs.


![PERI-PROSTHETIC FRACTURE NAIL-PLATE CONSTRUCT [NPC].pptx](https://cdn.slidesharecdn.com/ss_thumbnails/drarunkumardrmohamedashrafperiprostheticfrasturenail-plateconstructnpc-260209164459-7e9d15a1-thumbnail.jpg?width=640&height=640&fit=bounds)