
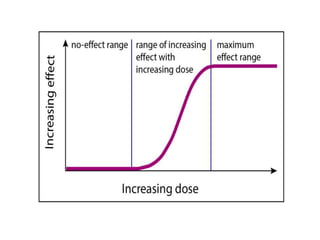
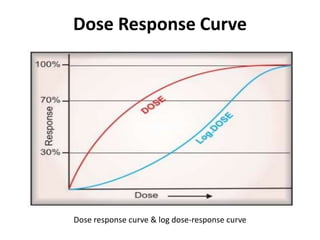
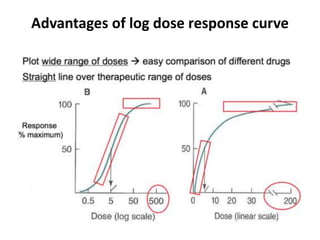
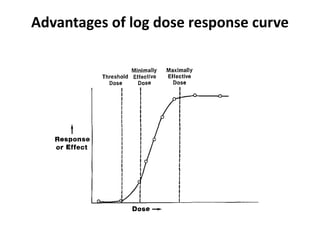
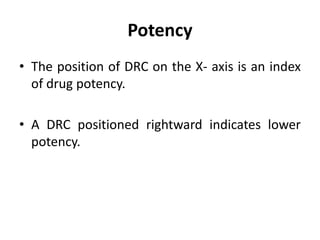
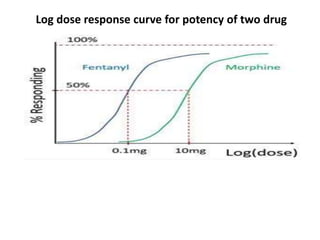
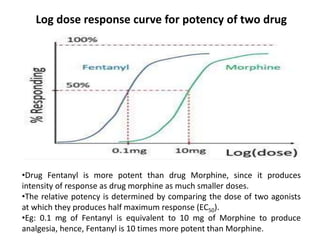
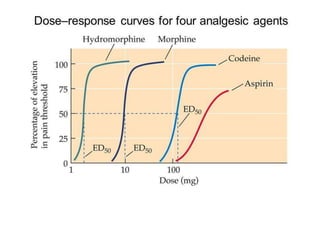
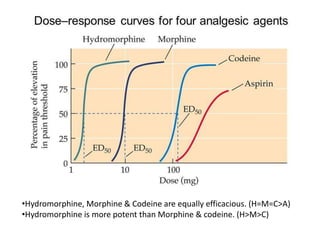
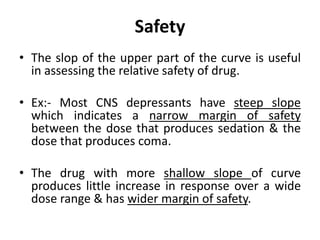
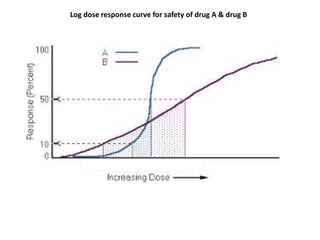
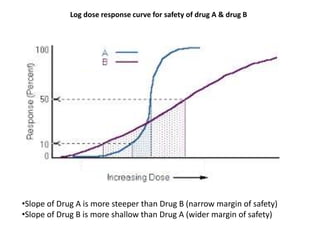
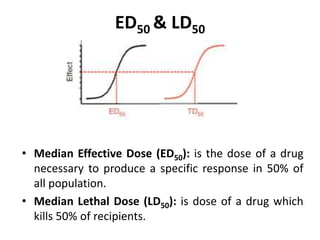
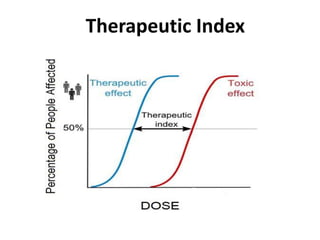
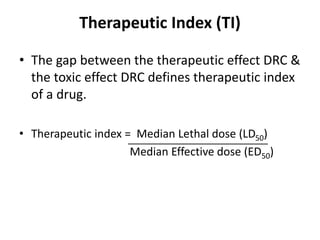
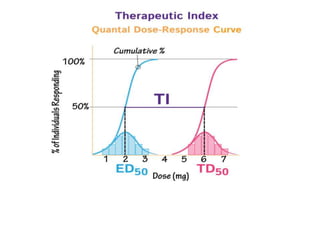
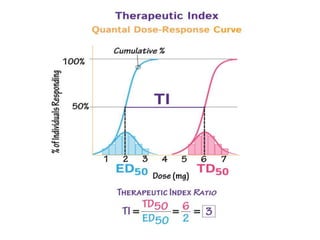
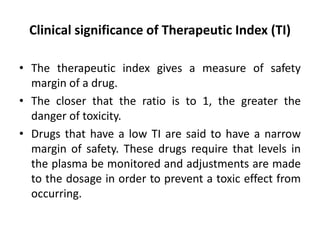
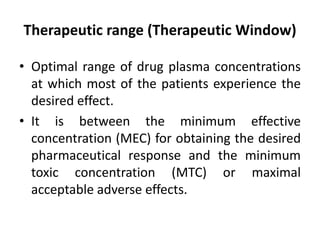
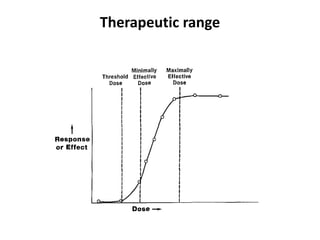

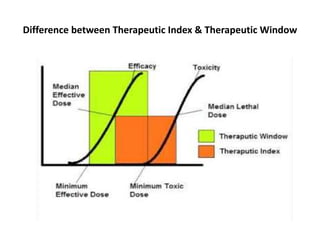
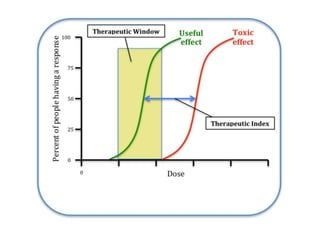


The document discusses dose-response curves and their significance. It explains that dose-response curves show the relationship between the dose of a drug administered and the intensity of response produced. A log dose-response curve becomes sigmoid shaped and allows comparison of drug potency. The position, slope and maximum effect of the curve provide information about a drug's potency, efficacy, safety, therapeutic index and window. Quantal and graded dose-response curves are used to assess different types of drug responses.


