Identify in 150 - 200 words your reactions to the concepts of global.pdffathimafancyjeweller
Identify in 150 - 200 words your reactions to the concepts of globalization and Global Business
Ethics Issues.
Solution
Overview
The current financial crisis has raised questions about the legitimacy of capitalism. Ethical
failures certainly played a role. While it remains to be seen whether and how many people
blatantly broke the law, there are abundant signs of various forms of potentially unethical
behavior. These include greed, unreasonable amounts of leverage, subtle forms of corruption
(such as ratings agencies that appear to have had a conflict of interest), complex financial
instruments that no one really understood, and herd behavior where people just followed along
and failed to exercise independent judgment.
It is difficult or impossible to regulate against greed and against many of the other ethical
shortcomings that have been seen. What can be done is to force greater transparency and
accountability, a process which began with Sarbanes-Oxley and is expected to continue with new
regulations of the financial system.
Context
Drawing upon learnings from their work and experiences, the panelists and moderator exchanged
views with the audience on the ethics and legitimacy of business and capitalism in general, and
the financial crisis in particular.
Key Takeaways
The financial crisis may shift societal views on the legitimacy of business.
Each panelist offered a different perspective on the issue of ethics and legitimacy in business:
– The financial crisis has the potential to damage the legitimacy of capitalism (Di Tella). Richer
nations tend to be more right-wing in their views and have more capitalistic economic systems.
The United States is exceptionally right-leaning, even among developed nations.
These attributes are heavily influenced by beliefs regarding the reasons why people are
prosperous or poor. Americans tend to see prosperity as a product of effort more than luck; left-
leaning nations believe the opposite.
Affecting these beliefs: the number and severity of the shocks a society has weathered; and
perceptions regarding the legitimacy of business—i.e., the perceived degree of corruption.
America generally perceives that corrupt businesspeople are the exception, and punishes deviants
severely. However, this financial crisis holds the potential to shift America leftward since it: 1) is
a major shock that 2) suggests systemic corruption. Both call into some question the legitimacy
of U.S. capitalism.
– It is ethically legitimate for businesses to place the customer\'s interests above all else, because
only through profit comes the freedom to contribute to society (Vasella). Business leaders must
use their personal moral compasses to make ethical decisions. As for the business\'s compass, it
should be oriented toward satisfying customers above all stakeholders. That is the orientation
that allows for the greatest competitive success and profitability. In Mr. Vasella\'s view, only by
making a profit does a company earn the rig.
Corporate reputation is an intangible asset amounting to up to 70% of an organisation’s market capitalisation. Recent evolutions in the business environment and social communications have made stakeholder engagement an essential part of the strategy of responsible and successful organisations in order to maintain this capital. But research shows that most engagement efforts in multinational or multi-services companies are kept in silos and uncoordinated across business units or departments.
This document describes some of the engagement guidelines provided by the AA1000 and GRI assurance standards and how following these guidelines with an appropriate collaborative, full circle platform can help:
* identify important stakeholders and groups ;
* map them and their opinions on the organisation’s strategic issues ;
* engage them appropriately and monitor impacts.
in a natural continuous improvement cycle to help respond to short term events in the context of a long term communication and corporate reputation management strategy.
It also describes engagement in the context of crisis management and social media to show how detecting earlier warning signals both enhances the organisation’s ability to contain the crisis and lowers the cost at which this is done.
Ask not why VW failed to measure upto, Ask why am I grappled with How To Meas...JAYARAMAN IYER
Correcting the fault lines apparent in Volkswagen needs fundamental change of corporate restructuring.
Ethics is subtler than the subtle that aligning Fiscal Responsibility to Ethical Responsibility is a challenge only a few companies are structured to undertake. Spreadsheet structure is an anomaly.
Let us watch how Volkswagen takes it?
Ferreting Out Tunneling An Application to Indian Business Gro.docxmydrynan
Ferreting Out Tunneling: An Application to Indian Business Groups
Author(s): Marianne Bertrand, Paras Mehta and Sendhil Mullainathan
Reviewed work(s):
Source: The Quarterly Journal of Economics, Vol. 117, No. 1 (Feb., 2002), pp. 121-148
Published by: Oxford University Press
Stable URL: http://www.jstor.org/stable/2696484 .
Accessed: 15/06/2012 23:48
Your use of the JSTOR archive indicates your acceptance of the Terms & Conditions of Use, available at .
http://www.jstor.org/page/info/about/policies/terms.jsp
JSTOR is a not-for-profit service that helps scholars, researchers, and students discover, use, and build upon a wide range of
content in a trusted digital archive. We use information technology and tools to increase productivity and facilitate new forms
of scholarship. For more information about JSTOR, please contact [email protected]
Oxford University Press is collaborating with JSTOR to digitize, preserve and extend access to The Quarterly
Journal of Economics.
http://www.jstor.org
http://www.jstor.org/action/showPublisher?publisherCode=oup
http://www.jstor.org/stable/2696484?origin=JSTOR-pdf
http://www.jstor.org/page/info/about/policies/terms.jsp
FERRETING OUT TUNNELING: AN APPLICATION TO
INDIAN BUSINESS GROUPS*
MARIANNE BERTRAND
PARAS MEHTA
SENDHIL MULLAINATHAN
Owners of business groups are often accused of expropriating minority share-
holders by tunneling resources from firms where they have low cash flow rights to
firms where they have high cash flow rights. In this paper we propose a general
methodology to measure the extent of tunneling activities. The methodology rests
on isolating and then testing the distinctive implications of the tunneling hypothe-
sis for the propagation of earnings shocks across firms within a group. When we
apply our methodology to data on Indian business groups, we find a significant
amount of tunneling, much of it occurring via nonoperating components of profit.
I. INTRODUCTION
Weak corporate law and lax enforcement mechanisms raise
fears of expropriation for minority shareholders around the
world. These fears seem especially warranted in the presence of
business groups, a common organizational form in many devel-
oped and developing countries. In a business group, a single
shareholder (or a family) completely controls several indepen-
dently traded firms and yet has significant cash flow rights in
only a few of them.' This discrepancy in cash flow rights between
the different firms he controls creates strong incentives to expro-
priate. The controlling shareholder will want to transfer, or tun-
nel, profits across firms, moving them from firms where he has
* We thank Abhijit Baneijee, Simon Johnson, Tarun Khanna, Jayendra
Nayak, Ajay Shah, Susan Thomas, two anonymous referees, the editor (Edward
Glaeser), and seminar participants at the MIT Development and Public Finance
Lunches, the Harvard/MIT Development Seminar, the NBER-NCAER Conference
on Reforms, the Harv ...
What: An effective policy for the development of SMEs needs to focus on identifying real constraints and determine how these could be realistically addressed. The most productive and reliable way of identifying such constraints and possible solutions is through public–private sector interaction and dialogue. UNCTAD undertook a survey of good practice and set up a project entitled “Enhancing public–private sector dialogue in LDCs”. This survey aims to distil key principles of effective dialogue that will serve as benchmarks for evaluating the practice of public–private sector dialogue and interaction. Who: Useful for anyone teaching on how to strengthen public–private sector interaction. How: Can be used as by teachers to assign students to conduct surveys using this model.
From forced labour on cannabis farms in the UK to the child workers in the cocoa industry of Côte d’Ivoire, an estimated 29.8 million people are enslaved today. The Global Slavery Index is your guide to modern slavery, country by country.
http://www.globalslaveryindex.org/
This is the first edition of the Global Slavery Index. It is the first Index of its kind – providing an estimate, country by country, of the number of people living in modern slavery today.
The Global Slavery Index 2013 measures the size of the modern slavery problem, country by country. The Index provides a quantitative ranking of 162 countries around the world according to the estimated prevalence of slavery, that is, the estimated percentage of enslaved people in the national population at a point in time. The Global Slavery Index also examines the risk factors and outlines the strength of the government responses in the fight against modern slavery.
A New Global Partnership: Eradicate Poverty and Transform Economies through S...Andy Dabydeen
The High Level Panel on the Post-2015 Development Agenda today released “A New Global Partnership: Eradicate Poverty and Transform Economies through Sustainable Development,” a report which sets out a universal agenda to eradicate extreme poverty from the face of the earth by 2030, and deliver on the promise of sustainable development. The report calls upon the world to rally around a new Global Partnership that offers hope and a role to every person in the world.
The Panel was established by United Nations Secretary-General Ban Ki-moon and co-chaired by Indonesian President Susilo Bambang Yudhoyono, Liberian President Ellen Johnson Sirleaf and United Kingdom Prime Minister David Cameron.
http://www.post2015hlp.org/the-report/
World Environment Day is an annual event that is aimed at being the biggest and most widely celebrated global day for positive environmental action. World Environment Day activities take place all year round and climax on 5 June every year, involving everyone from everywhere.
The World Environment Day celebration began in 1972 and has grown to become one of the main vehicles through which the United Nations stimulates worldwide awareness of the environment and encourages political attention and action.
Through World Environment Day, the United Nations Environment Programme is able to personalize environmental issues and enable everyone to realize not only their responsibility, but also their power to become agents for change in support of sustainable and equitable development.
World Environment Day is also a day for people from all walks of life to come together to ensure a cleaner, greener and brighter outlook for themselves and future generations.
Everyone counts in this initiative and World Environment Day relies on you to make it happen! We call for action — organize a neighborhood clean-up, stop using plastic bags and get your community to do the same, stop food waste, walk to work, start a recycling drive . . . the possibilities are endless.
The annual fuel cost estimates in the 2008–2012 electronic fuel economy guides are updated weekly to match EIA's current national average prices for gasoline and diesel fuel.
This study provides strong evidence that an enhanced national recycling
and composting strategy in the United States can significantly and sustainably
address critical national priorities including climate change, lasting
job creation, and improved health. Achieving a 75 percent diversion1
rate for municipal solid waste (MSW) and construction and demolition
debris (C&D) by 2030 will result in:
• A total of 2.3 million jobs: Almost twice as many jobs as the projected
2030 Base Case Scenario, and about 2.7 times as many jobs as exist in
2008. There would be a significant number of additional indirect jobs
associated with suppliers to this growing sector, and additional induced
jobs from the increased spending by the new workers.
• Lower greenhouse gas emissions: The reduction of almost 515 million
metric tons of carbon dioxide equivalent (eMTCO2) from diversion activities,
an additional 276 million eMTCO2 than the Base Case, equivalent
to shutting down about 72 coal power plants or taking 50 million
cars off the road.
• Less pollution overall: Significant reductions in a range of conventional
and toxic emissions that impact human and ecosystem health.
• Unquantified benefits of reducing ecological pressures associated with
use of non-renewable resources, conserving energy throughout the materials
economy, and generating economic resiliency through stable, local
employment.
1
Keeping Track of our Changing Environment: From Rio to Rio+20Andy Dabydeen
The report is produced as part of UNEP's "Global Environmental Outlook-5" (GEO -5) series, the UN's most authoritative assessment of the state, trends and outlook of the global environment. The full GEO-5 report will be launched next May, one month ahead of the Rio+20 Conference taking place in Brazil.
Understanding Land Investment Deals in AfricaAndy Dabydeen
Based on field research conducted between October 2010 and January 2011, this report provides new and important information on the social, political and economic implications of current land investments in Sierra Leone.
http://media.oaklandinstitute.org/understanding-land-investment-deals-africa-sierra-leone
Understanding Land Investment Deals in Africa: MaliAndy Dabydeen
This report identifies and examines cases of large-scale land acquisitions in Mali. The report provides background on the institutional and political context of the country, the current macroeconomic situation, the state of food and agriculture, and the current investment climate. Additionally, it documents detailed information regarding four land investment deals currently being carried out in Mali.
http://media.oaklandinstitute.org/understanding-land-investment-deals-africa-mali
Understanding Land Investment Deals in AfricaAndy Dabydeen
For decades, Ethiopia has been known to the outside world as a country of famine, food shortages, endemic hunger, and chronic dependency on foreign aid. Despite receiving billions of dollars in aid, Ethiopians remain among the poorest in the world. Our research shows that at least 3,619,509 ha of land have been transferred to investors, although the actual number may be higher.
http://media.oaklandinstitute.org/understanding-land-investment-deals-africa-ethiopia
With governments committing huge sums to tackle the world's most pressing problems, from the instability of financial markets to climate change and poverty, corruption remains an obstacle to achieving much needed progress. The 2010 Corruption Perceptions Index shows that nearly three quarters of the 178 countries in the index score below five, on a scale from 10 (highly clean) to 0 (highly corrupt). These results indicate a serious corruption problem.
India Orthopedic Devices Market: Unlocking Growth Secrets, Trends and Develop...Kumar Satyam
According to TechSci Research report, “India Orthopedic Devices Market -Industry Size, Share, Trends, Competition Forecast & Opportunities, 2030”, the India Orthopedic Devices Market stood at USD 1,280.54 Million in 2024 and is anticipated to grow with a CAGR of 7.84% in the forecast period, 2026-2030F. The India Orthopedic Devices Market is being driven by several factors. The most prominent ones include an increase in the elderly population, who are more prone to orthopedic conditions such as osteoporosis and arthritis. Moreover, the rise in sports injuries and road accidents are also contributing to the demand for orthopedic devices. Advances in technology and the introduction of innovative implants and prosthetics have further propelled the market growth. Additionally, government initiatives aimed at improving healthcare infrastructure and the increasing prevalence of lifestyle diseases have led to an upward trend in orthopedic surgeries, thereby fueling the market demand for these devices.
What is the TDS Return Filing Due Date for FY 2024-25.pdfseoforlegalpillers
It is crucial for the taxpayers to understand about the TDS Return Filing Due Date, so that they can fulfill your TDS obligations efficiently. Taxpayers can avoid penalties by sticking to the deadlines and by accurate filing of TDS. Timely filing of TDS will make sure about the availability of tax credits. You can also seek the professional guidance of experts like Legal Pillers for timely filing of the TDS Return.
Personal Brand Statement:
As an Army veteran dedicated to lifelong learning, I bring a disciplined, strategic mindset to my pursuits. I am constantly expanding my knowledge to innovate and lead effectively. My journey is driven by a commitment to excellence, and to make a meaningful impact in the world.
Putting the SPARK into Virtual Training.pptxCynthia Clay
This 60-minute webinar, sponsored by Adobe, was delivered for the Training Mag Network. It explored the five elements of SPARK: Storytelling, Purpose, Action, Relationships, and Kudos. Knowing how to tell a well-structured story is key to building long-term memory. Stating a clear purpose that doesn't take away from the discovery learning process is critical. Ensuring that people move from theory to practical application is imperative. Creating strong social learning is the key to commitment and engagement. Validating and affirming participants' comments is the way to create a positive learning environment.
"𝑩𝑬𝑮𝑼𝑵 𝑾𝑰𝑻𝑯 𝑻𝑱 𝑰𝑺 𝑯𝑨𝑳𝑭 𝑫𝑶𝑵𝑬"
𝐓𝐉 𝐂𝐨𝐦𝐬 (𝐓𝐉 𝐂𝐨𝐦𝐦𝐮𝐧𝐢𝐜𝐚𝐭𝐢𝐨𝐧𝐬) is a professional event agency that includes experts in the event-organizing market in Vietnam, Korea, and ASEAN countries. We provide unlimited types of events from Music concerts, Fan meetings, and Culture festivals to Corporate events, Internal company events, Golf tournaments, MICE events, and Exhibitions.
𝐓𝐉 𝐂𝐨𝐦𝐬 provides unlimited package services including such as Event organizing, Event planning, Event production, Manpower, PR marketing, Design 2D/3D, VIP protocols, Interpreter agency, etc.
Sports events - Golf competitions/billiards competitions/company sports events: dynamic and challenging
⭐ 𝐅𝐞𝐚𝐭𝐮𝐫𝐞𝐝 𝐩𝐫𝐨𝐣𝐞𝐜𝐭𝐬:
➢ 2024 BAEKHYUN [Lonsdaleite] IN HO CHI MINH
➢ SUPER JUNIOR-L.S.S. THE SHOW : Th3ee Guys in HO CHI MINH
➢FreenBecky 1st Fan Meeting in Vietnam
➢CHILDREN ART EXHIBITION 2024: BEYOND BARRIERS
➢ WOW K-Music Festival 2023
➢ Winner [CROSS] Tour in HCM
➢ Super Show 9 in HCM with Super Junior
➢ HCMC - Gyeongsangbuk-do Culture and Tourism Festival
➢ Korean Vietnam Partnership - Fair with LG
➢ Korean President visits Samsung Electronics R&D Center
➢ Vietnam Food Expo with Lotte Wellfood
"𝐄𝐯𝐞𝐫𝐲 𝐞𝐯𝐞𝐧𝐭 𝐢𝐬 𝐚 𝐬𝐭𝐨𝐫𝐲, 𝐚 𝐬𝐩𝐞𝐜𝐢𝐚𝐥 𝐣𝐨𝐮𝐫𝐧𝐞𝐲. 𝐖𝐞 𝐚𝐥𝐰𝐚𝐲𝐬 𝐛𝐞𝐥𝐢𝐞𝐯𝐞 𝐭𝐡𝐚𝐭 𝐬𝐡𝐨𝐫𝐭𝐥𝐲 𝐲𝐨𝐮 𝐰𝐢𝐥𝐥 𝐛𝐞 𝐚 𝐩𝐚𝐫𝐭 𝐨𝐟 𝐨𝐮𝐫 𝐬𝐭𝐨𝐫𝐢𝐞𝐬."
3.0 Project 2_ Developing My Brand Identity Kit.pptxtanyjahb
A personal brand exploration presentation summarizes an individual's unique qualities and goals, covering strengths, values, passions, and target audience. It helps individuals understand what makes them stand out, their desired image, and how they aim to achieve it.
Attending a job Interview for B1 and B2 Englsih learnersErika906060
It is a sample of an interview for a business english class for pre-intermediate and intermediate english students with emphasis on the speking ability.
[Note: This is a partial preview. To download this presentation, visit:
https://www.oeconsulting.com.sg/training-presentations]
Sustainability has become an increasingly critical topic as the world recognizes the need to protect our planet and its resources for future generations. Sustainability means meeting our current needs without compromising the ability of future generations to meet theirs. It involves long-term planning and consideration of the consequences of our actions. The goal is to create strategies that ensure the long-term viability of People, Planet, and Profit.
Leading companies such as Nike, Toyota, and Siemens are prioritizing sustainable innovation in their business models, setting an example for others to follow. In this Sustainability training presentation, you will learn key concepts, principles, and practices of sustainability applicable across industries. This training aims to create awareness and educate employees, senior executives, consultants, and other key stakeholders, including investors, policymakers, and supply chain partners, on the importance and implementation of sustainability.
LEARNING OBJECTIVES
1. Develop a comprehensive understanding of the fundamental principles and concepts that form the foundation of sustainability within corporate environments.
2. Explore the sustainability implementation model, focusing on effective measures and reporting strategies to track and communicate sustainability efforts.
3. Identify and define best practices and critical success factors essential for achieving sustainability goals within organizations.
CONTENTS
1. Introduction and Key Concepts of Sustainability
2. Principles and Practices of Sustainability
3. Measures and Reporting in Sustainability
4. Sustainability Implementation & Best Practices
To download the complete presentation, visit: https://www.oeconsulting.com.sg/training-presentations
Buy Verified PayPal Account | Buy Google 5 Star Reviewsusawebmarket
Buy Verified PayPal Account
Looking to buy verified PayPal accounts? Discover 7 expert tips for safely purchasing a verified PayPal account in 2024. Ensure security and reliability for your transactions.
PayPal Services Features-
🟢 Email Access
🟢 Bank Added
🟢 Card Verified
🟢 Full SSN Provided
🟢 Phone Number Access
🟢 Driving License Copy
🟢 Fasted Delivery
Client Satisfaction is Our First priority. Our services is very appropriate to buy. We assume that the first-rate way to purchase our offerings is to order on the website. If you have any worry in our cooperation usually You can order us on Skype or Telegram.
24/7 Hours Reply/Please Contact
usawebmarketEmail: support@usawebmarket.com
Skype: usawebmarket
Telegram: @usawebmarket
WhatsApp: +1(218) 203-5951
USA WEB MARKET is the Best Verified PayPal, Payoneer, Cash App, Skrill, Neteller, Stripe Account and SEO, SMM Service provider.100%Satisfection granted.100% replacement Granted.
Buy Verified PayPal Account | Buy Google 5 Star Reviews
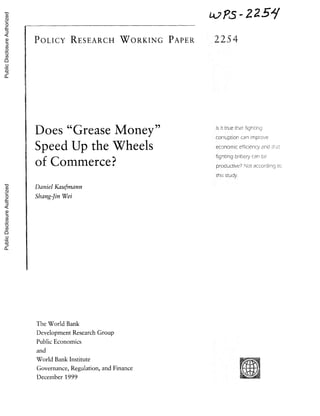
Does"grease money"speed up the wheels of commerce?
1. 7Ps 225'/
-
Public Disclosure Authorized
POLICY RESEARCH WORKING PAPER 2254
Public Disclosure Authorized
Does "EGrease oney"
M Is it true that fightiny
corruption can improve
Speed Up the Wheels economic efficiency nc z: .-
ofCommerce? >fighting bnbery canke
of Commerce? Hproductive? Not accordion to
this study.
Public Disclosure Authorized
Daniel Kaufmann
Shang-Jin Wei
Public Disclosure Authorized
The World Bank
Development Research Group
Public Economics
and
World Bank Institute
Governance, Regulation, and Finance
December 1999
2. PoIcy -,'ORKING PAPER22_54
RWSZARC
Summary findings
If bureaucratic burdeni and delay are Lxog.eno.s,LifiU-rl UsiYgdaa fronm three worlcdwAide firm-level surveys,
may find bribes a helpful wayv to cut thiphlo i aDC. Ka.iinanr aind e examine -he reiationsh-p berween
Accorditng the "efficient grease" hvooris,
to bribe pavIyInts, miianagemernt nimewasted wvith
c -rutmioncan irnprove economic ef.ncicn.cv anid fgihtig bure licrats, anrdcost of capital. They find that firms that
bribery can be counterproductive, pay ;ore bribes are also likely to spend more, not less,
D-i
This need not be the case. managem.l t ti-mewith bureaucrats, negotiating
*r a general equilibrium in which reguiatory uirden regulations. They also face a higher, rot lowver, cost of
and delay can be endogenously chosen by ren-seeking capital.
bureaucrats, the effective (not just nominalj red tape and
brilb may be positively correlated across fills.
emry
This paper -a joint product of Public Economics, Development Research Group, and Governance, Regulation, and
Finance, World Bank Institute - is part of a larger effort in the Bank to understand the effects of corruption on economic
development. Copies of the paper are available free from the World Bank, 1818 H Street NW, Washington, DC 20433.
Please contact Hedy Sladovich, room MCC2-609, telephone 202-473-7698, fax 202-522-1154, email address
hsladovich(c;worldbank.org. Policy Research Working Papers are also posted on the Web at -w-ww.worldbank.org/research/
wvorkingpapers.The authors may be contacted at dkauf.-mannECfavorldbank.orgsweidfaworldbank.org. December 1999.
or
(17 pages)
hI
Tke Policy Researcli WYhkmsig Peper Secie' dissemIaes thc h oi-k in pro gyre5ss to encourage the exchange of ideas about
des elop,;ent issues.Aloi otiectiOe oftl-e sevies :s gh
t /udieei ou t kee it the piesentations are less thauz flly polished. The
pa,pers caray tbe ;sa,oesofthe aothous and Shoulad be cited accol'igly. ps5dings, Miterpyeeations, and cod
m Oclusions expressed in this
paper are entireiy those of the autheos. T'kyv do not neecessarily repieset the views ofuthe World Bank, its Executive Directors, or the
cotioties they represent.
Produced bv the Policx Research iDssemiination
Center
3. Does "GreaseMoney"SpeedUp the Wheels of Commerce?
Daniel Kaufmann
dkaufmann@worldbank.org
Shang-Jin Wei
swei@worldbank.org
S.J. Wei thanksthe InternationalMonetaryFund's Fiscal AffairsDepartmentthrough DirectorVito Tanzi
and his many colleaguesfor a supportiveenvironmentwherepart of the paper was completed;Kaufmann
thanksthe HarvardInstitutefor InternationalDevelopment initialresearchand data support. We thank
for
RafaelDi Tella, Jim Hines, Irene Hors, Dani Rodrik,SusanRose-Ackerman, Vito Tanzi,Ray Vernon and
seminarparticipantsat HarvardUniversity,Universityof North Carolina, IMF and OECD Development
Center for helpful discussions,and Pablo Zoido-Lobaton Greg Dorchakfor efficient research and
and
editorial assistance. We thank particularly Mark Shankermanand Jakob Svesson for very useful
suggestions improvethe model.
to
4.
5. 1. Introduction
United States' Foreign Corrupt Practice Act (FCPA) of 1977 has made it a crime for
American finns to bribe foreign governmentofficials. In December 1997, the OECD
member countriessigned a conventionthat also criminalizesbribery of foreign officials
1
by firms from the member countries. It went into effect in February, 1999, after it had
been ratifiedby a sufficientnumberof individualparliamentsof the signatoiycountries..
Would laws of this kind reducethe incidenceof bribery by multinationalfirms? Do they
promoteeconomicefficiency?
Over thirty years ago, rather elegantly,the respectedpolitical scientist Samuel P.
Huntington stated that "...in tenns of economic growth, the only thing worse than a
society with a rigid, over-centralized,dishonestbureaucracyis one with a rigid, over-
centralizedand honest bureaucracy."(1968, p. 386) To paraphrase, excessivetaxes and
regulationon the books (nominalred tape) would remain excessivewithoutbribery; but
with the possibility of bribery, they may be transformedto less "real" red tape (i.e.,
officials not enforcing all the rules and regulationsin exchange for bribes). In other
words,bribery is tantamountto deregulation.
That view has not been an exception,and political scientistshave not been alone
over the past three decades in pointing out that, ethical considerationsaside, corruption
may in fact improve efficiency,particularlyin developingcountries. Indeed, theories
that see some economic efficiencyvirtues in corruptionhave been published by some
well-respectedscholars in academicjournals. NathanielH. Leff (i964, p. 11) stated in
unequivocal terms, "...if the governmenthas erred in its decision, the course made
possible by corruption may well be the better one." A rigorous economic model
published in the Journal of Political Economy(Lui, 1985) demonstratedthe efficiency-
enhancing role of corruption: in a queuing model, th.e size of bribes by different
economic agents could reflect their different opportunitycost. Better firms are more
able/willingto buy lower effectivered tape. Hence, like an auction, a license or contract
awardedon the basis of bribe size could achievePareto-optimal allocation.
We label the theory that bribery leads to lower effective red tape as the "efficient
grease" hypothesis. If bribes "grease the wheels of commerce," then campaigns by
governmentsor intemationalorganizationsto combat corruptionin internationalarena,
such as the U.S. FCPA or the OECD anti-bribery convention, would be counter-
productive. We arguethat this "efficientgrease"theoryrests on a crucial assumptionthat
should not be taken for granted. The assumptionis that the red tape/regulatoryburden
(tax, licenses,delay, and so on) can be taken as exogenous,independentof the incentive
for officialsto take bribes. Becauseof the assumption,the theory is partial equilibriumin
nature,and may not hold in a general equilibrium.
This point is not new. In sharp contrastto the views of Huntington,Leff and others
at the time, Myrdal in his epic AsianDrama (1968)suggestedalready a possibleperverse
relationship between bureaucratic regulations and bribery. More recently Baneirjee
I The OECD Conventionon CombatingBribery of Foreign Public Officials in IntemationalBusiness
Transactions.
1
6. (1997) has formalized certain aspects of that relationship, while Bardhan (1997) in his
excellent survey paper on corruption, states:
"In the second-best case made above, it is usually presumed that a given set
of distortions are mitigated or circumvented by the effects of corruption; but
quite often these distortions and corruption are caused or at least preserved or
aggravated by the same factors. The distortions are not exogenous to the
system and are instead often part of the built-in corrupt practices of a patron-
client political system."
There is already a considerable literature on the consequences of corruption. On
theoretical ground, Krueger (1974), Susan Rose-Ackerman (1975, 1978), Shleifer and
Vishny (1993 and 1994), and Bliss and Di Tella (1997), among others, have modeled
problems of corruption. In particular, Shleifer and Vishny also make the point that a
country's regulatory burden may be endogenously exploited by corruption-prone officials
for the purpose of extracting bribes. We extend their argument one step further, arguing
that even within a country, because the bureaucrats have discretionary power with a given
regulation, corruption-prone officials can often "customize" the nature and amount of
harassment on firms to extract maximum bribes possible. In other words, they would
charge according to "ability to pay." In equilibrium, firms that pay more bribes could still
face higher, not lower, effective red tape.
On empirical ground, Mauro (1995), Hines (1995), Kaufmann(1997a), Tanzi
(1998) and Wei (1997a, 1997b) have shown the negative effects of corruption on
economic growth, business development, on driving firms to the unofficial economy, on
public expenditures, and on domestic and foreign investment.
There is also a substantial non-technical and illuminating work on the
consequences of corruption, such as in Klitgaard (1990). Also, Andvig (1991) and, more
recently, Bardhan (1997), Rose-Ackerman (1998), Ades and Di Tella (1997), Kaufman
(1997b), Eliott (1997), and Tanzi (1998) provide excellent surveys on analytical and
empirical issues related to the economics of corruption.
In this paper we first develop a simple model that builds on the insight that
bureaucratic harassment may be endogenous. In addition, the model also stresses the role
of firms' different commitment ability (not to tolerate certain levels of bribery request) as
a function of their characteristics. We then turn to some statistical evidence. The
empirical literature has generally employed selective country-level corruption perception
index and investigated its consequence on various measures of economic performances
for the overall economies. This paper uses data from three firm-level surveys, focusing
on the interaction at the micro-level between the firrmsand the public officials.
The organization of the paper is as follows. Section 2 presents a model which
challenges the "efficient grease" theory. Section 3 describes the data set. Sections 4-6
discuss various empirical results. Section 7 concludes the paper.
2
7. 2. A Simple Model
Our simple model is a Stackleberg game between a rent-seeking government
official and a representativefirm k. The official moves first to choose harassment or
bureaucraticdelay in order to maximizebribe intake,and the firms which is a price taker
movesnext to choosethe bribepaymentin orderto maximizethe after-bribeprofit.
We solve for the equilibriumlevels of bribe and red tape by backward induction.
Considerfirstthe problemfacedby the firm.
Firm:
Suppose bk is the amount of bribery firm k has to pay to a corruption-prone
government official, and Ttk is the profit the firm would have attained without any
harassment from government officials. Let hk be the (nominal) harassment that the
official imposeson the firm, which could be tax assessment,fire safety standardon the
book, or the publishednumberof days that a given licenseapplicationcan take. We make
the nominal harassment firm-specificto emphasizethat the official has discretion over
the actual implementationof a given regulation. In other words, red tape can be
customized(to some extent).
We make a distinctionbetween effectiveor "real" harassment-the red tape that
firm actually faces after paying a bribe, and the nominal harassment-the red tape
announcedby the bureaucrator "on the book" before the firmpays the bribe. Let rkbe the
"real" or effectiveharassment-the red tape the firm actuallyfaces after making a bribe
payment.
rk= hk -s(bk)
where s(.) is a function describing how bribe payment helps to reduce effective
harassment. We assume sb > 0 and sbb < 0. In other words, holding the nominal
harassment,h, constant, more bribery leads to lower effective red tape, but there is a
decreasing returns to paying bribes. Notice here that a narrow version of "efficient
grease" hypothesis-if nominal harassment is constant, then bribery and effective
harassmentare negativelycorrelated-holds by assumption.
To simplifythe story, we assume that the pre-briberyprofit, iTk,is predetermined.
The representativefirm's objective is to maximize its post-bribe and post-harassment
profit, whichis givenby
r1k,a = g(rk)Ilk -bk.
The first order conditionyields an implicit functionthat relates the optimalamount
of bribe firm k would pay (if without any constraint on the maximum bribe) and the
nominalrate of harassment,h:
3
8. 9(h k ' bk) Hk Sb(bd) = 1
This definesan optimalbribery schedule:
bk = B(hd
Totally differentiating first-ordercondition,we can see that the bribery schedule
the
is upward-sloping,
dbk grTsb >
dh k gr S 2 - gr
b sb
In other words, the higher is the nominal harassment, the more bribe the firm finds
optimalto give.
The above bribery schedule assumes that the firm has to tolerate any level of
harassment and give bribes accordingly.We now consider the more relevant case that
every firm has an exit option, and therefore a maximum amount of harassment it is
willing to tolerate. Suppose hk denote the maximum harassment that firm k would
tolerate (at which point it is indifferentbetween exiting or not). That is, it can commit
not to tolerateanythingabove hk becauseof the characteristics the firm,the industryit
of
is in, or the source country it is from. With this commitment,the firm will no longer
solve the above unconstrainedproblem. Consequently, actual bribe the firm will be
the
willing to pay is:
bk = min{B(h, ),B(hk)}
Bureaucrat:
For now, let us assume that the bureaucratsets the harassmentrate, hk, (e.g., tax,
license, regulation and delay) solely for the purpose of extracting bribe payment.
Assuming that the bureaucrat's utility is an increasing function of briber intake, she
would choose to imposejust enough harassmentto induce the firm to pay the maximum
amount of bribe it is willing to tolerate, namely, bk = B-' (hk). In equilibrium,the firm
would pay exactly b. This implies that nominalharassmentand bribery are positively
correlatedacross firms.
4
9. That is not the end of the story. We can examine the relationship between the
effective rate of harassment and the bribery in equilibrium,
dr< dh
-k db k sb(b7)
db db
_
= rbb > 0
Therefore, in this model, those firms that pay more bribes not only face higher
nominal rate of harassment in equilibrium, but also have to deal with higher effective rate
of harassment. This is in sharp contrast with the "efficient grease" hypothesis.
To sum up, if one allows regulation, tax, and bureaucratic red tape and their
discretionary enforcement to be endogenously chosen by rent-seeking officials, the
officials may charge according to the firms' "ability to pay" by raising the nominal
harassment sufficiently. In terms of empirical prediction, we may observe a positive,
rather than a negative, correlation between the "effective" red tape and bribe in
equilibrium across firms.
3. Data
In the empirical part of the paper, we examine the relationship between bribe
payment and some measures of effective bureaucratic harassment. There are many types
of harassment one can think of. Our primary focus will be a proxy for the (actual) time
senior managers of firms have to spend negotiating with bureaucrats on regulations, but
we will also look at proxies for effective regulatory burden and extent of regulatory
discretion, and the (reported effective) cost of capital as other measures of effective
harassment.
We will explore data from three different surveys: (1) Survey for the 1997 Global
Competitiveness Report (GCR97 for short), (2) that for the 1996 Global Competitiveness
Report (GCR96 for short), and (3) that for the 1997 World Development Report (WDR97
for short).
The two GCR survey were conducted in late 1995 and 1996, respectively, under the
auspices of the Geneva-based World Economic Forum (WEF) and the Harvard Institute
for International Development (HIID). The 1997 Report surveyed 2,827 firms in 58
countries, of which 2,381 firms respond both to the questions on corruption and on time
spent by firm managers with bureaucrats. The publicly released GCR report publishes
the country average of the survey responses to all the survey questions. For our study, we
largely use the unpublished individual firm level responses. Further, we also use the data
5
10. from the GCR 1996, where 1,537 firms (1,503 non-missing observations for the
questions of our interest) were surveyed in 48 countries. Both survey instruments differ
in terms of some of the questions covered, and we find that for our purposes there are
some relevant questions in each survey.
The WDR97 survey was conducted by the World Bank in 3,866 firms covering 73
countries in preparation of its Annual Report in 1997.
There are three main reasons for using these three surveys. First, these surveys
have differences in coverage in terms of countries surveyed and questions asked. For
example, the GCR97 survey covers ten more countries than GCR96, and contains 26
countries not in the WDR97 survey, whereas the WDR97 survey contains 41 countries
that are not covered by GCR97. Second, because some of the key variables such as
corruption are perception-based subjective measures, we would like to see if our basic
findings can be corroborated across different, independently conducted surveys. Finally,
the characteristics of respondents are different between the GCR surveys and the WDR
survey. The GCR surveys are distributed among member firms of the World Economic
Forum which tend to be large, sometimes multinational, firms. The WDR survey, on the
other hand, may have more medium- and even small-sized finns in the sample.
We now turn to an explanation of the key variables we attempt to measure.
Corruption. The GCR 1997 does not ask directly for the magnitudes of bribe
payment made by the respondents. All questions in that survey are on the variable ratings
by the respondent in a scale of 1 to 7. Specifically for corruption the survey asks the
respondents, in question 8.02, to rate the level of corruption, on a one-to-seven scale,
according to the extent of "irregular, additional payments connected with imports and
exports permits, business licenses, exchange controls, tax assessments, policy protection
or loan applications." To check the reliability of this indicator, we correlated the country
means of that variable in the GCR survey with the corruption rankings in Business
International and Transparency International. The pairwise correlations are 0.77 and
0.83, respectively, indicating a broad agreement on corruption ranking across countries
among different sources. This was similarly the case for the variable rating corruption in
the GCR1996.
For the empirical work, we make the assumption that individual firm's rating is
correlated with their individual experience in bribery payment. Hence, firmnsthat give a
worse rating on their reported perceived incidence of bribery in the survey do indeed find
themselves in a position to have to pay more bribes in their business operation. This
assumption will be maintained for much of the statistical work. We will discuss the
implication of relaxing it later in the paper.
In the WDR97 Private Sector Survey of 3,700 firms, Question 14 asks: "Is it
commnonfor firms in my line of business to have to pay some irregular, "additional"
payments to get things done?" The respondent is asked to rate corruption on a 1-6 scale
with 1 meaning "always" and 6 "never."
Time spent by managers with bureaucrats. The GCR 1997 survey asks the
respondents, in Question 2.06, on a one-to-seven scale, whether the "senior management
of your company" spends more or less than "30 percent of its time dealing with
6
11. government bureaucracy." An answer of "4" (in the scale of 1 to 7) is calibrated to mean
the management has spent roughly 30 percent of time. We use answer to this question to
measure the time the management of the firm has wasted in dealing with regulation,
negotiating tax relief, and so on. This question was not asked in GCR 1996.
In the WDR97 Private Sector survey, Question 21 asked, "what percentage of
senior management time is spent on negotiation with officials about changes and
interpretations of laws and regulations? (1) less than 5 percent, (2) 5-15 percent, (3) 15-
25 percent, (4) 25-50 percent, (5) 50-75 percent, and (6) more than 75 percent." In our
regressions, we re-code the answer (1) to 2 percent. From (2) to (5), we use the midpoint.
For (6), we use 80 percent.
Unpredictability. Unpredictability index is based on the answers to three questions
(15, 16 and 17) in the WDR97 Private Sector Survey. Question 15 asked respondents
how much they agree to the statement that, "fims in my line of business usually know in
advance about how much this 'additional payment' is." Question 16 was on the extent of
agreement with the statement that, "even if a firm has to make an 'additional payment' it
always has to fear that it will be asked for more, e.g., by other officials." And Question
17 asked the extent of agreement to the statement that, "if a firm pays the required
'additional payment' the service is usually also delivered as agreed." All three questions
were answered on a one to six scale.
Cost of capital. Only in GCR 1996 there was a question (4.09) which asked firms
to rate in a scale of I to 6 whether the cost of capital was too high/does not hinder
competitive business development. For purposes of comparability with the estimations of
the regressions using the GCR 1997 data we rescaled this variable to a scale ranging
between 1 to 7.
Regulation. We extract two aspects of government regulations from the GCR97
survey. The first one, which we label as "regulatory burden," is derived from Question
2.02, which asks the respondents to rate on a one-to-seven basis the degree to which
"'government regulations impose a heavy burden on business competitiveness."
The second one, which we label as "regulatory discretion," is derived from
Question 2.08, which asks the respondents to rate on a one-to-seven scale the degree to
which the "government regulations are vague and lax."
4. Evidence from the Firm Surveys for the Global Competitiveness Reports
Using the data from the two GCR surveys, we now examine the empirical
relationship between corruption payment and effective bureaucratic harassment. There
are many types of bureaucratic harassment we can imagine. Many are not in the surveys.
We focus as our primary measure of effective harassment the time cost that the firms'
management has to incur with government official negotiating interpretations of
regulations. The "efficient grease" hypothesis would suggest a negative correlation
between bribes and the effective wasted time: firms that pay more bribes to buy savings
in terms of the time in getting the officials to certify compliance with the (nominal)
7
12. regulations and/or in securing licenses. That is why many of the "grease payments" are
also called "speed money."
In addition, we will also look into the regulatory burden and cost of capital as
alternative measures of the effective harassment.
Let us start with a cross-country comparison between average time wasted and
average bribery tendency, on the basis of the GCR 1997 data. If we regress the country-
level measure of time wasted by senior managers of firms with public officials on a
constant and the country-level measure of bribery,2 we obtain a slope coefficient of 0.29
which is statistically significant at the five percent level (not reported). Therefore,
countries that allow corruption and bribery to flourish are, on average, also those in
which the firms in the country waste more, not less, time with government officials
haggling over regulations.
Of course, cross-country regressions based on average indices can have serious
drawbacks, both masking the richness of individual observations and also potentially
biasing the results. For instance, there may be differences in country characteristics (e.g.,
the extent of regulation) that may be correlated both with corruption and wasted time.
Thus, we turn next to examine if, within a country, there is any association at the
firm level between time-wasted and bribe burden (as measured by finn-specific bribery
level). Table 1 reports on a basic set of regressions of the determinants of time spent by
the finn's management with public officials. Column I reports the most basic regression
without the country fixed effects, based on all 2761 finns in the GCR 1997 survey. The
coefficient (0.33) is positive and statistically significant. Once we control for the country
fixed effects (Column 2), the point coefficient declines to 0.27, but remains to be positive
and statistically significant. This is consistent with our model, but inconsistent with the
"efficient grease" hypothesis.
As a check of robustness, we also look at two alternative measures of effective red
tape: the degree of effective regulatory burden and regulatory discretion from the same
survey. Here, we regard the cross-firm differences in these measures as true differences
in regulation that firms experience. The possibility that the reported difference is just
difference in firms' perception will be examined in a later section.
Columns 3-6 in Table 1 report regressions with effective regulatory burden and
effective regulatory discretion as the dependent variables, respectively. We see again,
there is a clear positive relationship between bribery and effective red tape the firms face.
In Column 7, we go back to focusing on time wasted as the dependent variable. In
addition to country and sector fixed effects, we also control for the relationship between
regulations and bribery, and we also add two other firm characteristics (whether the firn
is large, and whether it is a foreign investor). There is some evidence that a large or
foreign firn, on average, experiences less time wasted with government officials. Most
crucial to our discussion, we see that the coefficient on bribery declines (relative to
2 A country-levelmeasure of time wasted for a particular country is the equally weighted average of all
individualresponsesfor that country on the relevant question. The country-levelmeasure of bribery is
constructedin the same way.
8
13. Column 2) to 0.17, but remains positive and statistically significant. In Columns 8 and 9,
we perform the regression on two subsamples of countries (those with high average
bribery, and those with high average effective regulatory burden). Again, we see that
firms that pay more bribes, in equilibrium, experience more, not less, time wasted with
the officials on matters related to regulations. Overall, there is no evidence that would
support the "efficient grease" hypothesis.
Table 1: TimeWastedand Bribery,FirmLevel Evidencefrom the GCR97Survey
(Countryfixed effects,sectordummies)
1 2 3 4 5 6 7 8 9
Dependent Time Regulatory Regulatory Time Time Time
variable wasted' intervention Discretion wasted wasted wasted
High High
bribery regulatory
countries intervention
Bribery .33* .27* .22* .21* .26* .26* .17* .17* .25*
(.02) (.02) (.02) (.02) (.02) (.02) (.02) (.05)
Regulatory .23* .19* .35*
interventions (.02) (.04) (.12)
Regulatory .21*
discretion (.02)
Firmnsize .01 .00 -.13# -.11 -.08
(large=l)
(.08) (.07) (.08) (.37) (.18)
Foreign
investor -. 04 -.05 -. 14* -.50## -.01
(.06) (.05) (.07) (.38) (.18)
Country
Fixed
effects No Yes Yes Yes Yes Yes Yes Yes Yes
(58) (58) (58) (58) (58)
Sector
dummies No No No Yes No Yes Yes Yes Yes
N 2,761 2,761 2,765 2,765 2,768 2,756 2748 1,103 590
Adj.R2 .12 .12 .06 .06 .30 .31 .21 .05 .19
*, I, and ##tdenote significant at the 5, 10 and 15 percent levels, respectively.
Note: Constantterm not shown. Standard deviationin parenthesis
1. The questionon briberyto over 2760 firmsin the GCS97survey was: "Irregular,additionalpaymentsconnected
with import and export permits, business licenses, exchangecontrols,tax assessments,police protection or loan
applicationsare common/notcommon"(scale of I to 7); questionon the time spent by management(dependent
variable)was: "Seniormanagement your companyspendsover/lessthan 30% of its time dealing with government
of
bureaucracy (scaleof 1 to 7).
2. Sectoraldummies:agriculture;naturalresources;constructionand real estate; services;manufacturing;
utilities,
and social services.
Asian Exceptionalism?
Some writers have long conjectured that-even if it is shown that overall bribery
and corruption is inimical to growth and business development-the Asian experience
suggests that there is something special about that region, where in fact the "grease"
argument may have had more currency and validity. One often hears the view that
corruption has been part of the Asian culture for a long time and does not seem to hamper
the business there.
We now undertake an explicit examination of the Asian exceptionalism hypothesis.
Focusing on the subsample of the Asian countries, we replicate the key regressions in
Table I and report the results in Table 2. We see that bribery is positively correlated with
all three measures of effective red tape. If anything, the slope coefficient tends to be
9
14. bigger for the Asian subsamplethan for all countriestogether.Thus, the evidencerejects
overwhelmingly Asian exceptionalism
the hypothesis.
Table2: EastAsianExceptionalism
Regulatory Regulatory Time
Dependentvariable intervention discretion wasted
Bribery .25* .25* .35* .35* .35* .36* .25*
(.05) (.05) (.05) (.05) (.05) (.05) (.05)
Regulatoryintervention .14*
(.05)
Regulatorydiscretion .24*
(.05)
Firm size (large=l) .30## .24 -.06 -.15
(.21) (.21) (.23) (.22)
Foreigninvestor -.08 -.17 -.18 -.11
(.14) (.14) (.16) (.15)
Countrydunmmies Yes Yes Yes Yes Yes Yes Yes
Sectordummies No Yes No Yes No Yes Yes
N 479 479 484 484 483 483 478
Adj.R 2 .02 .04 .24 .25 .16 .14 .19
Note: Seefootnotesto Table 1.
Corruptionand Cost-of-Capital
As another check on the relationshipbetween bribery and effective red tape, we
now look at a measure of (firm-specific)cost of capital from the 1996 GCR survey. 3
Government officials may have discretionarypower over to which firm to allocate
subsidizedloans and at what terms. The "efficientgrease"hypothesiswould suggest that
those firms which pay more bribes shouldhave better access to cheaper credit and hence
have a lower cost of capital. Table 3 presents the regressionsof the cost of capital on
bribery. Column 1 presents a simple regressionwhere corruptionis the only regressor
(other than the intercept). The coefficienton bribery is positive and significant.In later
columns where different specificationsand subsamples are experimented,we always
obtain the same qualitativeresult. Therefore, firms that have paid more bribes also have
higher, not lower, cost of capital. This is inconsistent with the "efficient grease"
hypothesis.
3The GCR96surveydid not ask the questionon time spentwith government
officials,whereasthe GCR97
survey did not ask the questionon the cost of capital.
10
15. Table 3: Cost of Capitaland Bribery
Dependent variable 1 2 3 4 5 6
Low-income
countries
East (per capita High
Cost of capital All sample Asia GDP<$3,000) bureaucracy
Bribery .22* .14* .12* .29* .27* .22*
(.03) (.03) (.05) (.14) (.06) (.03)
Bureaucracy .21
(.03)
Dummyhigh bureaucracy
(DHB) .37* .65
(.17) (.75)
DHBx bribery .07* -.05
(.05) .16)
Countryfixed effects Yes(48) Yes(48) Yes(48) Yes(9) Yes Yes
N 1,503 1,494 1,503 237 393 942
Adj. R2 .27 .27 .27 .17 .05 .20
Note: Data on cost of capital,bribery,and bureaucracy from GCR 96 Survey.
are
5. Evidence from the Firm Survey for the 1997 World Development Report
The time wasted variable in the GCR97 survey is a qualitative measure. In
comparison, the same variable in the WDR97 survey asks for more precise, quantitative
questions. The two surveys are also different in terms of country coverage and
methodology. So, in this section, we examine the link between bribery and effective red
tape based on the data from the WDR97 survey.
Table 4 re-examines the relationship between corruption frequencies and effective
red tape. The first two columns look at the extent of regulatory burden. As in the GCR
survey, there is again a positive correlation between bribery frequency and regulatory
burden.
The remaining part of the table reports regressions with time spent with
government officials as the dependent variable. We see that the frequency of corruption
and managers' time spent with officials are positively correlated, just like in the GCR
samples. That is, firms that report to have paid more bribes also have more management
time spent negotiating with the bureaucracies, which is inconsistent with the beneficial
grease hypothesis. This is true after we control the country fixed effects regulatory
burden, predictability of bribe transaction, and firm size. The same pattern holds when
we restrict our attention to the subsample of all foreign firms, or all domestic firms
(Columns 6 and 7), and to the subsample of countries with relatively high predictability
of corruption. Again the same pattern appears in the subsample of countries in which
bribe payments are high, or in the sample of Latin American and the Caribbean, and
Asian countries (not reported).
11
16. Table 4: Bribery and Time Wasted, Firm-level Evidence from the WDR Survey
Dependent variable Regulatory burden Time wasted
Time spent by Foreign Domestic
management with participation firms
bureaucrats All sample sample samples
(1) (2) (3) (4) (5) (6) (7)
Bribery .11* .12* .023* .019* .020* .016* .023*
(.01) (.01) (.002) (.003) (.003) (.006) (.004)
Unpredictability .014* .015* .008 .018'*
(.005) (.005) (.009) (.007)
Regulatoryburden .018* .018* .016* .019*
(.003) (.003) (.005) (.004)
Largefirn .04 .008
(.04) (.007)
Foreignparticipation .06 -. 012#
(.04) (.007)
Countryfixed effects Yes(73) Yes Yes(73) Yes(73) Yes(73) Yes(71) Yes(73)
Sectorfixed effects No Yes No Yes Yes Yes Yes
# obs 3642 3498 3564 2993 2932 1048 1897
2
Adj. R .05 .05 .082 .102 .105 .127 .087
See note to Table 1.
6. Possible Perception Bias
A potential problem with the above regression analysis stems from possible survey
respondent perception bias that may be correlated across survey questions. Suppose that
firms A and B have to pay exactly the same amount of bribes, and that their managers
have to spend the exactly the same amount of time with government officials. If the
manager in firm A who answers the survey questions happen to have a bad feeling
towards the government, he may give a worse ratings on both corruption and
management time questions. If this happens, we may mistakenly think that the answers
from these firms indicate a positive relationship between bribery and time the managers
spend with officials even though none exists by our initial assumption. Note such
perception bias is a potential problem for many research based on survey response.
To address this concern, we construct a measure of perception bias at the level of
individual respondents, based on how the respondents rate the quality of arguably
identical public good. We label our measure as "Kvetch4 ," after the Yiddish expression
for habitual complainer.
Let us start with the GCR97 survey. In order to ensure robustness of our
subsequent regression results, we construct three Kvetch measures, using incrementally
more questions from the survey. "Kvetchl" is the deviation of individual respondent's
answer to Question 4.01, "overall infrastructure in your country" is "worse than in your
major trading partners," from the average answer from all respondents in that country. A
high number implies a greater tendency to gripe.
4According to Merriam Webster's Collegiate Dictionary, Kvetch (a Yiddish word) as a noun means a
habitual complainer. It can also be used as a verb to mean "to complain habitually: GRIPE."
12
17. "Kvetch2" is an equally-weighted average of the individual answer's deviations
from the mean for Question 4.01 (described above) and Question 4.12 ("government
budget neglects infrastructure investment").
"Kvetch3" is an equally-weighted average of the individual answers from the
national mean for four questions, 4.01 and 4.12 described above, plus 4.09 ("your country
suffers from severe power shortage") and 4.11 ("warehousing, storage facilities, and
distribution networks are grossly inadequate"). Again, a high number imply a greater
tendency to gripe.
We include these measures, one by one, in our regressions in order to control for
the possibilities that some respondents are more likely than others to exaggerate how bad
government officials are on every question. The objective is to see if the positive
association between the time managers spend with government officials and perceived
corruption level reported early would go away with this control.
Note that quality of the public goods covered by the Kvetch measures, particularly
"Kvetch3," may, to some degree, be "customized" for exactly the same reason as our
theoretic story. Therefore, these measures may over-correct the perception bias. In
other words, there is a risk that the positive association between the time managers spend
and corruption disappears when the Kvetch measures are added into the regressions even
when the true relationship is positive.
Table 5 reports the regression results. All three kvetch measures have positive
coefficients in all regressions, and eight out of nine of them are statistically significant.
Including the Kvetch measures tend to reduce the point estimates on the bribery
coefficient relative to the comparable specifications without Kvetch (Table 1). This is
consistent with the hypothesis that perception bias may be present. However, even after
controlling for the perception bias, the positive correlation between bribery and effective
red tape does not go away.
We implement a similar idea to the WDR sample. First, we also construct three
measures of perception bias which use increasingly more questions from the surveys.
"Kvetchl" is an equally weighted average of the respondent's ratings (on a 1-6 scale with
1 being the best and 6 the poorest) of the following three public goods: the general
condition of roads, the efficiency of mail delivery, and the quality of public care
provision.5
5 They are Question 22 b-d, respectively, in the WDR97 survey.
13
18. Table 5: Controllingfor Propensityto Gripe,GRC97
Dependent Timewasted
variable Regulatoryburden Regulatorydiscretion with bureaucrats
(1) (2) (3) (4) (5) (6) (7) (8) (9)
Bribery .19* .18* .16* .22* .20* .17* .17* .16* .15*
(.02) (.02) (.02) (.02) (.02) (.02) (.02) (.02) (.02)
Regulatory .23* .23* .22*
burden (.02) (.02) (.02)
Regulatory .21* .20* .19*
discretion (.02) (.03) (.03)
Large firm .01 .02 .01 -.03 -.00 -.02 -.14# .13## -.14##
(0.08) (0.08) (.08) (.06) (.06) (.06) (.08) (.08) (.08)
Foreignfirm -.03 -.04 .03 -.04 -.05 -.03 -.15* -.14* -.14*
(.060 (.06) (.06) (.05) (.05) (.05) (.07) (.07) (.07)
Kvetch1 .12* .20* .018
(.02) (.02) (.026)
Kvetch2 .21* .33* .084*
(.03) (.02) (.033)
Kvetch3 .29* .44* .140*
(.03) (.03) (.04)
Country
fixed effects Yes Yes Yes Yes Yes Yes Yes Yes Yes
Sector
dummies Yes Yes Yes Yes Yes Yes Yes Yes Yes
#obs/R2 2742/.07 2751/.07 2751/.08 2744.30 2754/.29 2754/.27 2726/.21 2735/.21 2735/.21
Note: *, #, and ## denotesignificantat the 5, 10 and 15percentlevels,respectively.
"Kvetch2" is an equally weighted average of the respondent's ratings (all on a 1-6
scale with 1 being the best) of the following four public goods: General rating of the
efficiency of government in delivering services right now (Question 25, Part 1, in the
WDR survey), plus the three questions covered in "Kvetchl."
"Kvetch3" is equally weighted average of the ratings of six questions: in addition to
the four public goods covered in "Kvetch2," we add "frequency of power outages" and
"time it takes to get a public telephone line connected" (Questions 23 and 24,
respectively, in the WDR survey).
Next, we repeat the key regressions in Table 4 with the three Kvetch measures
added one by one. The regression results are reported in Table 6. As we can see, the
Kvetch variables are positively correlated with the measures of red tape (regulatory
burden and the time firm officers have to spend with government officials), and their
inclusion generally reduces the coefficient on the bribery variable. This suggests that part
of the correlation between reported effective red tape and reported bribery frequency may
indeed relate to the Kvetch effect. However, in all cases, the coefficients on the bribery
variable remain positive and statistically significant, suggesting the perception bias due to
differential grumpiness is not the driving reason for our earlier findings.
14
19. Table 6: Controllingfor Propensityto Gripe,WDR Survey
Dependent
variable Regulatoryburden Timespent with bureaucrats
(1) (2) (3) (4) (5) (6) (7) (8) (9)
Bribery .10* .10* .10* .07* .06* .06* .023* .023* .023*
(.01) (.01) (.01) (.02) (.02) (.02) (.003) (.003) (.003)
Unpredictability .06* .03 .03 .019* .017* .016*
of bribes (.03) (.03) (.03) (.005) (.005) (.005)
Regulatory .015* .015* .015*
burden (003) (.003) (.003)
Large firn .05 .04 .04 .05 .05 .05 .003 .002 .003
(.05) (.04) (.04) (.05) (.04) (.05) (.008) (.007) (.007)
Foreign .04 .06 .06 .05 .06 .07# -.0070 -.010## -.010#
participation (.04) (.04) (.04) (.04) (.04) (.04) (.0066) (.006) (.006)
Kvetchl .14* .14* .0010
(.02) (.02)
(.0035)
Kvetch2 .18* .18* .0034
(.02) (.02) (.0038)
Kvetch3 .20* .20* .0074#
(.03) (.03) (.0043)
Country fixed yes yes yes yes yes yes yes yes yes
effects
Sector fixed yes yes yes yes yes yes yes yes yes
effects
#obs. 3260 3484 3487 3283 3475 3478 3121 3298 3298
Adj. R2 .05 .06 .06 .05 .07 .07 0.103 0.111 0.106
See notes to Table 1.
7. Conclusions and Implications
If bureaucraticburden and delay are exogenous,bribe payment may help firms to
reduce the effectiveburden and delay they face. In a more general equilibriumin which
regulatory burden and delay are endogenouslychosen by the bureaucrats in order to
extract rents, more bribe payment will not be associated with less delay and lower
burden. In a simplemodel, we show that the contrarycan be true: the bribes firms have
to pay and the effectiveharassmentthey face in equilibriumcanbe positivelycorrelated.
In the second part of the paper, we examinesome evidencefrom three large firm-
level surveys, focusing on the relationship between bribe payment and a variety of
measures of official harassment (management time wasted with bureaucracy,regulatory
burden, and cost of capital). The evidence suggests that there is no support for the
"efficientgrease" hypothesis.In fact, a consistentpatternis that bribery and measures of
official harassmentare positivelycorrelatedacross firms.
While the surveys at hand have some clear advantagesfor our purposes, such as
questions askingthousands of firms throughoutthe world on the very variableswe are
honing in, its potentialproblems oughtto be explicitlytaken into account as well. Chief
among them is the possible perceptionbias, given that the survey does not elicit hard
numbers from the respondentsbut only ratings in an index. We have proposed and
15
20. implemented an approach to deal with perception bias and found that the results are still
robust. Future work with a more precise measure of bribery (and other variables) could
helps us obtain more accurate answer.
The results in the paper have important policy implications. Just to clarify, this
paper does not say that a bribe-paying firm in a corrupt environment is individually
irrational. Rather, it says that the business community as a whole can benefit from
international laws that strengthen their ability to credibly commit to no-bribery even if an
individual firm may find it otherwise optimal to bribe in a corrupt environment, . Such
laws not only may reduce bribe payment, it may actually reduce the harassment firms
may face in equilibrium.
References
Ades, Alberto, and Rafael Di Tella. 1997. "National Champions and Corruption: Some
UnpleasantInterventionistArithmetic."TheEconomicJournal 107(July, 443): 1023-42.
Andvig, Jens Christopher.1991. "The Economicsof Corruption:A Survey." Studi Economici.
43:57-94.
Banerjee, Abhijit. 1997. "A Theory of Misgovernance."Departmentof Economics Working
Paper 97/04 February, pp. 62. Massachusetts Institute of Technology, Cambridge,
Massachusetts.
Bliss, Christopher,and Rafael Di Tella. 1997. "Does CompetitionKill Corruption?"Journal of
PoliticalEconomy5(December, 105): 1001-1023.
Bardhan, Pranab. 1997. "Corruption and Development: A Review of Issues." Journal of
EconomicLiteratureVol.XXXV(September):1320-1346.
Eliott, KimberlyAnn. 1997. "Corruptionand the GlobalEconomy." Institute for International
Economics,WashingtonDC.
Hines, James Jr. 1995. "Forbidden Payment: Foreign Bribery and American Business After
1977."NBERWorkingPaper 5266.September.
Huntington,SamuelP. 1968.Political Orderin ChangingSocieties.New Haven:Yale University
Press.
Kaufmann,Daniel. 1997a. "The Missing Pillar of a GrowthStrategy for Ukraine: Institutional
and Policy Reforn for Private Sector Development."In Peter K. Cornelius and Patrick
Lenain. eds., Ukraine:Acceleratingthe Transitionto Market. Washington:International
MonetaryFund.pp 234-275.
Kaufmann,Daniel. 1997b."Corruption:SomeMyths and Facts." An early versionwas published
in ForeignPolicy (Summer1997):114-131.
Klitgaard,Robert. 1990.TropicalGangsters.BasicBooks.
Krueger,Anne 0. 1974. "The PoliticalEconomyof Rent-seekingSociety." AmericanEconomic
Review 64(June,3):291-303.
Leff, Nathaniel H. 1964. "Economic Development Through Bureaucratic Corruption." The
AmericanBehaviorScientist8(November, 8-14.
2):
Lui, Francis. 1985."An EquilibriumQueuingModel of Bribery." Journal of Political Economy
93(August, 760-781.
4):
Mauro,Paolo. 1995."Corruptionand Growth."QuarterlyJournal of Economics110:681-712.
16
21. Myrdal, Gunnar. 1968. Asian Drama: An Inquiry into the Poverty of Nations. New York:
PantheonBooks.
Rose-Ackerman,Susan. 1975. "The Economicsof Corruption."Journal of Public Economics
June, 5617.
Rose-Ackerman, Susan. 1978. Corruption: A Study in Political Economy. New York: Academic
Press.
Rose-Ackerman,Susan. 1998. "Corruptionand Development."In Boris Pleskovic and Joseph
Stiglitz. eds.. Annual World Bank Conference on Development Economics-1997.
Washington,D.C.: TheWorldBank.
Shleifer,Andrei, and Robert W. Vishny. 1993."Corruption." QuarterlyJournal of Economics
108: 599-617.
Shleifer,Andrei, and Robert W. Vishny. 1994. "Politiciansand Firms." QuarterlyJournal of
Economics (November).
Tanzi, Vito. 1998. "Corruption Around the World: Causes, Consequences,Scope and Cures."
International Monetary Fund StaffPapers 45(December): 559-94.
Wei, Shang-Jin. 1997a. "How Taxing is Corruptionon InternationalInvestors?" The National
Bureauof EconomicResearchWorkingPaper 6030.May.
Wei, Shang-Jin. 1997b. "Why is CorruptionSo Much More Taxing Than Tax? Arbitrariness
Kills." The NationalBureauof EconomicResearchWorkingPaper. November.
17
22.
23. Policy Research Working Paper Series
Contact
Title Author Date for paper
WPS2240 The Effects of Land Registration on Frank F. K. Byamugisha November 1999 E. Gelos
Financial Development and Economic 37846
Growth: A Theoretical and Conceptual
Framework
WPS2241 How Land Registration Affects Frank F. K. Byamugisha November 1999 E. Geoos
Financial Development and Economic 37846
Growth in Thaiiand
WPS2242 Confronting Competition: Investment Ritva Reinikka November 1999 H. Sladovich
Response and Constraints in Uganda Jakob Svensson 37698
WPS2243 Designing Pro-Poor Water and Kristin Komives November 1999 M. Salehi
Sewer Concessions: Early Lessons 37157
from Bolivia
WPS2244 True World income Distribution, 1988 Branko Milanovic November 1999 P. Sader
and 1993: First Calculations, Based 33902
on Household Surveys Alone
WPS2245 Opportunities for Improving Susmita Dasgupta November 1999 Y. D'Souza
Environmental Compliance in Mexico 31449
WPS2246 Infrastructure's Contribution to David Canning November 1999 H. Sladovich
Aggregate Output 37698
WPS2247 Does Deposit Insurance Increase Ashl Demirguci-Kunt November 1999 K. Labrie
Banking System Stability? Enrica Detragiache 31001
An Empirical Investigation
WPS2248 Privatization and Regulation of Antonio Estache November 1999 G. Chenet-Smith
Transport Infrastructure in the 36370
1990s: Successes ... and Bugs to
Fix for the Next Millennium
WPS2249 Argentina's Transport Privatization Antonio Estache November 1999 G. Chenet-Smith
and Re-Regulation: Ups and Downs Jose C. Carbajo 36370
of a Daring Decade-Long Experience Gines de Rus
WPS2250 Universal Service Obligations in Omar Chisari Novernber 1999 G. Chenet-Srmith
Utility Concession Contracts and Antonio Estache 36370
the Needs of the Poor in Argentina's
Privatizations
WPS2251 Will the Euro Create a Bonanza Daniel Cohen November 1999 H. Vargas
For Africa? Nicolai Kristensen 37871
Dorte Verner
24. Policy Research Working Paper Series
Contact
Title Author Date for paper
WPS2252ProductivityGrowth,Capital Ejaz Ghani 1999
December N. Mensah
Accumulation, the Banking
and Vivek Suri 80546
Sector:SomeLessonsfrom Malaysia
WPS2253Revenue Recycling the Welfare IanW. H. Parry
and 1999
December R. Yazigi
Effectsof Road Pricing AntonioMiguelR. Bento 37176
j2V 1.