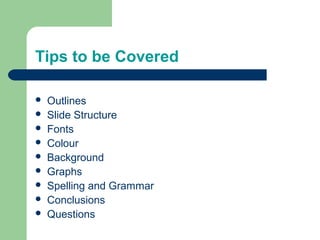
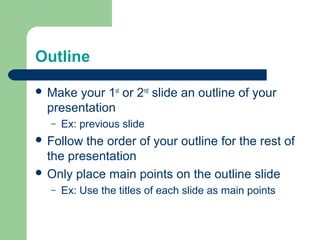
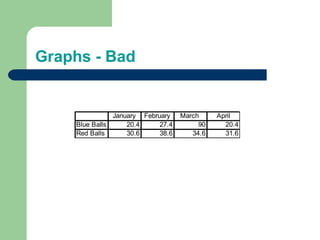
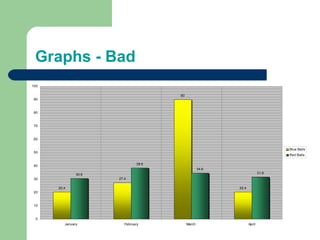
SlideShare a Scribd company logo
Making PowerPoint Slides

Avoiding the Pitfalls
of Bad Slides
Tips to be Covered










Outlines
Slide Structure
Fonts
Colour
Background
Graphs
Spelling and Grammar
Conclusions
Questions
Outline
 Make

your 1st or 2nd slide an outline of your
presentation
–

Ex: previous slide

 Follow

the order of your outline for the rest of
the presentation
 Only place main points on the outline slide
–

Ex: Use the titles of each slide as main points
Slide Structure – Good
 Use

1-2 slides per minute of your presentation
 Write in point form, not complete sentences
 Include 4-5 points per slide
 Avoid wordiness: use key words and phrases
only
Slide Structure - Bad
 This

page contains too many words for a
presentation slide. It is not written in point
form, making it difficult both for your audience
to read and for you to present each point.
Although there are exactly the same number of
points on this slide as the previous slide, it
looks much more complicated. In short, your
audience will spend too much time trying to
read this paragraph instead of listening to you.
Slide Structure – Good
 Show
–
–
–

one point at a time:

Will help audience concentrate on what you are
saying
Will prevent audience from reading ahead
Will help you keep your presentation focused
Slide Structure - Bad
 Do

not use distracting animation

 Do

not go overboard with the animation

 Be

consistent with the animation that you use
Fonts - Good
 Use

at least an 18-point font
 Use different size fonts for main points and
secondary points
–

this font is 24-point, the main point font is 28-point,
and the title font is 36-point

 Use

Arial

a standard font like Times New Roman or
Fonts - Bad


If you use a small font, your audience won’t be able to read what you have written

 CAPITALIZE

ONLY WHEN NECESSARY. IT
IS DIFFICULT TO READ

 Don’t use a complicated font
Colour - Good
 Use

a colour of font that contrasts sharply with
the background
–

Ex: blue font on white background

 Use

colour to reinforce the logic of your
structure
–

Ex: light blue title and dark blue text

 Use
–

colour to emphasize a point

But only use this occasionally
Colour - Bad
 Using

a font colour that does not contrast with
the background colour is hard to read
 Using colour for decoration is distracting and
annoying.
 Using a different colour for each point is
unnecessary
–

Using a different colour for secondary points is also
unnecessary

 Trying

to be creative can also be bad
Background - Good
 Use

backgrounds such as this one that are
attractive but simple

 Use
 Use

backgrounds which are light

the same background consistently
throughout your presentation
Background – Bad
 Avoid

backgrounds that are distracting or
difficult to read from
 Always be consistent with the background that
you use
Graphs - Good
 Use
–
–

graphs rather than just charts and words

Data in graphs is easier to comprehend & retain
than is raw data
Trends are easier to visualize in graph form

 Always

title your graphs
Graphs - Bad

January February
Blue Balls
20.4
27.4
Red Balls
30.6
38.6

March
90
34.6

April
20.4
31.6
Graphs - Good
Items Sold in First Quarter of 2002
100
90
80
70
60
50
40
30

Blue Balls
Red Balls

20
10
0
January

February

March

April
Graphs - Bad
100
90

90

80

70

60
Blue Balls

50

Red Balls
38.6

40

34.6
31.6

30.6
27.4

30
20.4

20.4

20

10

0
January

February

March

April
Graphs - Bad
 Minor

gridlines are unnecessary
 Font is too small
 Colours are illogical
 Title is missing
 Shading is distracting
Spelling and Grammar
 Proof
–
–
–

 If

your slides for:

speling mistakes
the use of of repeated words
grammatical errors you might have make

English is not your first language, please
have someone else check your presentation!
Conclusion
 Use
–

Your audience is likely to remember your last words

 Use
–
–

an effective and strong closing

a conclusion slide to:

Summarize the main points of your presentation
Suggest future avenues of research
Questions??
 End

your presentation with a simple question
slide to:
–
–
–

Invite your audience to ask questions
Provide a visual aid during question period
Avoid ending a presentation abruptly

More Related Content

More from jameschloejames

More from jameschloejames (20)

Presentation_NEW.PPTX
Presentation_NEW.PPTXPresentation_NEW.PPTX
Presentation_NEW.PPTX
 
Presentation_NEW.PPTX
Presentation_NEW.PPTXPresentation_NEW.PPTX
Presentation_NEW.PPTX
 
Presentation_NEW.PPTX
Presentation_NEW.PPTXPresentation_NEW.PPTX
Presentation_NEW.PPTX
 
Presentation_NEW.PPTX
Presentation_NEW.PPTXPresentation_NEW.PPTX
Presentation_NEW.PPTX
 
Presentation_NEW.PPTX
Presentation_NEW.PPTXPresentation_NEW.PPTX
Presentation_NEW.PPTX
 
Presentation_NEW.PPTX
Presentation_NEW.PPTXPresentation_NEW.PPTX
Presentation_NEW.PPTX
 
Presentation_NEW.PPTX
Presentation_NEW.PPTXPresentation_NEW.PPTX
Presentation_NEW.PPTX
 
Presentation_NEW.PPTX
Presentation_NEW.PPTXPresentation_NEW.PPTX
Presentation_NEW.PPTX
 
Presentation_NEW.PPTX
Presentation_NEW.PPTXPresentation_NEW.PPTX
Presentation_NEW.PPTX
 
Presentation_NEW.PPTX
Presentation_NEW.PPTXPresentation_NEW.PPTX
Presentation_NEW.PPTX
 
Presentation_NEW.PPTX
Presentation_NEW.PPTXPresentation_NEW.PPTX
Presentation_NEW.PPTX
 
Presentation_NEW.PPTX
Presentation_NEW.PPTXPresentation_NEW.PPTX
Presentation_NEW.PPTX
 
Presentation_NEW.PPTX
Presentation_NEW.PPTXPresentation_NEW.PPTX
Presentation_NEW.PPTX
 
Presentation_NEW.PPTX
Presentation_NEW.PPTXPresentation_NEW.PPTX
Presentation_NEW.PPTX
 
Presentation_NEW.PPTX
Presentation_NEW.PPTXPresentation_NEW.PPTX
Presentation_NEW.PPTX
 
Presentation_NEW.PPTX
Presentation_NEW.PPTXPresentation_NEW.PPTX
Presentation_NEW.PPTX
 
Presentation_NEW.PPTX
Presentation_NEW.PPTXPresentation_NEW.PPTX
Presentation_NEW.PPTX
 
Presentation_NEW.PPTX
Presentation_NEW.PPTXPresentation_NEW.PPTX
Presentation_NEW.PPTX
 
Presentation_NEW.PPTX
Presentation_NEW.PPTXPresentation_NEW.PPTX
Presentation_NEW.PPTX
 
Presentation_NEW.PPTX
Presentation_NEW.PPTXPresentation_NEW.PPTX
Presentation_NEW.PPTX
 

Recently uploaded

Empowering NextGen Mobility via Large Action Model Infrastructure (LAMI): pav...
Empowering NextGen Mobility via Large Action Model Infrastructure (LAMI): pav...Empowering NextGen Mobility via Large Action Model Infrastructure (LAMI): pav...
Empowering NextGen Mobility via Large Action Model Infrastructure (LAMI): pav...Thierry Lestable
 
When stars align: studies in data quality, knowledge graphs, and machine lear...
When stars align: studies in data quality, knowledge graphs, and machine lear...When stars align: studies in data quality, knowledge graphs, and machine lear...
When stars align: studies in data quality, knowledge graphs, and machine lear...Elena Simperl
 
Bits & Pixels using AI for Good.........
Bits & Pixels using AI for Good.........Bits & Pixels using AI for Good.........
Bits & Pixels using AI for Good.........Alison B. Lowndes
 
Powerful Start- the Key to Project Success, Barbara Laskowska
Powerful Start- the Key to Project Success, Barbara LaskowskaPowerful Start- the Key to Project Success, Barbara Laskowska
Powerful Start- the Key to Project Success, Barbara LaskowskaCzechDreamin
 
To Graph or Not to Graph Knowledge Graph Architectures and LLMs
To Graph or Not to Graph Knowledge Graph Architectures and LLMsTo Graph or Not to Graph Knowledge Graph Architectures and LLMs
To Graph or Not to Graph Knowledge Graph Architectures and LLMsPaul Groth
 
Speed Wins: From Kafka to APIs in Minutes
Speed Wins: From Kafka to APIs in MinutesSpeed Wins: From Kafka to APIs in Minutes
Speed Wins: From Kafka to APIs in Minutesconfluent
 
Key Trends Shaping the Future of Infrastructure.pdf
Key Trends Shaping the Future of Infrastructure.pdfKey Trends Shaping the Future of Infrastructure.pdf
Key Trends Shaping the Future of Infrastructure.pdfCheryl Hung
 
Optimizing NoSQL Performance Through Observability
Optimizing NoSQL Performance Through ObservabilityOptimizing NoSQL Performance Through Observability
Optimizing NoSQL Performance Through ObservabilityScyllaDB
 
Assuring Contact Center Experiences for Your Customers With ThousandEyes
Assuring Contact Center Experiences for Your Customers With ThousandEyesAssuring Contact Center Experiences for Your Customers With ThousandEyes
Assuring Contact Center Experiences for Your Customers With ThousandEyesThousandEyes
 
In-Depth Performance Testing Guide for IT Professionals
In-Depth Performance Testing Guide for IT ProfessionalsIn-Depth Performance Testing Guide for IT Professionals
In-Depth Performance Testing Guide for IT ProfessionalsExpeed Software
 
Custom Approval Process: A New Perspective, Pavel Hrbacek & Anindya Halder
Custom Approval Process: A New Perspective, Pavel Hrbacek & Anindya HalderCustom Approval Process: A New Perspective, Pavel Hrbacek & Anindya Halder
Custom Approval Process: A New Perspective, Pavel Hrbacek & Anindya HalderCzechDreamin
 
Essentials of Automations: Optimizing FME Workflows with Parameters
Essentials of Automations: Optimizing FME Workflows with ParametersEssentials of Automations: Optimizing FME Workflows with Parameters
Essentials of Automations: Optimizing FME Workflows with ParametersSafe Software
 
UiPath Test Automation using UiPath Test Suite series, part 1
UiPath Test Automation using UiPath Test Suite series, part 1UiPath Test Automation using UiPath Test Suite series, part 1
UiPath Test Automation using UiPath Test Suite series, part 1DianaGray10
 
JMeter webinar - integration with InfluxDB and Grafana
JMeter webinar - integration with InfluxDB and GrafanaJMeter webinar - integration with InfluxDB and Grafana
JMeter webinar - integration with InfluxDB and GrafanaRTTS
 
ODC, Data Fabric and Architecture User Group
ODC, Data Fabric and Architecture User GroupODC, Data Fabric and Architecture User Group
ODC, Data Fabric and Architecture User GroupCatarinaPereira64715
 
From Daily Decisions to Bottom Line: Connecting Product Work to Revenue by VP...
From Daily Decisions to Bottom Line: Connecting Product Work to Revenue by VP...From Daily Decisions to Bottom Line: Connecting Product Work to Revenue by VP...
From Daily Decisions to Bottom Line: Connecting Product Work to Revenue by VP...Product School
 
Search and Society: Reimagining Information Access for Radical Futures
Search and Society: Reimagining Information Access for Radical FuturesSearch and Society: Reimagining Information Access for Radical Futures
Search and Society: Reimagining Information Access for Radical FuturesBhaskar Mitra
 
Knowledge engineering: from people to machines and back
Knowledge engineering: from people to machines and backKnowledge engineering: from people to machines and back
Knowledge engineering: from people to machines and backElena Simperl
 
De-mystifying Zero to One: Design Informed Techniques for Greenfield Innovati...
De-mystifying Zero to One: Design Informed Techniques for Greenfield Innovati...De-mystifying Zero to One: Design Informed Techniques for Greenfield Innovati...
De-mystifying Zero to One: Design Informed Techniques for Greenfield Innovati...Product School
 
Connector Corner: Automate dynamic content and events by pushing a button
Connector Corner: Automate dynamic content and events by pushing a buttonConnector Corner: Automate dynamic content and events by pushing a button
Connector Corner: Automate dynamic content and events by pushing a buttonDianaGray10
 

Recently uploaded (20)

Empowering NextGen Mobility via Large Action Model Infrastructure (LAMI): pav...
Empowering NextGen Mobility via Large Action Model Infrastructure (LAMI): pav...Empowering NextGen Mobility via Large Action Model Infrastructure (LAMI): pav...
Empowering NextGen Mobility via Large Action Model Infrastructure (LAMI): pav...
 
When stars align: studies in data quality, knowledge graphs, and machine lear...
When stars align: studies in data quality, knowledge graphs, and machine lear...When stars align: studies in data quality, knowledge graphs, and machine lear...
When stars align: studies in data quality, knowledge graphs, and machine lear...
 
Bits & Pixels using AI for Good.........
Bits & Pixels using AI for Good.........Bits & Pixels using AI for Good.........
Bits & Pixels using AI for Good.........
 
Powerful Start- the Key to Project Success, Barbara Laskowska
Powerful Start- the Key to Project Success, Barbara LaskowskaPowerful Start- the Key to Project Success, Barbara Laskowska
Powerful Start- the Key to Project Success, Barbara Laskowska
 
To Graph or Not to Graph Knowledge Graph Architectures and LLMs
To Graph or Not to Graph Knowledge Graph Architectures and LLMsTo Graph or Not to Graph Knowledge Graph Architectures and LLMs
To Graph or Not to Graph Knowledge Graph Architectures and LLMs
 
Speed Wins: From Kafka to APIs in Minutes
Speed Wins: From Kafka to APIs in MinutesSpeed Wins: From Kafka to APIs in Minutes
Speed Wins: From Kafka to APIs in Minutes
 
Key Trends Shaping the Future of Infrastructure.pdf
Key Trends Shaping the Future of Infrastructure.pdfKey Trends Shaping the Future of Infrastructure.pdf
Key Trends Shaping the Future of Infrastructure.pdf
 
Optimizing NoSQL Performance Through Observability
Optimizing NoSQL Performance Through ObservabilityOptimizing NoSQL Performance Through Observability
Optimizing NoSQL Performance Through Observability
 
Assuring Contact Center Experiences for Your Customers With ThousandEyes
Assuring Contact Center Experiences for Your Customers With ThousandEyesAssuring Contact Center Experiences for Your Customers With ThousandEyes
Assuring Contact Center Experiences for Your Customers With ThousandEyes
 
In-Depth Performance Testing Guide for IT Professionals
In-Depth Performance Testing Guide for IT ProfessionalsIn-Depth Performance Testing Guide for IT Professionals
In-Depth Performance Testing Guide for IT Professionals
 
Custom Approval Process: A New Perspective, Pavel Hrbacek & Anindya Halder
Custom Approval Process: A New Perspective, Pavel Hrbacek & Anindya HalderCustom Approval Process: A New Perspective, Pavel Hrbacek & Anindya Halder
Custom Approval Process: A New Perspective, Pavel Hrbacek & Anindya Halder
 
Essentials of Automations: Optimizing FME Workflows with Parameters
Essentials of Automations: Optimizing FME Workflows with ParametersEssentials of Automations: Optimizing FME Workflows with Parameters
Essentials of Automations: Optimizing FME Workflows with Parameters
 
UiPath Test Automation using UiPath Test Suite series, part 1
UiPath Test Automation using UiPath Test Suite series, part 1UiPath Test Automation using UiPath Test Suite series, part 1
UiPath Test Automation using UiPath Test Suite series, part 1
 
JMeter webinar - integration with InfluxDB and Grafana
JMeter webinar - integration with InfluxDB and GrafanaJMeter webinar - integration with InfluxDB and Grafana
JMeter webinar - integration with InfluxDB and Grafana
 
ODC, Data Fabric and Architecture User Group
ODC, Data Fabric and Architecture User GroupODC, Data Fabric and Architecture User Group
ODC, Data Fabric and Architecture User Group
 
From Daily Decisions to Bottom Line: Connecting Product Work to Revenue by VP...
From Daily Decisions to Bottom Line: Connecting Product Work to Revenue by VP...From Daily Decisions to Bottom Line: Connecting Product Work to Revenue by VP...
From Daily Decisions to Bottom Line: Connecting Product Work to Revenue by VP...
 
Search and Society: Reimagining Information Access for Radical Futures
Search and Society: Reimagining Information Access for Radical FuturesSearch and Society: Reimagining Information Access for Radical Futures
Search and Society: Reimagining Information Access for Radical Futures
 
Knowledge engineering: from people to machines and back
Knowledge engineering: from people to machines and backKnowledge engineering: from people to machines and back
Knowledge engineering: from people to machines and back
 
De-mystifying Zero to One: Design Informed Techniques for Greenfield Innovati...
De-mystifying Zero to One: Design Informed Techniques for Greenfield Innovati...De-mystifying Zero to One: Design Informed Techniques for Greenfield Innovati...
De-mystifying Zero to One: Design Informed Techniques for Greenfield Innovati...
 
Connector Corner: Automate dynamic content and events by pushing a button
Connector Corner: Automate dynamic content and events by pushing a buttonConnector Corner: Automate dynamic content and events by pushing a button
Connector Corner: Automate dynamic content and events by pushing a button
 

Document 5129338

  • 1. Making PowerPoint Slides Avoiding the Pitfalls of Bad Slides
  • 2. Tips to be Covered          Outlines Slide Structure Fonts Colour Background Graphs Spelling and Grammar Conclusions Questions
  • 3. Outline  Make your 1st or 2nd slide an outline of your presentation – Ex: previous slide  Follow the order of your outline for the rest of the presentation  Only place main points on the outline slide – Ex: Use the titles of each slide as main points
  • 4. Slide Structure – Good  Use 1-2 slides per minute of your presentation  Write in point form, not complete sentences  Include 4-5 points per slide  Avoid wordiness: use key words and phrases only
  • 5. Slide Structure - Bad  This page contains too many words for a presentation slide. It is not written in point form, making it difficult both for your audience to read and for you to present each point. Although there are exactly the same number of points on this slide as the previous slide, it looks much more complicated. In short, your audience will spend too much time trying to read this paragraph instead of listening to you.
  • 6. Slide Structure – Good  Show – – – one point at a time: Will help audience concentrate on what you are saying Will prevent audience from reading ahead Will help you keep your presentation focused
  • 7. Slide Structure - Bad  Do not use distracting animation  Do not go overboard with the animation  Be consistent with the animation that you use
  • 8. Fonts - Good  Use at least an 18-point font  Use different size fonts for main points and secondary points – this font is 24-point, the main point font is 28-point, and the title font is 36-point  Use Arial a standard font like Times New Roman or
  • 9. Fonts - Bad  If you use a small font, your audience won’t be able to read what you have written  CAPITALIZE ONLY WHEN NECESSARY. IT IS DIFFICULT TO READ  Don’t use a complicated font
  • 10. Colour - Good  Use a colour of font that contrasts sharply with the background – Ex: blue font on white background  Use colour to reinforce the logic of your structure – Ex: light blue title and dark blue text  Use – colour to emphasize a point But only use this occasionally
  • 11. Colour - Bad  Using a font colour that does not contrast with the background colour is hard to read  Using colour for decoration is distracting and annoying.  Using a different colour for each point is unnecessary – Using a different colour for secondary points is also unnecessary  Trying to be creative can also be bad
  • 12. Background - Good  Use backgrounds such as this one that are attractive but simple  Use  Use backgrounds which are light the same background consistently throughout your presentation
  • 13. Background – Bad  Avoid backgrounds that are distracting or difficult to read from  Always be consistent with the background that you use
  • 14. Graphs - Good  Use – – graphs rather than just charts and words Data in graphs is easier to comprehend & retain than is raw data Trends are easier to visualize in graph form  Always title your graphs
  • 15. Graphs - Bad January February Blue Balls 20.4 27.4 Red Balls 30.6 38.6 March 90 34.6 April 20.4 31.6
  • 16. Graphs - Good Items Sold in First Quarter of 2002 100 90 80 70 60 50 40 30 Blue Balls Red Balls 20 10 0 January February March April
  • 17. Graphs - Bad 100 90 90 80 70 60 Blue Balls 50 Red Balls 38.6 40 34.6 31.6 30.6 27.4 30 20.4 20.4 20 10 0 January February March April
  • 18. Graphs - Bad  Minor gridlines are unnecessary  Font is too small  Colours are illogical  Title is missing  Shading is distracting
  • 19. Spelling and Grammar  Proof – – –  If your slides for: speling mistakes the use of of repeated words grammatical errors you might have make English is not your first language, please have someone else check your presentation!
  • 20. Conclusion  Use – Your audience is likely to remember your last words  Use – – an effective and strong closing a conclusion slide to: Summarize the main points of your presentation Suggest future avenues of research
  • 21. Questions??  End your presentation with a simple question slide to: – – – Invite your audience to ask questions Provide a visual aid during question period Avoid ending a presentation abruptly