Doc1
•Download as DOCX, PDF•
0 likes•104 views
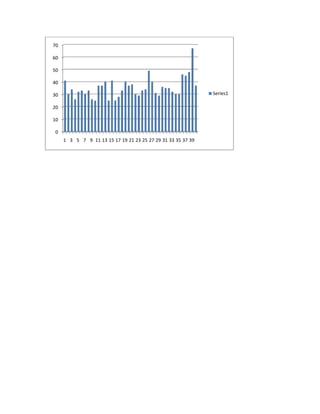
The document shows a line graph with a single data series labeled "Series1" that tracks a measurement over 39 periods. The measurement starts at 70, declines steadily to a low of 10, then fluctuates between 10 and 30 for the remainder of the periods.
Report
Share
Report
Share
Recommended
"Getting Beyond Use" as presented at #UCD15
Now with 5 key principles for designing with Cultural Affordances: "Much of the discussion about user experience design is focused on use, but there are additional issues to consider. In particular, issues of meaning. John will present the concept of Cultural Affordances—qualities of objects that help people to understand through the frame of their own past experience—and discuss the ways that we as designers can use cultural affordances to more effectively design for our audience."
Influencing Business using a Wall of Knowledge
Large corporations today typically understand that a user experience practice is necessary to obtain insights about users needs, wants and desires. But what is the best way to communicate those insights in order to influence the project direction?
Learn how Nationwide uses their Wall of Knowledge to illustrate current design problems, the problem's impact to the user, and suggest possible solutions in a way that influences the way business teams think about the project.
The process of creating a Wall of Knowledge invites discussion, getting stakeholders to come together and move around a physical space. It organizes large amounts of data in an easily digestible way, and encourages business partners to approach the problem from a different perspective.
Creating a Wall of Knowledge invites collaboration and debate. The end result is a communally created story, agreed upon by all of the stakeholders, that clearly illustrates the project's next steps.
COMPREHENSIVE URBAN STUDY ON INDRE BY, COPENHAGEN
This study includes a comprehensive and detailed urban study done in Indre By, Copenhagen, Denmark. Team: Abishek Narayan R S, Afrin Banu, Akshaya Ravi & Dhanush P. Guided By, Prof. Senthil Mani & Prof. Akhila Rajamurthi MARG INSTITUTE OF DESIGN AND ARCHITECTURE, SWARNABHOOMI (MIDAS), CHENNAI.
Celebrities & Nobodies
A photobook of rarely seen, behind-the-scenes and intimate celebrity pictures of Oprah Winfrey, Bill Clinton, Peyton Manning, Quentin Tarantino, Jimmy Kimmel, Carmelo Anthony, Dennis Miller, Al Gore, Sally Field, Joe Mantegna, Arnold Schwarzenegger, Quincy Jones, Cindy Crawford, Eli Manning, Magic Johnson, Leelee Sobieski, Tony Gwynn, John Elway, Tony Hawk, Seane Corn, Jimmy Carter, Antonio Villaraigosa, Larry King, Farrah Fawcett, Pierce Brosnan, Dennis Franz, John Daly, Kevin Eubanks, Tom Petty, Bruce Springsteen, Maria Shriver, Clarence Clemons, Sid Caesar, Roddy McDowall, Wynona Judd, Matthew Stafford, Joe Pantoliano, Steve Jacques and a bunch of nobodies like me and you. GregoryMancuso.com
Greg Gifford — Ricky Bobby's Guide to Winning at Local Link Building in 2021 ...
These slides were presented at the Semrush webinar "Ricky Bobby's Guide to Winning at Local Link Building in 2021 | 5 Hours of Local SEO". Video replay and transcript are available at https://www.semrush.com/webinars/ricky-bobby-s-guide-to-winning-at-local-link-buiding-in-2021-or-5-hours-of-local-seo/
ANB Promotions Ltd - Asian Admin R&R Conference, Thailand & Singapore
The document is a 76 line text file containing only line break characters. It does not contain any words or meaningful information. In 3 sentences or less:
The file is a 76 line text document that contains only line break characters and no words or substantive content. It consists solely of blank lines without any informative or descriptive text.
diabetes care education managment Information by diabetesasia.org
diabetes care education managment Information by diabetesasia.orgJain hospital,Mahavir Sikshan Sansthan
Our aim is to alleviate human suffering related to diabetes and its complications among those least able to withstand the burden of the disease. From 2002 to March 2017, the World Diabetes Foundation provided USD 130 million in funding to 511 projects in 115 countries. For every dollar spent, the Foundation raises approximately 2 dollars in cash or as in-kind donations from other sources. The total value of the WDF project portfolio reached USD 377 million, excluding WDF’s own advocacy and strategic platforms."Missa Brevis in Memoriam W. A. Mozart" composed by Zsolt Srajber
Movements:
1) Kyrie – Allegro
2) Gloria - Grandioso allegretto, Giocoso, Maestoso, Agitato
3) Sanctus - Maestoso con moto
4) Benedictus - Dolce grazioso
5) Agnus - Lento religioso patetico
My work was written to provide a good and nice quality short mass for semi-professional choirs accompanied by only 5 professional instrumentalists. Church choirs celebrating a feast day do not need to resort to the same, few, short masses by Haydn, Mozart, and Schubert but gives an alternative piece that combines the styles of each and opening up heaven with the almost impressionist style in the last Agnus Dei. Extraordinary joy, happiness, contrasts, and grandeur characterizes the first three movements, while serious meditative drama characterizes the last "Agnus Dei". Agnus Dei still fits the glory of a happy feast elevating the listener up to heaven but is also appropriate music to be played at a funeral. Thank you for looking at it, please write to zsrajber@gmail.com or call 36-30-769-5432 if questions. Zsolt Srajber
Lifelong Memories Issue 3
Mr KEY opines, "A man is marked by his ability to monitor and judge his logic and decision to act one way or another. Or by his ability to monitor and control his emotions from being swayed." Read on to gain an insight into this man's philosophy - a legacy of Karnika E. Yashwant's profound thoughts chronicled in these pages.
Las ocho áreas de oportunidad para crecer en los clubes/Eight Areas of Opport...
Las ocho áreas de oportunidad para crecer en los clubes/Eight Areas of Opport...Rotary International
The document outlines the history and development of a small town located along a river. It describes how the town started as a trading post in the early 1800s and gradually grew as more settlers moved into the area. Over the decades, the town established churches, schools, and local businesses to serve the growing agricultural community. It remains a close-knit rural town today, though many residents now commute to larger cities for work.The Artof Purim2010
THE ART OF PURIM celebrates the foiled attempt to kill all the Jews of the Persian Empire in the 5th c., BCE. The Book of Esther relates the story and is read today from a scroll called “The Megillah.” It is the only book of the Hebrew Bible that does not include the name of God. THE ART OF PURIM has wall paintings from the 3rd c., CE and includes illuminated manuscripts, groggers, and contemporary artworks.
150 Great Marketers to Follow in '15
See the full, written list here! bit.ly/likeable150
Happy 2015! Here's to a making it the most #likeable year yet. Want to know what I love most about Twitter? The people. Reading tweets from my favorite thought leaders gives me such inspiration. That's why I'm thrilled to announce 2015's Top 150 thought leaders to follow on Twitter. Follow these 150 and get the latest from their savvy tweeting.
Follow this list (bit.ly/twitter150) to keep up with all 150 thought-leading marketers in one place.
Carbohydrate metabolism, Biological oxidation, Biochemistry unit 2 b pharm
Carbohydrate metabolism
Glycolysis – Pathway, energetics and significance
Citric acid cycle- Pathway, energetics and significance
HMP shunt and its significance; Glucose-6-Phosphate dehydrogenase
(G6PD) deficiency
Glycogen metabolism Pathways and glycogen storage diseases (GSD)
Gluconeogenesis- Pathway and its significance
Hormonal regulation of blood glucose level and Diabetes mellitus Biological oxidation
Electron transport chain (ETC) and its mechanism.
Oxidative phosphorylation & its mechanism and substrate
phosphorylation
Inhibitors ETC and oxidative phosphorylation/Uncouples
Commodity market tips its trading strategies
Trifid Research is a share market advisory company in the Indian financial market. It has provided 2 days free trial in all segments such as stock, commodity & currency market with top suggestion & tips. This is very useful and reliable for all traders and investors.
Basic principles of Cell injury and Adaptation, Basic mechanism involved in t...
The document discusses the history and evolution of the internet over the past 50 years, from its origins as a US military program called ARPANET in the 1960s to connect government researchers, to its commercialization and widespread adoption by consumers in the 1990s and 2000s. It describes some of the key developments that enabled the internet to become a global network, including the creation of TCP/IP protocols, the introduction of web browsers, and the establishment of commercial internet service providers. The document concludes by noting that while the internet has transformed society and business, many challenges remain regarding privacy, security, regulation, and equal access.
Ritesh kumar wedding album pdf (1 52)- Candid wedding photography in Bhubane...
The document discusses the history and development of the internet over the past 50 years, from its origins as a US military program called ARPANET in the late 1960s to connect government researchers, to its commercialization and widespread adoption in the 1990s which introduced web browsers and popularized access. It then covers the major technological advances from the 2000s onward that drove further internet growth such as new connection technologies, mobile internet access via smartphones and tablets, social media platforms, and cloud computing services which store and process data on remote servers.
How to choose the ring size - Beaprincess.com
The document instructs the reader to choose a ring that fits themselves or the intended recipient and place it over the circles shown, matching the outside of the ring to the inside of one of the circles to determine ring size.
Img 5 corr
The document is illegible and contains random symbols with no discernible meaning or structure. It is not possible to provide a meaningful summary.
Cartilha_Agrotoxico
Este documento fornece informações sobre produtos orgânicos para consumidores, explicando como identificar se um produto é verdadeiramente orgânico de acordo com as novas regras estabelecidas pelo governo brasileiro. Em três frases: O documento explica as regras para a produção e identificação de produtos orgânicos no Brasil; estabelece um novo selo nacional para produtos orgânicos certificados; e enfatiza a importância dos consumidores fiscalizarem o cumprimento destas regras.
Sistema operacional solaris
O Solaris é um sistema operacional do tipo Unix desenvolvido pela Oracle, originalmente pela Sun Microsystems. Ele oferece recursos avançados como gerenciamento de processos, memória e arquivos, além de ferramentas para análise e resolução de problemas de desempenho e atualizações automáticas.
Solaris
Solaris es un sistema operativo de tipo Unix desarrollado inicialmente por Sun Microsystems que funciona en arquitecturas SPARC y x86. Versiones recientes como Solaris 10 incluyen características como Predictive Self-Healing para prevenir errores y Process Rights Management para mejorar la seguridad asignando privilegios mínimos a procesos. El código fuente de Solaris se ha liberado como software libre bajo el nombre OpenSolaris.
Solaris - SO-Sun
O documento discute o sistema operacional Solaris, incluindo sua origem a partir do Unix, recursos avançados como atualizações inteligentes e prevenção de falhas, e como ele controla processos, memória, entrada/saída e fornece segurança.
Integrantes
Here are some ways we could help drug addicts in Marinilla and solve their problems:
1. Conduct outreach to identify drug addicts and understand their situations and what led them to drug use. Build trust and relationships.
2. Provide treatment and rehabilitation programs with medical and psychological support to help them overcome addiction. This could include detox, counseling, support groups, job training.
3. Educate youth about the dangers of drugs to prevent future addiction. Promote healthy activities as alternatives.
4. Address root causes like poverty, mental health issues, trauma that may have contributed to drug use. Provide social services and support.
5. Partner with local organizations and health authorities to set up
R uta de investigacion
El documento describe los pasos del proceso de investigación para la conformación de 8 equipos de trabajo. Los equipos seleccionarán 5 problemas de una lista de 40 opciones utilizando 5 criterios como factibilidad, costo e innovación. Luego refinarán una pregunta de investigación y diseñarán un proyecto para desarrollar una solución tecnológica al problema seleccionado, la cual presentarán en eventos científicos.
Taller # 3
El resumen describe un equipo de estudiantes de grado 7F del año 2012 en la asignatura de Alba Giraldo y Francisca Raquel. El equipo #5 está compuesto por Juan David Cortes Amador, Angie Milena Giraldo Duque, Juan Pablo Marín Castaño, Daniel Vallejo Munera y Daniel Alexander Zuluaga.
Taller # 3
El resumen describe un equipo de estudiantes de grado 7F del año 2012 en la asignatura de las profesoras Alba Giraldo y Francisca Raquel. El equipo #5 está compuesto por los estudiantes Juan David Cortes Amador, Angie Milena Giraldo Duque, Juan Pablo Marín Castaño, Daniel Vallejo Munera y Daniel Alexander Zuluaga.
Taller # 3
El resumen describe un equipo de estudiantes de grado 7F del año 2012 en la asignatura de Alba Giraldo y Francisca Raquel. El equipo #5 está compuesto por Juan David Cortes Amador, Angie Milena Giraldo Duque, Juan Pablo Marín Castaño, Daniel Vallejo Munera y Daniel Alexander Zuluaga.
Investigacion
Este documento presenta la información básica de Juan David Cortes Amador, un estudiante de grado 7F en el colegio I.E.T.I. Simona Duque en el año 2012, bajo la dirección de los profesores Alba Inés Giraldo y Jairo Miranda.
More Related Content
What's hot
Lifelong Memories Issue 3
Mr KEY opines, "A man is marked by his ability to monitor and judge his logic and decision to act one way or another. Or by his ability to monitor and control his emotions from being swayed." Read on to gain an insight into this man's philosophy - a legacy of Karnika E. Yashwant's profound thoughts chronicled in these pages.
Las ocho áreas de oportunidad para crecer en los clubes/Eight Areas of Opport...
Las ocho áreas de oportunidad para crecer en los clubes/Eight Areas of Opport...Rotary International
The document outlines the history and development of a small town located along a river. It describes how the town started as a trading post in the early 1800s and gradually grew as more settlers moved into the area. Over the decades, the town established churches, schools, and local businesses to serve the growing agricultural community. It remains a close-knit rural town today, though many residents now commute to larger cities for work.The Artof Purim2010
THE ART OF PURIM celebrates the foiled attempt to kill all the Jews of the Persian Empire in the 5th c., BCE. The Book of Esther relates the story and is read today from a scroll called “The Megillah.” It is the only book of the Hebrew Bible that does not include the name of God. THE ART OF PURIM has wall paintings from the 3rd c., CE and includes illuminated manuscripts, groggers, and contemporary artworks.
150 Great Marketers to Follow in '15
See the full, written list here! bit.ly/likeable150
Happy 2015! Here's to a making it the most #likeable year yet. Want to know what I love most about Twitter? The people. Reading tweets from my favorite thought leaders gives me such inspiration. That's why I'm thrilled to announce 2015's Top 150 thought leaders to follow on Twitter. Follow these 150 and get the latest from their savvy tweeting.
Follow this list (bit.ly/twitter150) to keep up with all 150 thought-leading marketers in one place.
Carbohydrate metabolism, Biological oxidation, Biochemistry unit 2 b pharm
Carbohydrate metabolism
Glycolysis – Pathway, energetics and significance
Citric acid cycle- Pathway, energetics and significance
HMP shunt and its significance; Glucose-6-Phosphate dehydrogenase
(G6PD) deficiency
Glycogen metabolism Pathways and glycogen storage diseases (GSD)
Gluconeogenesis- Pathway and its significance
Hormonal regulation of blood glucose level and Diabetes mellitus Biological oxidation
Electron transport chain (ETC) and its mechanism.
Oxidative phosphorylation & its mechanism and substrate
phosphorylation
Inhibitors ETC and oxidative phosphorylation/Uncouples
Commodity market tips its trading strategies
Trifid Research is a share market advisory company in the Indian financial market. It has provided 2 days free trial in all segments such as stock, commodity & currency market with top suggestion & tips. This is very useful and reliable for all traders and investors.
Basic principles of Cell injury and Adaptation, Basic mechanism involved in t...
The document discusses the history and evolution of the internet over the past 50 years, from its origins as a US military program called ARPANET in the 1960s to connect government researchers, to its commercialization and widespread adoption by consumers in the 1990s and 2000s. It describes some of the key developments that enabled the internet to become a global network, including the creation of TCP/IP protocols, the introduction of web browsers, and the establishment of commercial internet service providers. The document concludes by noting that while the internet has transformed society and business, many challenges remain regarding privacy, security, regulation, and equal access.
Ritesh kumar wedding album pdf (1 52)- Candid wedding photography in Bhubane...
The document discusses the history and development of the internet over the past 50 years, from its origins as a US military program called ARPANET in the late 1960s to connect government researchers, to its commercialization and widespread adoption in the 1990s which introduced web browsers and popularized access. It then covers the major technological advances from the 2000s onward that drove further internet growth such as new connection technologies, mobile internet access via smartphones and tablets, social media platforms, and cloud computing services which store and process data on remote servers.
How to choose the ring size - Beaprincess.com
The document instructs the reader to choose a ring that fits themselves or the intended recipient and place it over the circles shown, matching the outside of the ring to the inside of one of the circles to determine ring size.
What's hot (9)
Las ocho áreas de oportunidad para crecer en los clubes/Eight Areas of Opport...
Las ocho áreas de oportunidad para crecer en los clubes/Eight Areas of Opport...
Carbohydrate metabolism, Biological oxidation, Biochemistry unit 2 b pharm
Carbohydrate metabolism, Biological oxidation, Biochemistry unit 2 b pharm
Basic principles of Cell injury and Adaptation, Basic mechanism involved in t...
Basic principles of Cell injury and Adaptation, Basic mechanism involved in t...
Ritesh kumar wedding album pdf (1 52)- Candid wedding photography in Bhubane...
Ritesh kumar wedding album pdf (1 52)- Candid wedding photography in Bhubane...
Viewers also liked
Img 5 corr
The document is illegible and contains random symbols with no discernible meaning or structure. It is not possible to provide a meaningful summary.
Cartilha_Agrotoxico
Este documento fornece informações sobre produtos orgânicos para consumidores, explicando como identificar se um produto é verdadeiramente orgânico de acordo com as novas regras estabelecidas pelo governo brasileiro. Em três frases: O documento explica as regras para a produção e identificação de produtos orgânicos no Brasil; estabelece um novo selo nacional para produtos orgânicos certificados; e enfatiza a importância dos consumidores fiscalizarem o cumprimento destas regras.
Sistema operacional solaris
O Solaris é um sistema operacional do tipo Unix desenvolvido pela Oracle, originalmente pela Sun Microsystems. Ele oferece recursos avançados como gerenciamento de processos, memória e arquivos, além de ferramentas para análise e resolução de problemas de desempenho e atualizações automáticas.
Solaris
Solaris es un sistema operativo de tipo Unix desarrollado inicialmente por Sun Microsystems que funciona en arquitecturas SPARC y x86. Versiones recientes como Solaris 10 incluyen características como Predictive Self-Healing para prevenir errores y Process Rights Management para mejorar la seguridad asignando privilegios mínimos a procesos. El código fuente de Solaris se ha liberado como software libre bajo el nombre OpenSolaris.
Solaris - SO-Sun
O documento discute o sistema operacional Solaris, incluindo sua origem a partir do Unix, recursos avançados como atualizações inteligentes e prevenção de falhas, e como ele controla processos, memória, entrada/saída e fornece segurança.
Viewers also liked (7)
More from Juandi652
Integrantes
Here are some ways we could help drug addicts in Marinilla and solve their problems:
1. Conduct outreach to identify drug addicts and understand their situations and what led them to drug use. Build trust and relationships.
2. Provide treatment and rehabilitation programs with medical and psychological support to help them overcome addiction. This could include detox, counseling, support groups, job training.
3. Educate youth about the dangers of drugs to prevent future addiction. Promote healthy activities as alternatives.
4. Address root causes like poverty, mental health issues, trauma that may have contributed to drug use. Provide social services and support.
5. Partner with local organizations and health authorities to set up
R uta de investigacion
El documento describe los pasos del proceso de investigación para la conformación de 8 equipos de trabajo. Los equipos seleccionarán 5 problemas de una lista de 40 opciones utilizando 5 criterios como factibilidad, costo e innovación. Luego refinarán una pregunta de investigación y diseñarán un proyecto para desarrollar una solución tecnológica al problema seleccionado, la cual presentarán en eventos científicos.
Taller # 3
El resumen describe un equipo de estudiantes de grado 7F del año 2012 en la asignatura de Alba Giraldo y Francisca Raquel. El equipo #5 está compuesto por Juan David Cortes Amador, Angie Milena Giraldo Duque, Juan Pablo Marín Castaño, Daniel Vallejo Munera y Daniel Alexander Zuluaga.
Taller # 3
El resumen describe un equipo de estudiantes de grado 7F del año 2012 en la asignatura de las profesoras Alba Giraldo y Francisca Raquel. El equipo #5 está compuesto por los estudiantes Juan David Cortes Amador, Angie Milena Giraldo Duque, Juan Pablo Marín Castaño, Daniel Vallejo Munera y Daniel Alexander Zuluaga.
Taller # 3
El resumen describe un equipo de estudiantes de grado 7F del año 2012 en la asignatura de Alba Giraldo y Francisca Raquel. El equipo #5 está compuesto por Juan David Cortes Amador, Angie Milena Giraldo Duque, Juan Pablo Marín Castaño, Daniel Vallejo Munera y Daniel Alexander Zuluaga.
Investigacion
Este documento presenta la información básica de Juan David Cortes Amador, un estudiante de grado 7F en el colegio I.E.T.I. Simona Duque en el año 2012, bajo la dirección de los profesores Alba Inés Giraldo y Jairo Miranda.
Preguntas de investigacion 7f
Este documento contiene 40 preguntas de investigación relacionadas con temas ambientales como la conservación del planeta, vehículos contaminantes, energías renovables, reciclaje, sobrepoblación, agotamiento de recursos y su impacto en la salud y el medio ambiente. Cada pregunta fue evaluada en cinco categorías como factibilidad, costo, tiempo, innovación y solución para asignarle una puntuación total.
More from Juandi652 (7)
Doc1
- 1. 70 60 50 40 30 Series1 20 10 0 1 3 5 7 9 11 13 15 17 19 21 23 25 27 29 31 33 35 37 39