This document is a dissertation submitted by Jeetendra Narayan Dash to Columbia Southern University in partial fulfillment of the requirements for a Doctorate of Business Administration degree. The dissertation examines the potential impact of the Affordable Care Act on retail employees in the Southern United States migrating from employer-sponsored health insurance to the ACA marketplace. Dash conducted a survey of 203 front-line retail executives in the Southern US to determine if and to what degree migration would occur. The survey found that age, ethnicity, and annual household income were somewhat likely to influence an employee's decision to migrate, but no variables were a significant factor in modeling the relationship. Most employees still valued employer-based coverage and lacked a clear understanding of the A


![1
Chapter 1: Introduction to the Current Study
An Overview of the Topic
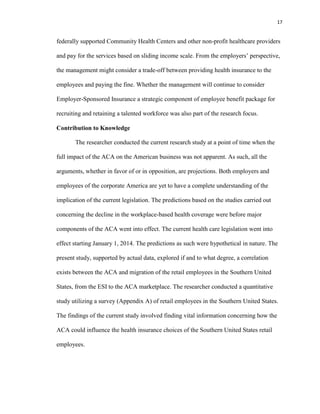
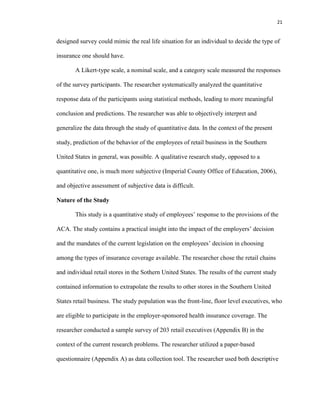
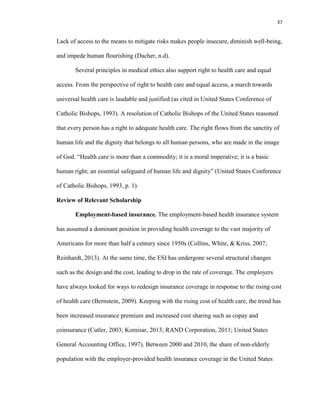
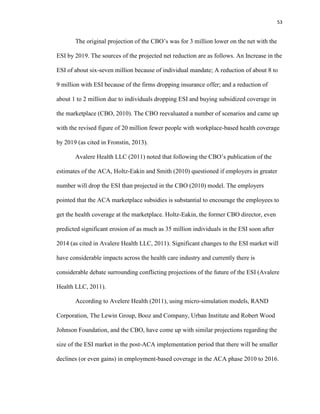
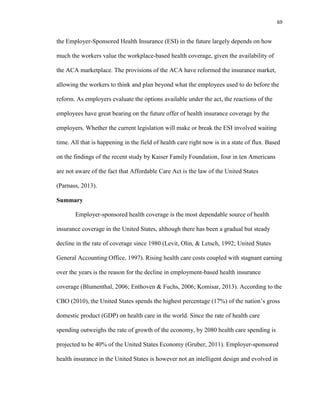
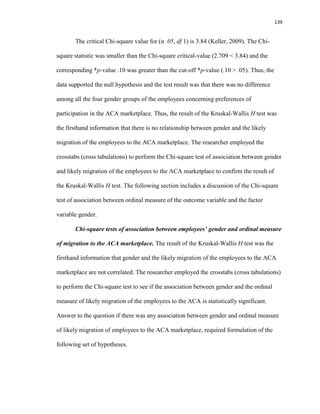
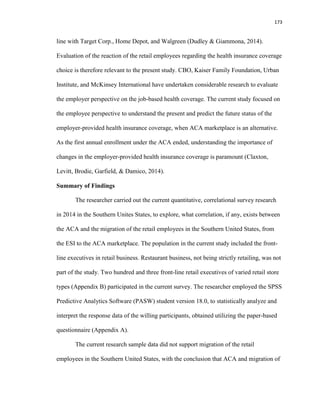
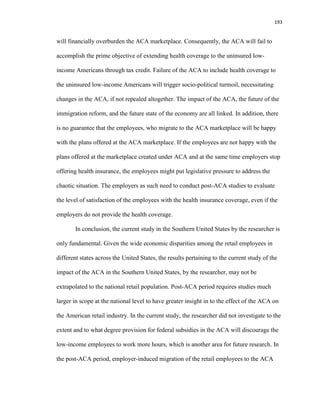
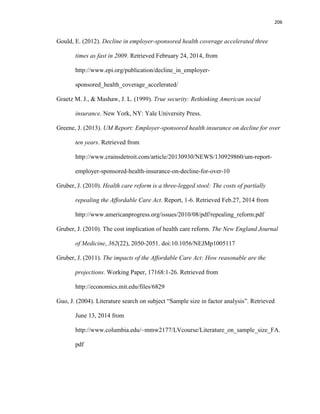
President Barrack Obama signed the Patient Protection and Affordable Care Act
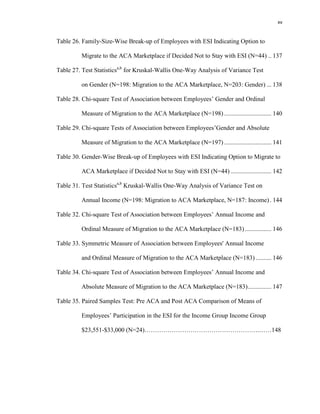
(PPACA), commonly known as the Affordable Care Act (ACA), into law in March 2010.
The goal of the current piece of legislation is to improve the health care system of the
nation by extending the health insurance coverage to millions of uninsured Americans.
The provisions of the act include incentives, which will influence the decisions of the
employers and the employees regarding the health coverage benefits. According to the
Congressional Budget Office (CBO):
there is clearly a tremendous amount of uncertainty about how employers and
employees will respond to the set of opportunities and incentives under [the
ACA]… there is uncertainty regarding many other factors, including the future
growth rate of private insurance premiums and the number of individuals and
families who will have income in the eligibility ranges for Medicaid, CHIP, and
marketplace subsidies. Moreover, the models … are generally based on observed
changes in behavior in response to modest changes in incentives, but the
legislation enacted in 2010 is sweeping in its nature. (as cited in Schoenman,
2013, p. 10)
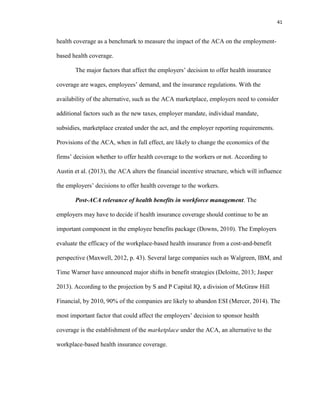
According to the CBO and the Joint Committee on Taxation (JCT) estimate, the ACA
could lower federal budget deficit by $143 billion between 2010 and 2019 (Lambrew,
2012) and save about $1 trillion between 2020 and 2029 (Waldron, 2012). The current
legislation is also likely to affect the way the employers manage the health care benefits
of the employees, and eventually, the organizational cost structure.](https://image.slidesharecdn.com/dissertationmanuscriptjeetendradash-150401112314-conversion-gate01/85/Dissertation-manuscript-jeetendra-dash-20-320.jpg)
![94
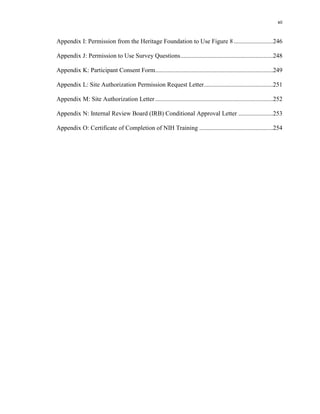
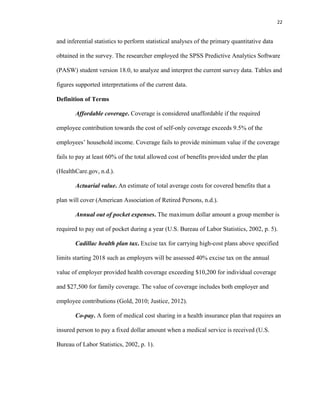
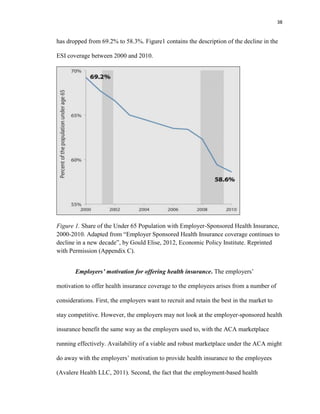
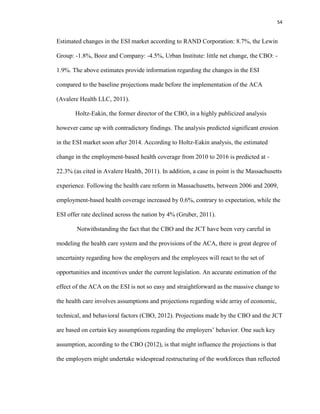
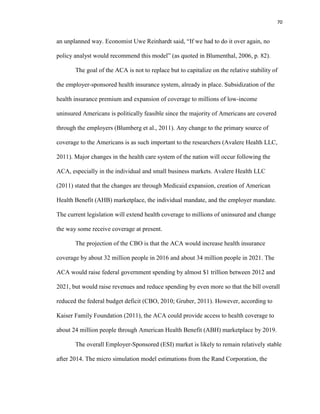
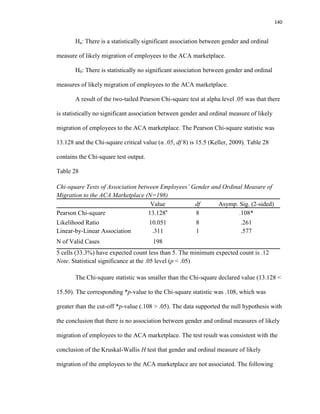
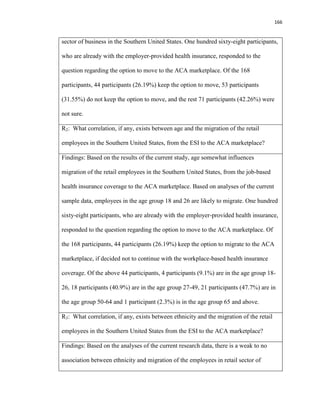
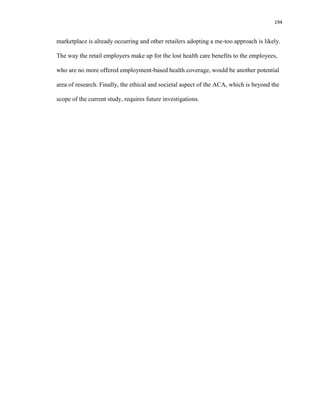
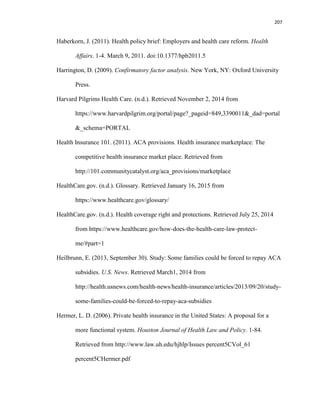
statistically insignificant, it means the ACA does not change the preferences of the
employees to participate in the employer-provided health insurance, with the conclusion
that there is no correlation between the ACA and the decision of the employees to move
out of the workplace insurance plan and migrate to the ACA marketplace to buy
alternative form of health coverage.
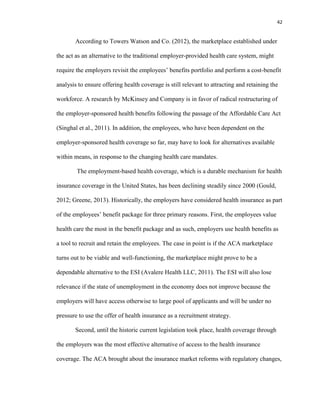
In order to formulate the null and alternative hypotheses, the two statistics were
µ1 and µ2. µ1 represents the mean value of the sum total of the employees’ responses to
the health coverage at the workplace without the implementation of the ACA and µ2
represents the mean value of the employees’ responses to the health coverage at the
workplace with the implementation of the ACA.
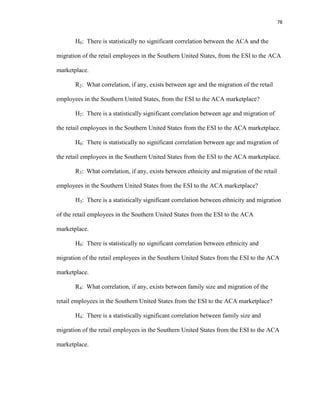
Of all the survey questions to which the researcher solicited responses of the
participants, responses to the current survey questions SQ10 and SQ11 (Appendix A)
were relevant to testing the hypotheses relating to the Research Question 1.
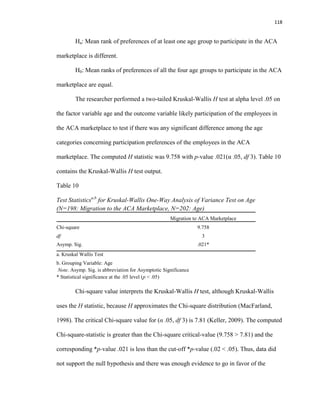
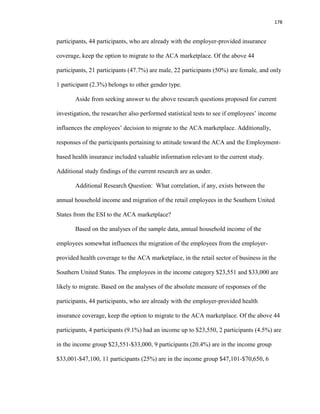
Question 10: If ACA were not available to you, how likely are you to participate
in your workplace-based health care plan?
[ ] Least likely
[ ] Somewhat likely
[ ] Likely
[ ] Very Likely
[ ] Most likely
Question 11: Now that ACA plans are available, how likely are you to participate
in your employer-sponsored healthcare plan?
[ ] Least likely](https://image.slidesharecdn.com/dissertationmanuscriptjeetendradash-150401112314-conversion-gate01/85/Dissertation-manuscript-jeetendra-dash-113-320.jpg)
![95
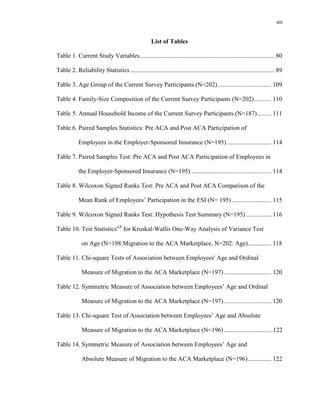
[ ] Somewhat likely
[ ] Likely
[ ] Very Likely
[ ] Most likely
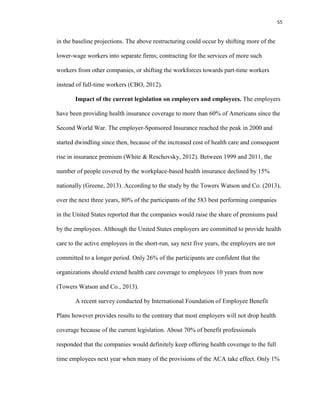
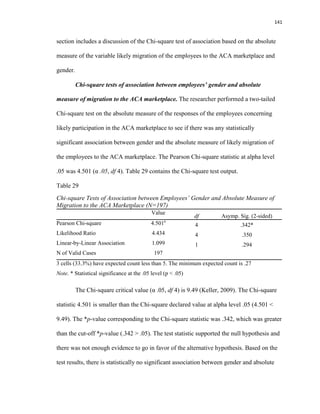
Current survey questions such as SQ10 and SQ11 in questionnaire (Appendix A)
operationalized employees’ attitude toward workplace-based health coverage, without
and with the ACA alternative, on a five-point measure on a Likert-type rating scale from
least likely to most likely. The sum of the measures on the Likert-type rating scale was
the value of participants’ overall liking. The researcher provided a better picture of
employees’ reaction to the employment-based health coverage, based on the employees’
responses to the questions SQ10 and SQ11, combined with the responses to questions
SQ12 and SQ24.
The value assigned to the responses to the above two survey questions SQ10 and
SQ11 ranged between 1 and 5, with value 1 being the response least likely and value 5
being the response most likely. The researcher statistically analyzed the difference in
mean value of the employees’ response to see if there is statistically any significant
difference between the mean responses of the group exposed to two different scenarios:
Pre-ACA and post-ACA reaction of the employees to the employer-provided health
insurance coverage. The researcher performed a paired t-test at alpha (α) level 0.05 (two-
tailed) on the collected numeric data utilizing the SPSS Predictive Analytics Software
(PASW) Student Version 18.0. Comparison of the computed t-statistic with the critical t-
value and the corresponding *p-value was answer to if there was enough evidence to
reject the null hypothesis in favor of the alternative hypothesis (Keller, 2009, p. 355).](https://image.slidesharecdn.com/dissertationmanuscriptjeetendradash-150401112314-conversion-gate01/85/Dissertation-manuscript-jeetendra-dash-114-320.jpg)
![97
employees in the Southern United States from the ESI to the ACA marketplace. On the
contrary, if there was not enough evidence to reject the null hypothesis in favor of the
alternative hypothesis, the conclusion would be the ACA has changed the preferences of
the retail employees in the Southern United States in the ESI. The conclusion in the
above case would be there is a correlation between the ACA and the migration of the
retail employees in the Southern United States from the ESI to the ACA marketplace.
In the event the data did not support the null hypothesis and there was evidence to
the contrary, a genuine research question would be whether the employees not accepting
the workplace-based health coverage, are signing up in the ACA marketplace as
expected. In case there was rejection of the null hypothesis pertaining to Research
Question 1, the researcher formulated another set of hypotheses to find answer to the
question whether the employees not accepting the workplace-based health coverage are
signing up in the ACA marketplace, as is the expectation. The proposed second set of
hypotheses was as under.
Ha: Some employees will decide not to have any type of health coverage.
H0: The employees will decide to have some type of health coverage.
The researcher analyzed the absolute response of the employees to the survey
question SQ12 in the questionnaire to test the second set of hypotheses for statistical
significance of the employees’ response if there was rejection of the null hypothesis in
Research Question 1.
Question 12: If you decide not to accept your health coverage at the workplace,
will you buy coverage in the ACA exchange?
[ ] Yes](https://image.slidesharecdn.com/dissertationmanuscriptjeetendradash-150401112314-conversion-gate01/85/Dissertation-manuscript-jeetendra-dash-116-320.jpg)
![98
[ ] No
[ ] Not sure
There are a few other possibilities for employees, who may not get coverage at
the workplace. First, the employees might decide to buy the health insurance coverage
independently in the exchange established under the ACA or the employees might decide
to visit the federally approved community center or charitable health care organizations
for care and pay on a sliding income scale. The researcher analyzed the responses of the
participants to the survey question SQ13 in the questionnaire to present the available
options and the proportion of employees deciding to go with different types of health care
options.
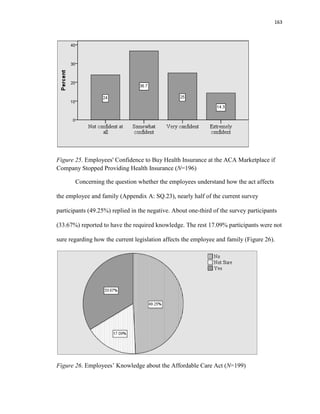
Question 13: What is your preference about health insurance coverage?
[ ] Continue with the health insurance offered at the workplace
[ ] Buy my own independently at the exchange
[ ] Not have health insurance at all and pay the penalty, as required.
[ ] Visit community or charitable health centers and pay my part on a sliding income
scale
Employees’ response to the current survey contained data to test the hypotheses
concerning the present research and to take insight into the employees’ reaction toward
the employment-based health insurance coverage and the Affordable Care Act. The
researcher employed the Statistical Package for the Social Sciences (SPSS) Predictive
Analytics Software (PASW) student version 18.0, to perform appropriate descriptive
statistics on the data, for data analysis and data interpretation. Additionally, tables and
figures supported the data interpretations. Keller (2009) stated, “Descriptive statistics](https://image.slidesharecdn.com/dissertationmanuscriptjeetendradash-150401112314-conversion-gate01/85/Dissertation-manuscript-jeetendra-dash-117-320.jpg)

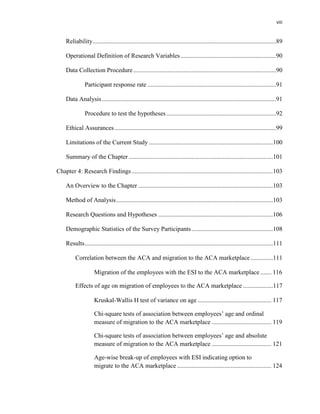
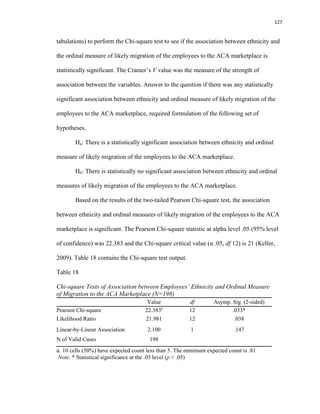
![123
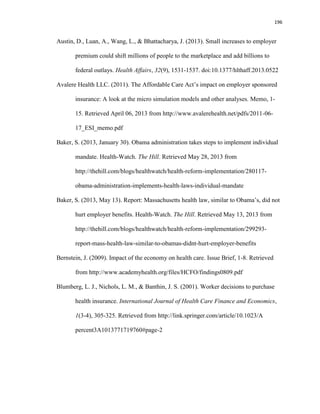
employees is consistent with the results of the Kruskal-Wallis H test of variance and the
Chi-square test of association based on the ordinal measure of the responses of the
employees. Thus, the conclusion is that age and likely migration of the employees to the
ACA marketplace are somewhat correlated.
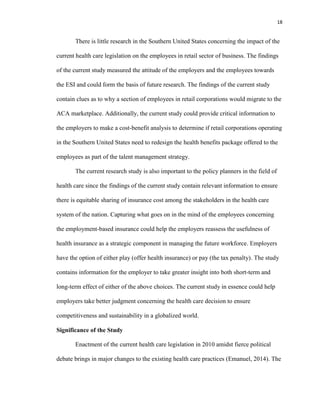
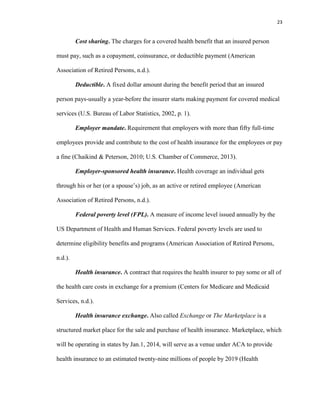
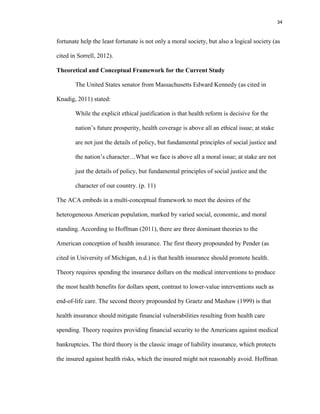
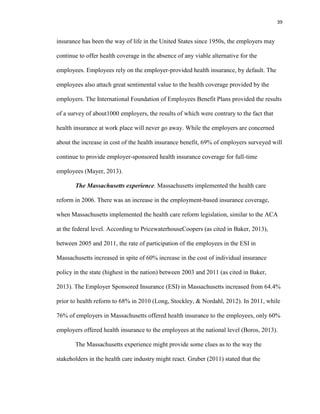
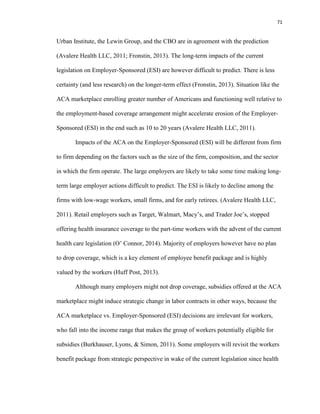
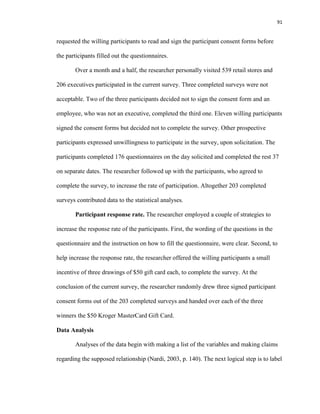
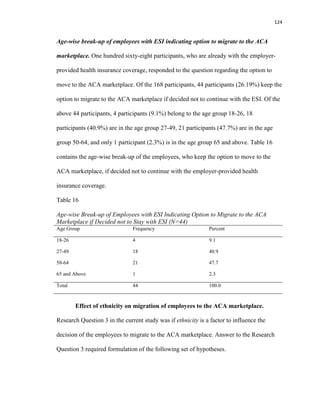
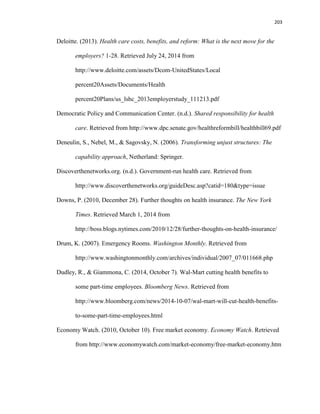
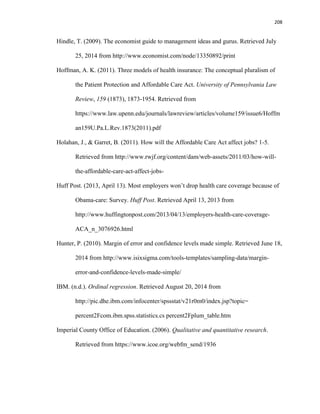
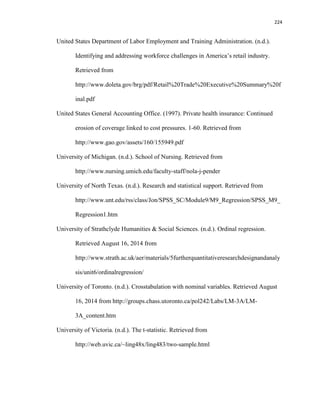
After statistical analyses confirmed that age and likely migration of the employees
to the ACA marketplace, are correlated, the researcher performed further statistical tests
to see whether all age groups are correlated with the likely migration of the employees to
the ACA marketplace. The age group 65 and over is not eligible to participate in the
ACA marketplace, thus not relevant to the analysis. Based on the results of the ordinal
regression analysis between the ordinal measures of likely migration of the employees to
the ACA marketplace with age as a factor, not considering the age group 65, only the age
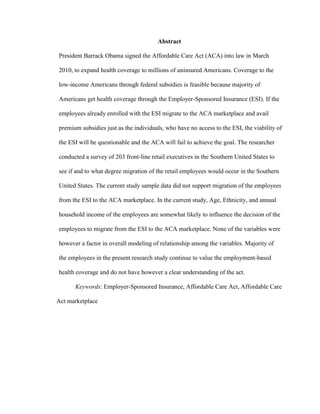
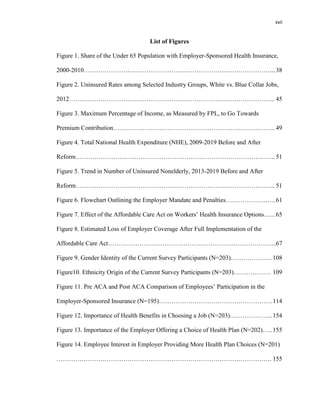
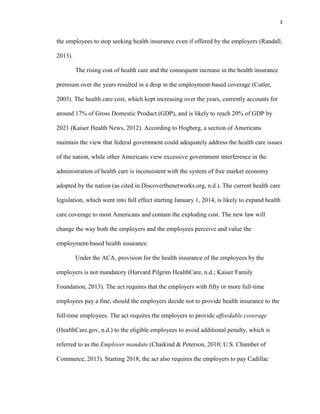
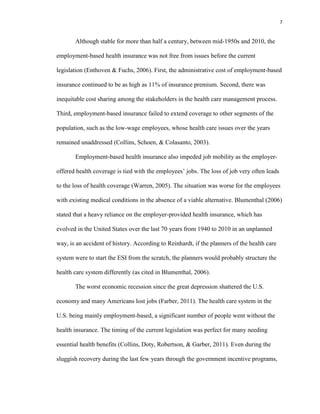
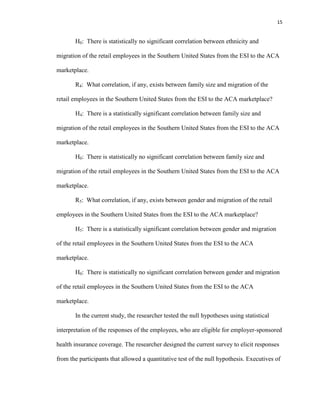
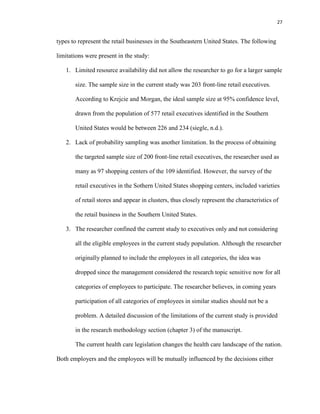
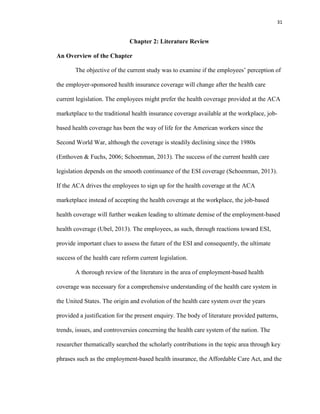
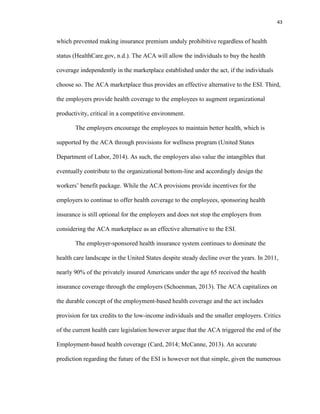
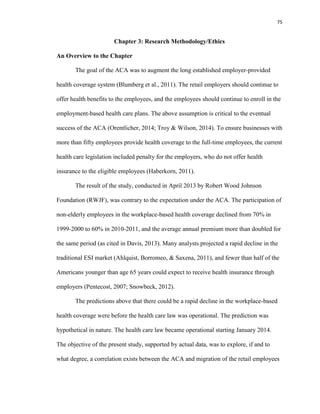
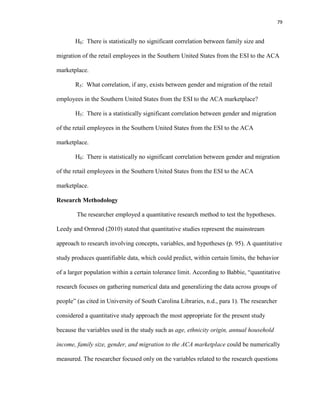
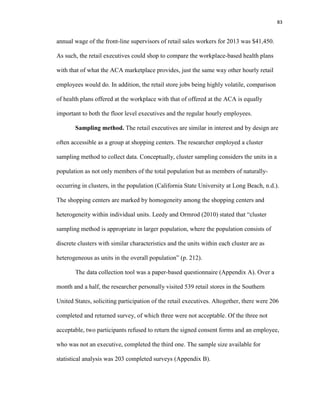
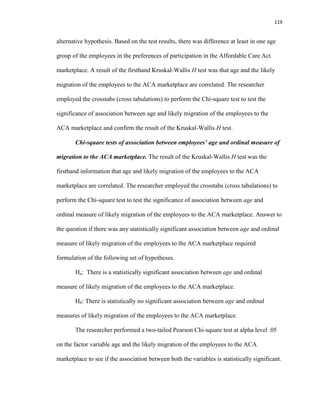
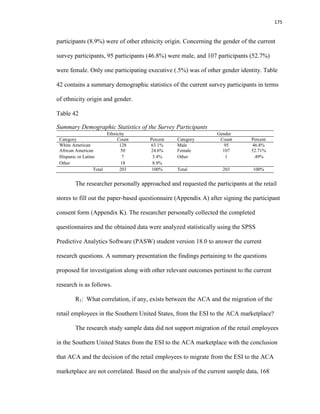
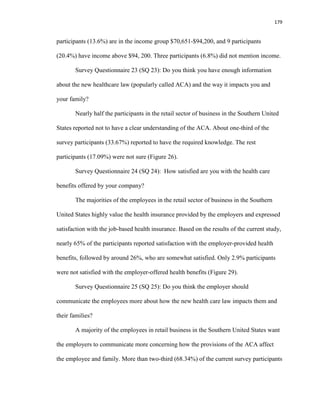
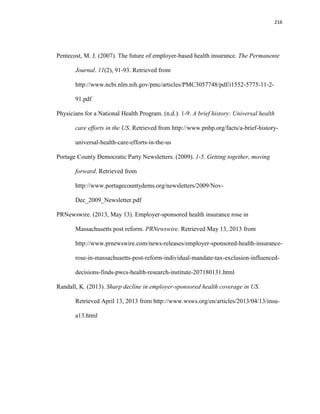
group 18-26 is likely to migrate to the ACA marketplace. Table 15 contains the PLUM
ordinal regression parameter estimates output.
Table 15
Parameter Estimates of the coefficients of the PLUM Ordinal Regression Model:
Employees’ Age and Migration to the ACA Marketplace (N=188)
Estimate
Std.
Error Wald df Sig.
95% Confidence
Interval
Lower
Bound Upper Bound
Threshold [Migration to ACA:
Least likely]
-2.487 .348 51.193 1 .000 -3.168 -1.806
[Migration to ACA:
Somewhat likely]
-1.284 .294 19.032 1 .000 -1.861 -.707
[Migration to ACA:
Likely]
-.351 .279 1.588 1 .208 -.898 .195
[Migration to ACA:
Very likely]
.766 .284 7.269 1 .007 .209 1.323
Location [Age: 18-26] -1.099 .412 7.106 1 .008* -1.907 -.291
[Age: 27-49] -.098 .319 .094 1 .759 -.723 .527
[Age: 50-64] 0a
. . 0 . . .
Link function: Logit.
a. This parameter is set to zero because it is redundant
Note. Parametric estimate of coefficient for the age group 18-26 is significant (.008 < .05)
* Statistical significance at the .05 level (p < .05)](https://image.slidesharecdn.com/dissertationmanuscriptjeetendradash-150401112314-conversion-gate01/85/Dissertation-manuscript-jeetendra-dash-142-320.jpg)
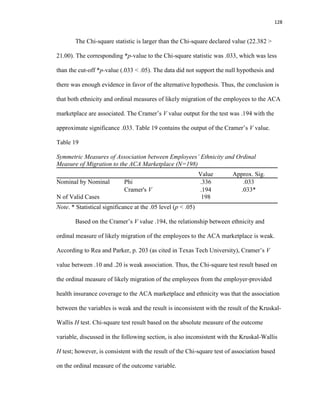
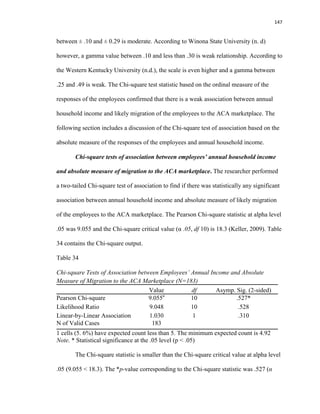
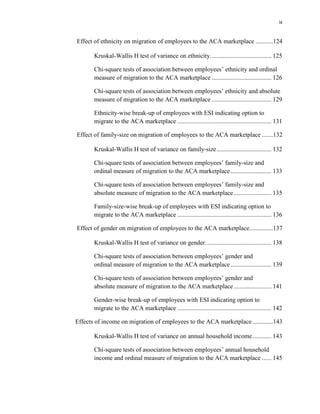
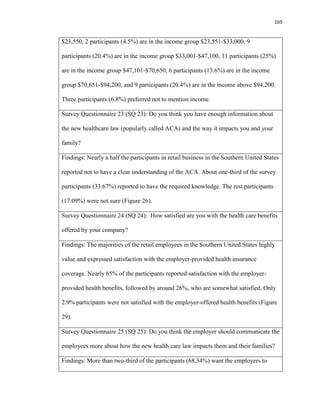
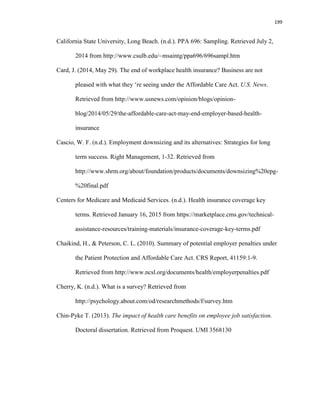
![149
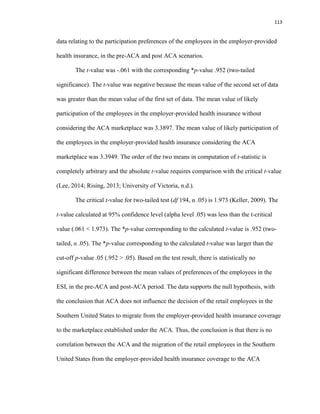
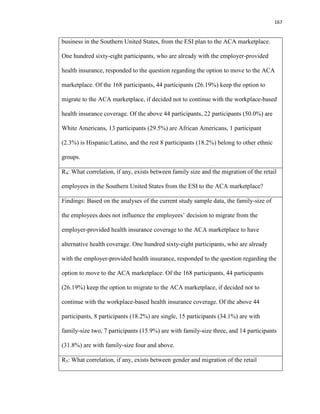
Table 36
Wilcoxon Signed Ranks Test: Pre ACA and Post ACA Comparison of the Mean Rank of
Employees’ Participation in the ESI for the Income Group $23,551-$33,000 (N=24)
Null Hypothesis Test Sig. Decision
The median of
differences between
Pre-ACA responses
and Post-ACA
responses equals 0.
Related-Samples
Wilcoxon Signed
Ranks Test
.021*
Reject the null
hypothesis
Note. * Statistical significance at the .05 level (p < .05)
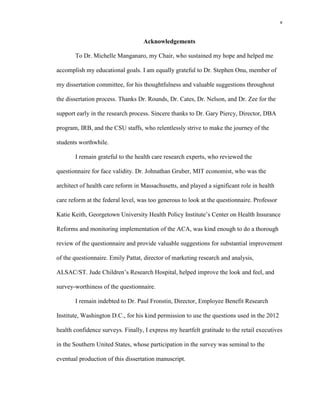
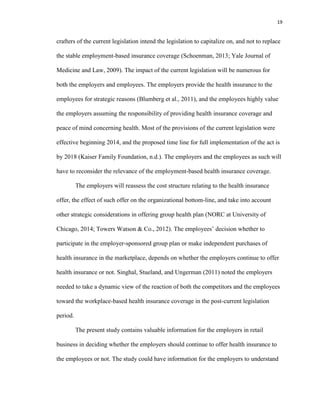
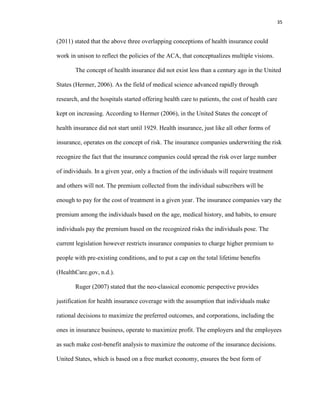
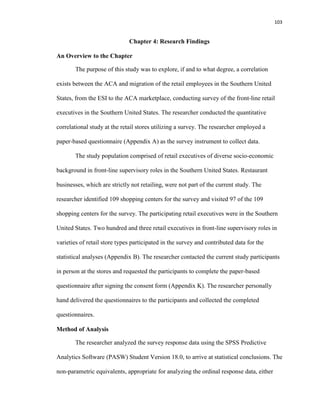
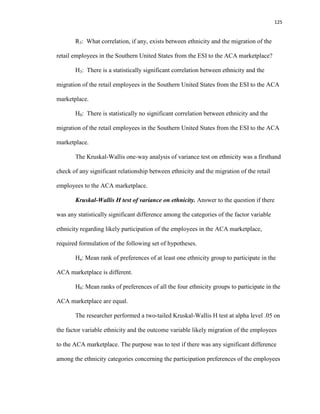
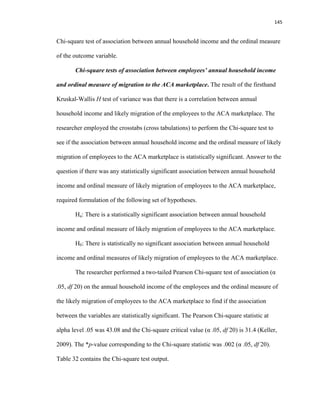
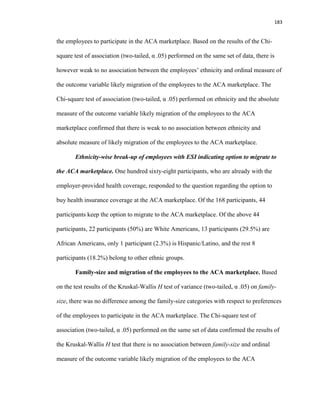
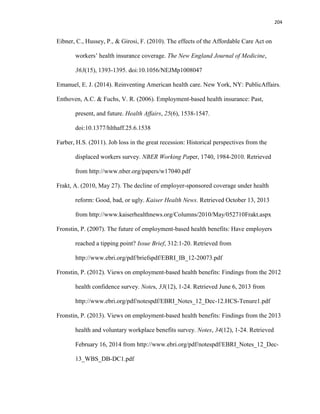
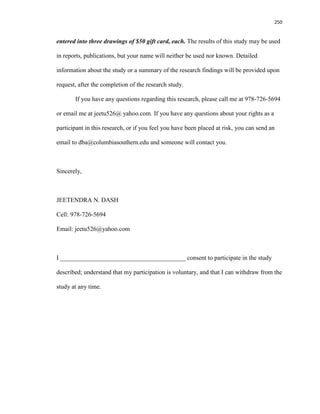
In addition, the Plum ordinal regression analysis with ordinal measure of the
outcome with annual household income as a factor also confirmed that the employees in
the annual household income category $23,551-$33,000 are likely to migrate to the ACA
marketplace. The parametric estimate of the coefficient (α .05, two-tailed) was significant
for the annual household income category $23,551-$33,000 (.010 < .05). Table 37
contains the output for the PLUM ordinal regression parameter estimates.
Table 37
Parameter Estimates of the Coefficients for PLUM Ordinal Regression Model:
Migration to ACA Marketplace and Annual Household Income (N=183)
Estimate
Std.
Error Wald df Sig.
95% Confidence
Interval
Lower
Bound
Upper
Bound
Threshold [Migration to ACA: Least
likely]
-2.658 .389 46.634 1 .000 -3.421 -1.895
[Migration to ACA:
Somewhat likely]
-1.440 .338 18.123 1 .000 -2.103 -.777
[Migration to ACA:
Likely]
-.483 .322 2.253 1 .133 -1.115 .148
[Migration to ACA: Very
likely]
.633 .324 3.820 1 .051 -.002 1.268
Location [Income: $Up to $23,550] -.995 .517 3.712 1 .054 -2.008 .017
[Income: $23,551-$33,000] -1.237 .479 6.661 1 .010* -2.177 -.298
[Income: $33,001-$47,100] -.495 .429 1.332 1 .248 -1.336 .346
[Income: $47,101-$70,650] -.134 .417 .103 1 .749 -.952 .684
[Income:$70.651-$94,200] .217 .469 .214 1 .643 -.702 1.136
[Income: Over $94,200] 0a
. . 0 . . .
Link function: Logit.
a. This parameter is set to zero because it is redundant
Note. Parameter Estimate of the Coefficient for the income group $23,551-$33,000 is significant
* Statistical significance at the .05 level (p < .05)](https://image.slidesharecdn.com/dissertationmanuscriptjeetendradash-150401112314-conversion-gate01/85/Dissertation-manuscript-jeetendra-dash-168-320.jpg)
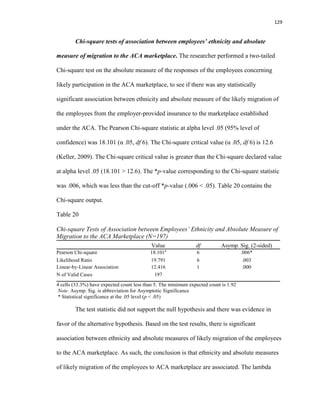
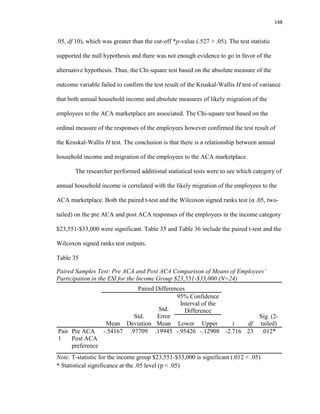
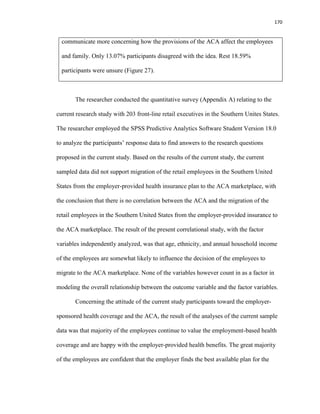
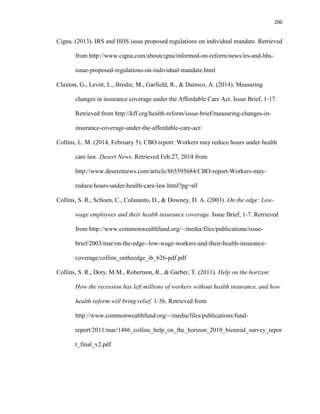
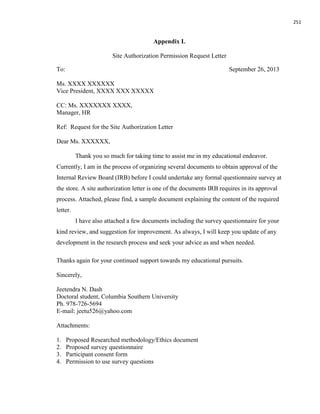
![153
Table 40
Parameter Estimates of the coefficients of PLUM Ordinal Regression Model: Migration
to the ACA Marketplace with Age, Ethnicity, Income, Gender, and Family-Size (N=182)
Estimate
Std.
Error Wald df Sig.
95% Confidence Interval
Lower
Bound
Upper
Bound
Threshold [Migration to ACA = Least
Likely ]
-2.295 .997 5.298 1 .021 -4.250 -.341
[Migration to ACA
=Somewhat Likely]
-1.009 .976 1.068 1 .301 -2.923 .905
[Migration to ACA= Likely] .009 .972 .000 1 .992 -1.897 1.915
[Migration to ACA = Very
Likely]
1.169 .977 1.432 1 .231 -.746 3.084
Location [Age=18-26] -.197 .886 .049 1 .824 -1.934 1.541
[Age=27-49] .534 .817 .427 1 .513 -1.067 2.134
[Age=50-64] .534 .828 .416 1 .519 -1.088 2.156
[Age=65 and Over] 0a
. . 0 . . .
[Ethnicity=White American] -.093 .501 .034 1 .853 -1.075 .889
[Ethnicity=African American] -.443 .530 .699 1 .403 -1.481 .595
[Ethnicity=Hispanic/Latino] -.439 .844 .270 1 .603 -2.092 1.215
[Ethnicity=Other] 0a
. . 0 . . .
[Income= Up to $23,550] -.956 .570 2.810 1 .094 -2.073 .162
[Income= $23,551-$33,000] -.982 .561 3.062 1 .080 -2.082 .118
[Income= $33,001-$47,100] -.597 .479 1.554 1 .212 -1.535 .341
[Income= $47,101-$70,650] -.266 .436 .372 1 .542 -1.121 .589
[Income= $70,651-$94,200] .193 .483 .159 1 .690 -.755 1.140
[Income= Over $94,200] 0a
. . 0 . . .
[Gender=Male] -.155 .286 .293 1 .589 -.716 .406
[Gender=Female] 0a
. . 0 . . .
[Family-size=One] .718 .413 3.024 1 .082 -.091 1.528
[Family-size=Two] .426 .383 1.237 1 .266 -.325 1.176
[Family-size=Three] .552 .417 1.750 1 .186 -.266 1.370
[Family-size=Four] 0a
. . 0 . . .
Link function: Logit.
a. This parameter is set to zero because it is redundant.
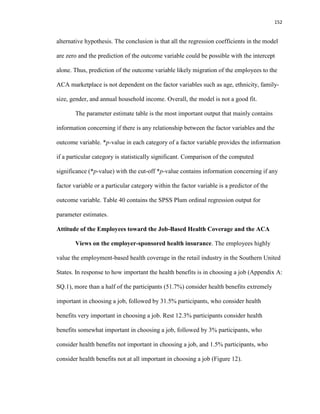
*p-value (significance) associated with each category of the factor variables is
greater than the cut-off *p-value (.05). Thus, the conclusion is that no category under the](https://image.slidesharecdn.com/dissertationmanuscriptjeetendradash-150401112314-conversion-gate01/85/Dissertation-manuscript-jeetendra-dash-172-320.jpg)
![195
References
American Association of Retired Persons. (n.d.). Glossary of health care terms. Retrieved
August 9, 2014 from http://www.aarp.org/health/affordable-care-act/glossary/
Adam, L. (2012, June 28). Supreme Court upholds health care law, 5-4, in victory for
Obama. The New York Times. Retrieved May 13, 2013 from
http://www.nytimes.com/2012/06/29/us/supreme-court-lets-health-law-largely-
stand.html?pagewanted=all
Ahlquist, G. D., Borromeo, P. F., & Saxena, S. B. (2011). The future of health insurance:
Demise of employer-sponsored coverage greatly exaggerated. Report, 1-14.
Retrieved from http://www.booz.com/global/home/what-we-think/reports-white-
papers/article-display/future-health-insurance-demise-
employer#prettyPhoto[iframes]/0/
American University. (n.d.). SPSS bivariate statistics. Social Science Research Lab,
Center for Teaching, Research, and Learning, 1-6. Retrieved August 16, 2014
from http://www.american.edu/ctrl/upload/spss_bivariate_statistics_spring_2010-
2.pdf
Anglim, A. (2011). Rule of thumb for minimum sample size for multiple regressions.
Retrieved June 17, 2014 from
http://stats.stackexchange.com/questions/10079/rules-of-thumb-for-minimum-
sample-size-for-multiple-regression/10105#10105
Aspen Institute. (n.d.). The retail trade workforce in the United States. 1-4. Retrieved
from http://www.aspenwsi.org/wordpress/wp-content/uploads/RetailOverview.pdf](https://image.slidesharecdn.com/dissertationmanuscriptjeetendradash-150401112314-conversion-gate01/85/Dissertation-manuscript-jeetendra-dash-214-320.jpg)
![225
U.S. Bureau of Labor Statistics. (n.d.). Industries at a glance: Retail trade. Retrieved from
http://data.bls.gov/cgi-bin/print.pl/iag/tgs/iag44-45.htm
U.S. Chamber of Commerce. (2013). Critical employer issues in the Patient Protection
and Affordable Care Act. Report, 1-41. Retrieved Feb.08, 2014 from
https://www.uschamber.com/sites/default/files/legacy/chambers/files/51910critica
lemployerissuesintheppaca.pdf
Waldron, T. (2012). Four reasons why the court’s decision to uphold ACA is good news
for the economy. Retrieved May 30, 2013 from
http://thinkprogress.org/economy/2012/06/28/505510/four-reasons-why-the-
courts-decision-to-uphold-ACA-is-good-news-for-the-economy/
Warren, E. (2005, February 09). Sick and broke. The Washington post. Retrieved from
http://www.washingtonpost.com/wp-dyn/articles/A9447-2005Feb8.html
Western Kentucky University. (n.d.). Measure of association for nominal and ordinal
variables. Chapter 7. [PowerPoint slides]. Retrieved August 27, 2014
White, C., & Reschovsky, J.D. (2012). Great recession accelerated long-term decline of
employer health coverage. Research Brief, 8:1-4. Retrieved from
http://www.nihcr.org/Employer_Coverage
Winona State University. Measure of association for contingency tables. [PowerPoint
slides]. Retrieved August 27, 2014
Winter, J., Dodou, D., & Wieringa, P. (2009). Multivariate behavioral research, 44:147-
181. doi:10.1080/00273170902794206.](https://image.slidesharecdn.com/dissertationmanuscriptjeetendradash-150401112314-conversion-gate01/85/Dissertation-manuscript-jeetendra-dash-244-320.jpg)
![227
Appendix A
Survey Questionnaire
The questionnaire includes survey question such as 1, 2, 3, 15, 16, and 24, used
previously by Dr. Fronstin in the 2012 health confidence surveys (Fronstin, 2012). Please
check your response to each of the following questions which requires a single response,
except question 17, which requires a ranking.
1. How important is health benefits to you when choosing a job?
[ ] Extremely important
[ ] Very important
[ ] Somewhat important
[ ] Not too important
[ ] Not at all important
2. How important is it for the employer offering a choice of health plan?
[ ] Extremely important
[ ] Very important
[ ] Somewhat important
[ ] Not too important
[ ] Not at all important
3. How confident are you that that your employer has chosen the best available plan for
its employees?
[ ] Extremely confident
[ ] Very confident
[ ] Somewhat confident](https://image.slidesharecdn.com/dissertationmanuscriptjeetendradash-150401112314-conversion-gate01/85/Dissertation-manuscript-jeetendra-dash-246-320.jpg)
![228
[ ] Not too confident
[ ] Not at all confident
4. How interested are you that more health plan choices (contrast to just one or two)
were available through the employer?
[ ] Extremely interested
[ ] Very interested
[ ] Somewhat interested
[ ] Not too interested
[ ] Not at all interested
5. Will you still work for your company even if it did not offer any health benefit?
[ ] Yes
[ ] No
[ ] Not sure
6. What do you like the most about work-place based insurance?
[ ] Group coverage allows the employer finding the best plan for the employees
[ ] Employer cares about my health and well-being
[ ] I don’t have to go through all the research to find what is best for me in the
market
[ ] Employment-based insurance has worked well in the past for American
employees
7. What do you dislike the most about workplace-based insurance?
[ ] Rising cost of health coverage
[ ] Employer will protect group interests and not what I want](https://image.slidesharecdn.com/dissertationmanuscriptjeetendradash-150401112314-conversion-gate01/85/Dissertation-manuscript-jeetendra-dash-247-320.jpg)
![229
[ ] Offers limited plan choices
[ ] Little control over choice of doctor and provider
[ ] Cannot change the plan for a year once signed up
8. What do you like the most about ACA?
[ ] Premium is subsidized based on household income
[ ] Offers more plan choices
[ ] Anyone can seek medical help regardless of pre-existing condition or level of
income
[ ] I can choose my own doctor
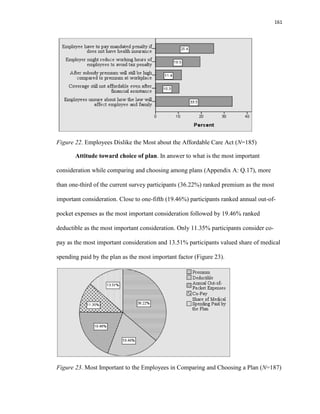
9. What do you dislike the most about ACA?
[ ] I have to pay mandated penalty if I do not have health insurance
[ ] Employers might reduce my working hours to avoid tax penalty.
[ ] After subsidy premium will still be high compared to premium at workplace
[ ] Coverage still not affordable even after financial assistance
[ ] Unsure about how the law will affect me and my family
10. If ACA were not available to you, how likely are you to participate in your
workplace-based health care plan?
[ ] Least likely
[ ] Somewhat likely
[ ] Likely
[ ] Very Likely
[ ] Most likely](https://image.slidesharecdn.com/dissertationmanuscriptjeetendradash-150401112314-conversion-gate01/85/Dissertation-manuscript-jeetendra-dash-248-320.jpg)
![230
11. Now that ACA plans are available, how likely are you to participate in your
employer-sponsored healthcare plan?
[ ] Least likely
[ ] Somewhat likely
[ ] Likely
[ ] Very Likely
[ ] Most likely
12. If you decide not to accept your health coverage at the workplace, will you buy
coverage in the ACA exchange?
[ ] Yes
[ ] No
[ ] Not sure
13. What is your preference about health insurance coverage?
[ ] Continue with the health insurance offered at the workplace
[ ] Buy my own individual plan independently through the ACA marketplace
[ ] Not have health insurance at all and pay the penalty, as required, with my tax
return
[ ] Remain uninsured and continue to visit community or charitable health centers
and pay my part on a sliding income scale
14. Which of the following describes you?
[ ] I am extremely satisfied with the health benefits offered by my company
[ ] I will be better off with higher benefit and low wage
[ ] I will be better off with less benefit and high wage](https://image.slidesharecdn.com/dissertationmanuscriptjeetendradash-150401112314-conversion-gate01/85/Dissertation-manuscript-jeetendra-dash-249-320.jpg)
![231
[ ] No health benefit and premium added back to my wage
15. Do you think your company will ever drop offering health benefits to its employees?
[ ] Very likely
[ ] Somewhat likely
[ ] Not at all likely
[ ] Not sure
16. If your company decides to drop offering health benefit to its employees, how
confident are you that you can choose your health insurance plan independently in
the ACA marketplace?
[ ] Extremely confident
[ ] Very confident
[ ] Somewhat confident
[ ] Not confident at all
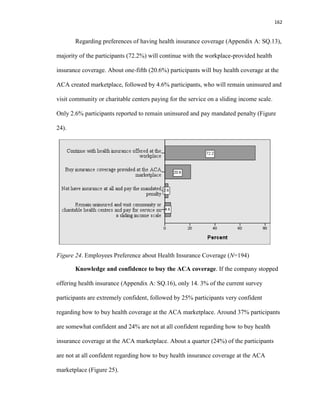
17. While comparing and choosing among health insurance plans, what is important to
you? Please rank the following (1= most important, 5= least important)
[ ] Premium
[ ] Deductible
[ ] Annual out-of-pocket expenses limit
[ ] Co-pay
[ ] Share of medical spending paid by the plan
18. What age group are you in?
[ ] 18 -- 26
[ ] 27 -- 49](https://image.slidesharecdn.com/dissertationmanuscriptjeetendradash-150401112314-conversion-gate01/85/Dissertation-manuscript-jeetendra-dash-250-320.jpg)
![232
[ ] 50 -- 64
[ ] 65 and above
19. What is your ethnicity origin?
[ ] White American
[ ] African American
[ ] Hispanic or Latino
[ ] Other
20. What is your total annual household income?
[ ] Up to $23,550
[ ] $23,551—$33,000
[ ] $33,001—$47,100
[ ] $47,101—$70,650
[ ] $70,651 —$94,200
[ ] $94,201 and above
21. What is your gender identity?
[ ] Male
[ ] Female
[ ] Other
22. What is your family size?
[ ] One
[ ] Two
[ ] Three
[ ] Four and above](https://image.slidesharecdn.com/dissertationmanuscriptjeetendradash-150401112314-conversion-gate01/85/Dissertation-manuscript-jeetendra-dash-251-320.jpg)
![233
23. Do you think you have enough information about the new healthcare law (popularly
called ACA) and the way it impacts you and your family?
[ ] Yes
[ ] No
[ ] Not sure
24. How satisfied are you with the health care benefits offered by your company?
(Answer if you are enrolled in one)
[ ] Extremely satisfied
[ ] Very satisfied
[ ] Somewhat satisfied
[ ] Not very satisfied
[ ] Not satisfied at all
25. Do you think the employer should communicate the employees more about how the
new health care law impacts them and their families?
[ ] Yes
[ ] No
[ ] Not sure
Thank you for your time!](https://image.slidesharecdn.com/dissertationmanuscriptjeetendradash-150401112314-conversion-gate01/85/Dissertation-manuscript-jeetendra-dash-252-320.jpg)
![236
Appendix C
Permission from the Economic Policy Institute to Use Figure 1
Subject: Re: Permission to Use Figure 2, Briefing Paper # 353
From: Jeetendra Dash (jeetu526@yahoo.com)
To: lengdahl@epi.org;
Date: Tuesday, September 9, 2014 2:25 PM
On Tuesday, September 9, 2014 2:17 PM, Lora Engdahl <lengdahl@epi.org> wrote:
Jeetendra, thank you for your interest. Yes you may use that figure just make sure to
credit the author and Economic Policy Institute. Thank you.
Lora Engdahl
Publications Director
Economic Policy Institute
1333 H Street, NW
Suite 300, East Tower
Washington, DC 20005
202-533-2572
From: Jeetendra Dash [mailto:jeetu526@yahoo.com]
Sent: Tuesday, September 09, 2014 2:49 PM
To: Publications
Subject: Permission to Use Figure 2, Briefing Paper # 353
Respected Madam/Sir,
I am a doctoral candidate at Columbia Southern University and my research is about how
the Affordable Care Act impacts the retail employees in the Southern United States.
With your kind permission, I would like to use the “Figure A” used in the EPI Briefing
Paper #353, Employer Sponsored Health Insurance Coverage Continues to Decline in a
New Decade, December 5, 2012, by Elise Gould.
Your kind gesture is exceedingly appreciated and I look forward to hearing from you.
Best regards,
Jeetendra Dash, Doctoral Candidate,
Columbia Southern University.](https://image.slidesharecdn.com/dissertationmanuscriptjeetendradash-150401112314-conversion-gate01/85/Dissertation-manuscript-jeetendra-dash-255-320.jpg)
![238
From: KFF Contact Us [mailto:no-reply@wufoo.com]
Sent: Tuesday, September 09, 2014 3:30 PM
To: Kaiser Family Foundation Help
Subject: Kaiser Family Foundation Question/Comment
Full name * Jeetendra N. Dash
Email Address * jeetu526@yahoo.com
Choose one * Reprinting or Citing KFF Work
Enter your question or comment below. *
Respected Madam/Sir,
It was a great pleasure reading the article “The Uninsured: A Primer –Key Facts about
Health Insurance on the Eve of Coverage Expansions” posted on October, 23, 2013.
I am a doctoral candidate at Columbia Southern University and my research is about
how the Affordable Care Act impacts the retail employees in the Southern United
States. With your kind permission, I would like to use the figure 3, captioned
Uninsured Rates Among Selected Industry Groups, White vs, Blue Collar Jobs, 2012,
Your kind gesture is exceedingly appreciated and I look forward to hearing from you.
Best regards,
Jeetendra Dash
Doctoral Candidate,
Columbia Southern University.](https://image.slidesharecdn.com/dissertationmanuscriptjeetendradash-150401112314-conversion-gate01/85/Dissertation-manuscript-jeetendra-dash-257-320.jpg)
![240
From: Jeetendra Dash [mailto:jeetu526@yahoo.com]
Sent: Wednesday, September 10, 2014 11:30 AM
To: Fernandez, Bernadette
Subject: Permission to use Figure 1
Dear Ms. Fernandez,
Good morning and it was a great pleasure reading in the past the Congressional Research
Report "Premium Credits in the Patient Protection and ACA", March 12, 2014, authored
by you. Thank you. http://fas.org/sgp/crs/misc/R41137.pdf
I am a doctoral candidate at Columbia Southern University and my research is about how
the Affordable Care Act impacts the retail employees in the Southern United States.
With your kind permission, I would like to use the Figure 1, captioned Maximum
percentage of Household Income to Use toward Premiums for the Second Lowest Cost
Silver Plan, by percentage of the Federal Poverty Level on page 8 of the report.
Your kind gesture is exceedingly appreciated and I look forward to hearing from you.
Best regards,
Jeetendra Dash
Doctoral Candidate,
Columbia Southern University](https://image.slidesharecdn.com/dissertationmanuscriptjeetendradash-150401112314-conversion-gate01/85/Dissertation-manuscript-jeetendra-dash-259-320.jpg)
![242
Affordable, quality health care. For everyone.
From: Jeetendra Dash [mailto:jeetu526@yahoo.com]
Sent: Friday, September 12, 2014 4:02 PM
To: Samantha Mackie
Subject: Permission to Use Figures
Dear Ms. Mackie,
Good afternoon. It was a pleasure reading in the past both the publications "A New Era in
American Health Care", Publication 1419, June 2010, by Dr. Karen Davis and "The
Impact of Health Reforms on Health System Spending", Issue Brief, May, 2010, by Dr.
David M. Cutler, Dr. Karen Davis, and Mr. Kristof Stremikis.
I am a doctoral candidate at Columbia Southern University and my research is about how
the Affordable Care Act impacts the retail employees in the Southern United States. With
your kind permission, I would like to use the Exhibit 2, captioned Trend in the number of
Uninsured Non-elderly, 2013-2019 Before and After Health Reform, relating to the
publication “A New Era in American Health Care” and Exhibit 3, captioned Total
National Health Expenditure (NHE) 2009-2019 Before and After Reform, relating to the
publication “The Impact of Health Reforms on Health System Spending”.
Your kind gesture is greatly appreciated and I look forward to hearing from you.
Best regards,
Jeetendra Dash
Doctoral Candidate,
Columbia Southern University.](https://image.slidesharecdn.com/dissertationmanuscriptjeetendradash-150401112314-conversion-gate01/85/Dissertation-manuscript-jeetendra-dash-261-320.jpg)
![243
Appendix G
Permission to Use Figure 6 in the U.S. Chamber of Commerce Publication
Subject: Re: Request to use the Flowchart
From: Jeetendra Dash (jeetu526@yahoo.com)
To: jwhite@horizondc.com;
Date: Thursday, October 9, 2014 8:58 PM
On Thursday, October 9, 2014 7:15 PM, Joel White <jwhite@horizondc.com> wrote:
Sure. Not a problem. Let me know if you need the file.
From: Jeetendra Dash [mailto:jeetu526@yahoo.com]
Sent: Thursday, October 9, 2014 6:42 PM
To: Joel White
Subject: Request to use the Flowchart
Dear Mr. White,
As a doctoral student it was a great pleasure reading the document “Critical Employer
Issues in the Affordable Care Act” which is authored by you and published by the U.S.
Chamber of Commerce, which serves as a handbook for the business community. My
research is about how the Affordable Care Act impacts the retail employees in the
Southern United States. With your kind permission, I would like to use, with appropriate
credit given to you as the author, the flowchart captioned the employer mandate and
penalties.
Your kind gesture is exceedingly appreciated and I look forward to hearing from you.
Best regards,
Jeetendra Dash
Doctoral Candidate, Columbia Southern University](https://image.slidesharecdn.com/dissertationmanuscriptjeetendradash-150401112314-conversion-gate01/85/Dissertation-manuscript-jeetendra-dash-262-320.jpg)
![245
From: Jeetendra Dash [mailto:jeetu526@yahoo.com]
Sent: Wednesday, September 10, 2014 3:16 AM
To: Permissions
Subject: Permission to Use the Graph
Respected Madam/Sir
It was a great pleasure reading the article “The Effects of the Affordable Care Act on
Workers’ Health Insurance Coverage”, October 7, 2010, by Dr. Christine Eibner, Dr.
Peter S. Hussey, and Dr. Federico Girosi. Thank you. doi:10.1056/NEJMp1008047
I am a doctoral candidate at Columbia Southern University and my research is about how
the Affordable Care Act impacts the retail employees in the Southern United States.
With your kind permission, I would like to use the graph captioned, Effect of the
Affordable Care Act on Workers’ Health Insurance Options.
Your kind gesture is exceedingly appreciated and I look forward to hearing from you.
Best regards,
Jeetendra Dash
Doctoral Candidate,
Columbia Southern University.](https://image.slidesharecdn.com/dissertationmanuscriptjeetendradash-150401112314-conversion-gate01/85/Dissertation-manuscript-jeetendra-dash-264-320.jpg)
![247
On Sep 10, 2014, at 4:20 PM, "Buchheit, Rebecca"
<Rebecca.Buchheit@heritage.org<mailto:Rebecca.Buchheit@heritage.org>> wrote:
Hi Melissa,
Another request to reprint a figure – feel free to contact Jeetendra directly.
Thanks,
Rebecca
___________________________
Rebecca Buchheit
Communications Coordinator
x1784
From: Jeetendra Dash [mailto:jeetu526@yahoo.com]
Sent: Wednesday, September 10, 2014 2:56 AM
To: Heritagepress
Subject: Permission to use a figure
Respected Madam/Sir,
It was a great pleasure reading in the past the article “What are the Odds Your Employer
Will Drop Health Coverage?”, July 27, 2012, by Ms. Alyene Senger. Thank you.
I am a doctoral candidate at Columbia Southern University and my research is about how
the Affordable Care Act impacts the retail employees in the Southern United States. With
your kind permission, I would like to use the Figure captioned, Estimated Loss of
Employer Coverage after Full Implementation.
Your kind gesture is exceedingly appreciated and I look forward to hearing from you.
Best regards,
Jeetendra Dash
Doctoral Candidate,
Columbia Southern University.](https://image.slidesharecdn.com/dissertationmanuscriptjeetendradash-150401112314-conversion-gate01/85/Dissertation-manuscript-jeetendra-dash-266-320.jpg)
![253
Appendix N
Internal Review Board (IRB) Conditional Approval Letter
From: Ann Nelson
Sent: Monday, December 30, 2013 10:58 AM
To: Steven Cates
Cc: Heather Smith
Subject: Jeetendra Dash IRB decision
Greetings Dr. Cates,
The IRB has issued a conditional approval provided modifications are made as indicated.
The committee has agreed with the attached. The IRB does not need to see these
corrections. The student may move forward and work on them at the same time.
:-)
Ann
Ann Nelson, PhD, SPHR, GPHR | Program Director, DBA
800.977.8449 x1703 Office
www.ColumbiaSouthern.edu<http://www.columbiasouthern.edu/>
[Description: Description: Description: Description: Description: CSU logo]
Privileged/Confidential Information may be contained in this message. If you are not the
addressee indicated in this message, you may not copy or deliver this message to anyone.
In such case, you should destroy this message and kindly notify the sender by reply mail.](https://image.slidesharecdn.com/dissertationmanuscriptjeetendradash-150401112314-conversion-gate01/85/Dissertation-manuscript-jeetendra-dash-272-320.jpg)

![2010 workforcereport[1]](https://cdn.slidesharecdn.com/ss_thumbnails/2010workforcereport1-120304230109-phpapp02-thumbnail.jpg?width=640&height=640&fit=bounds)


