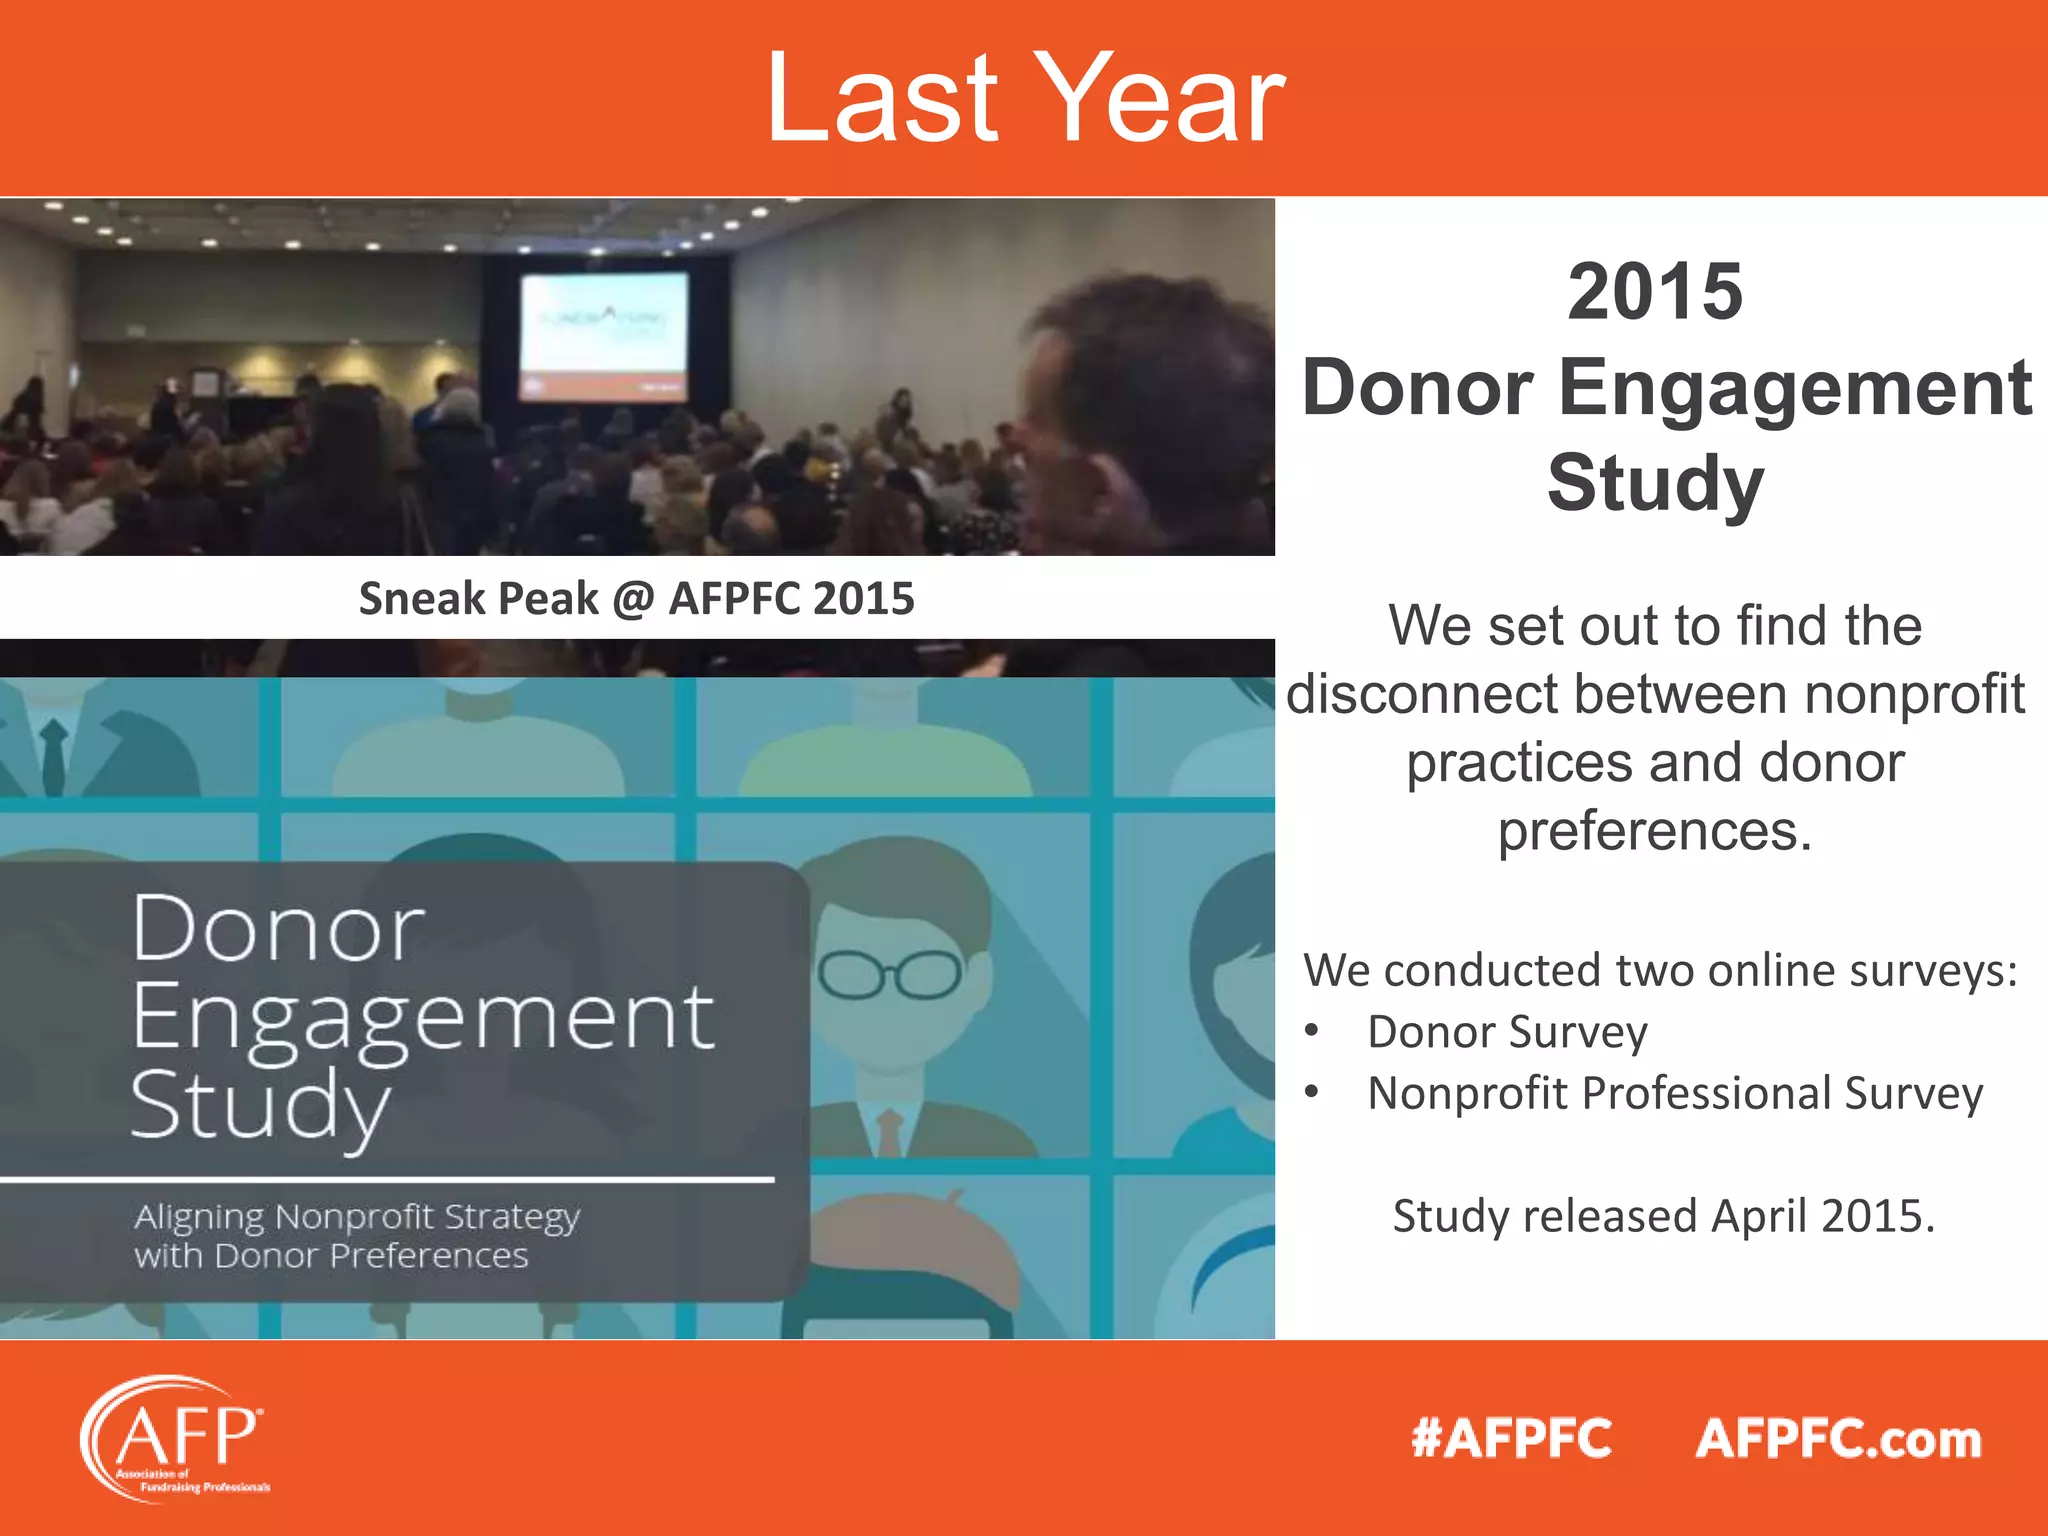
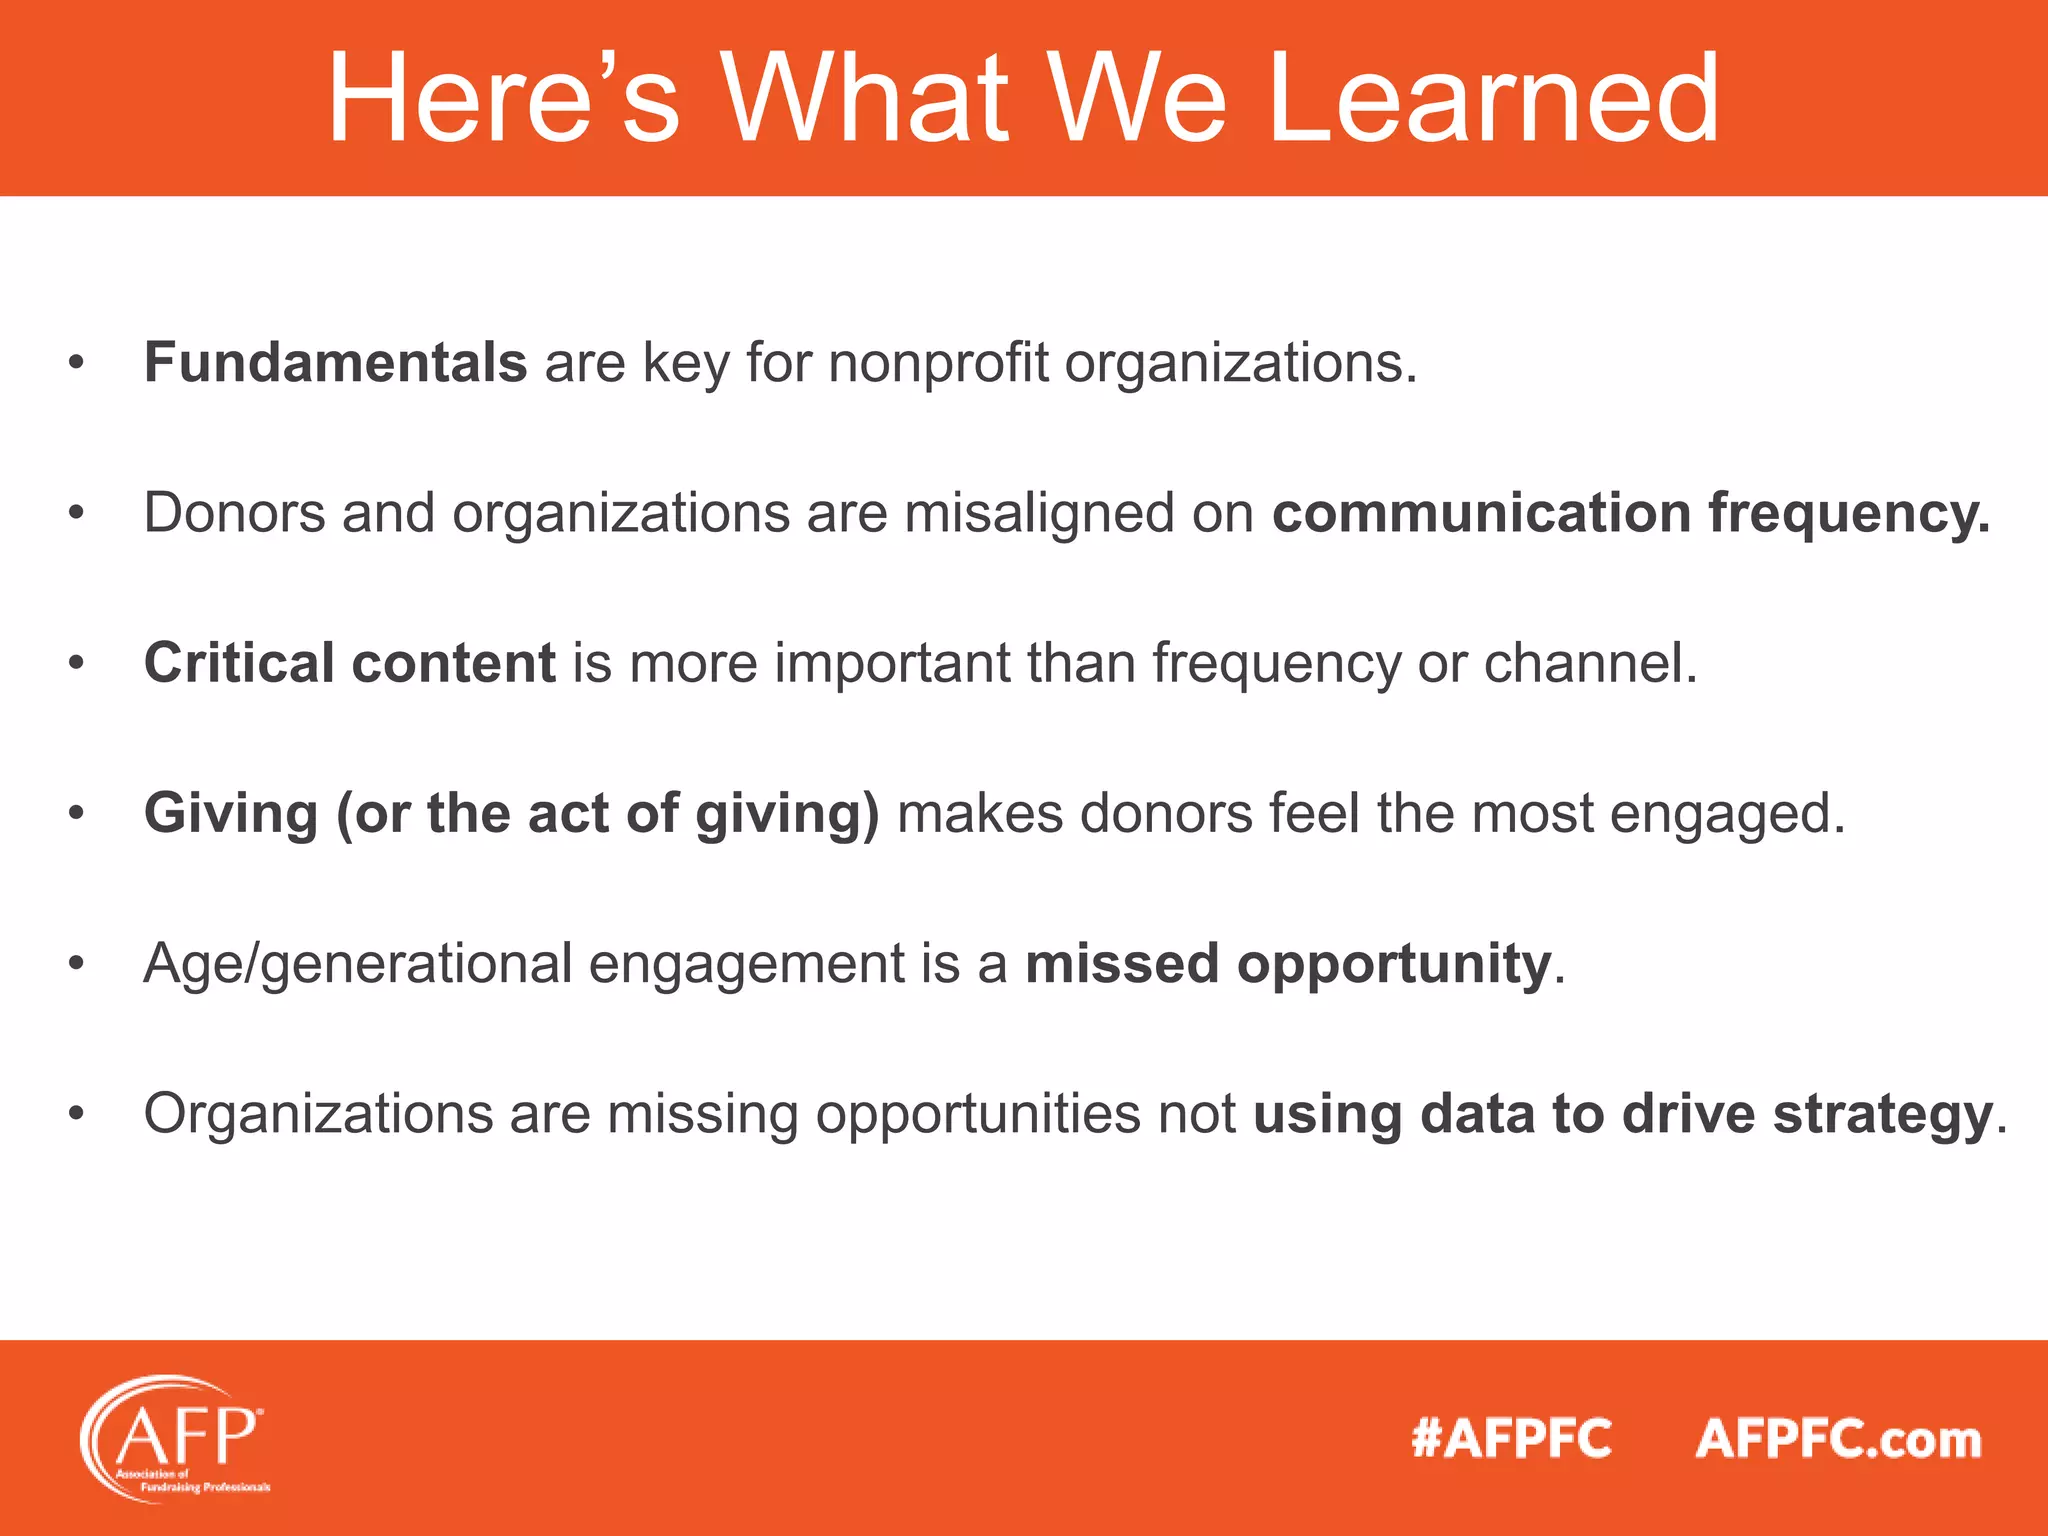
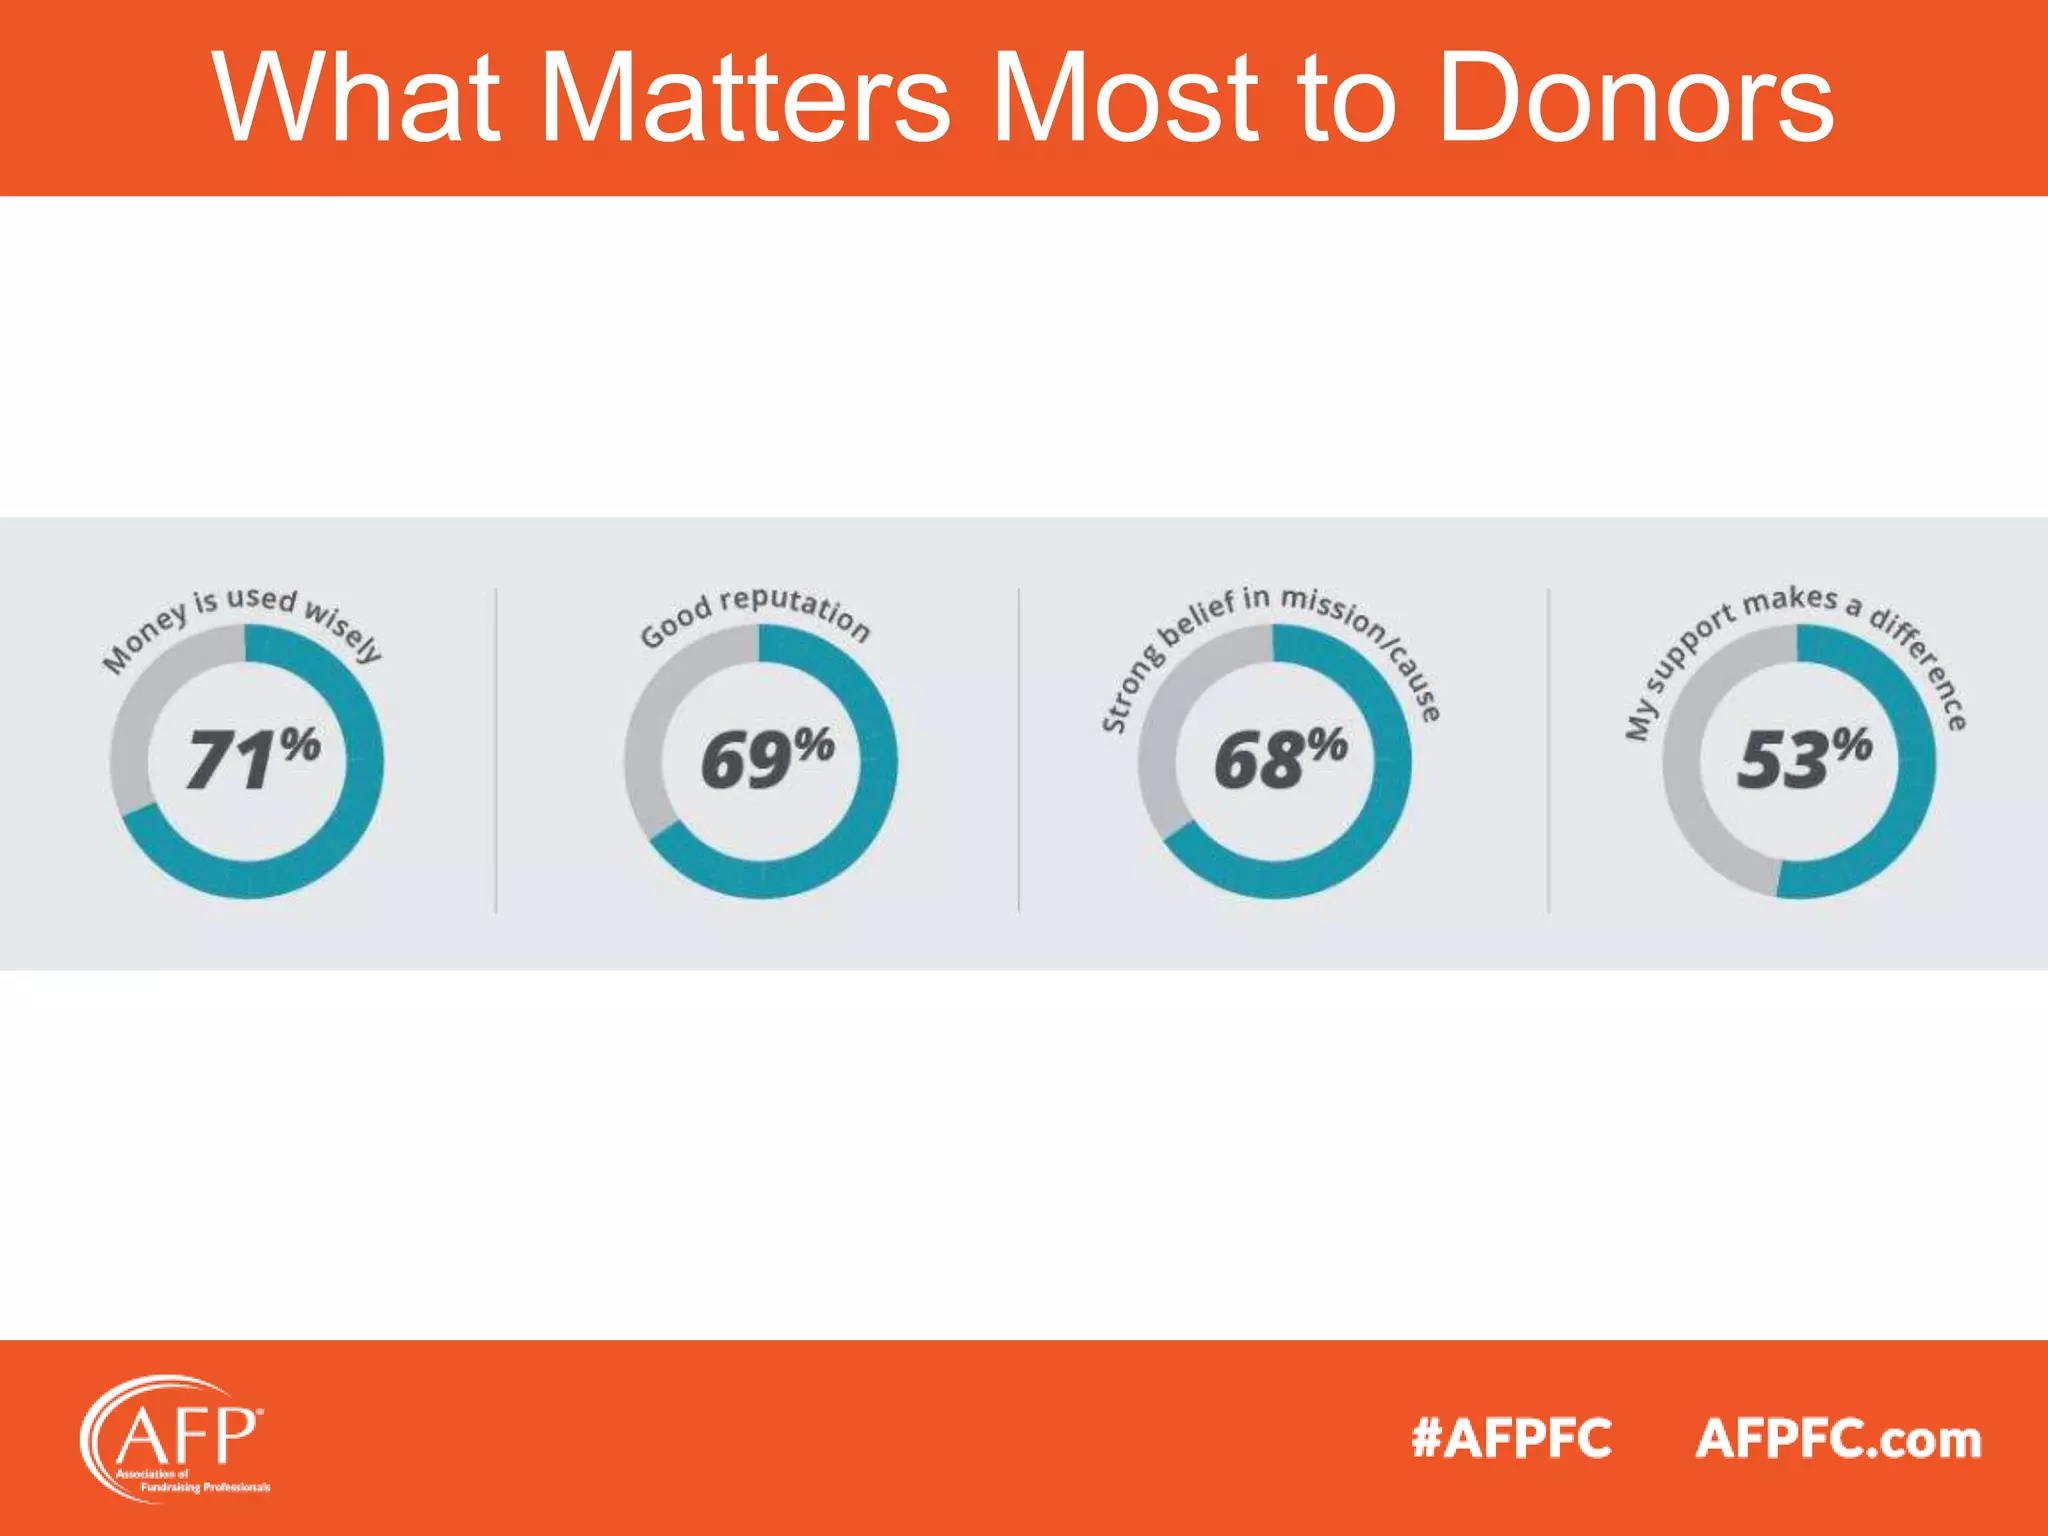
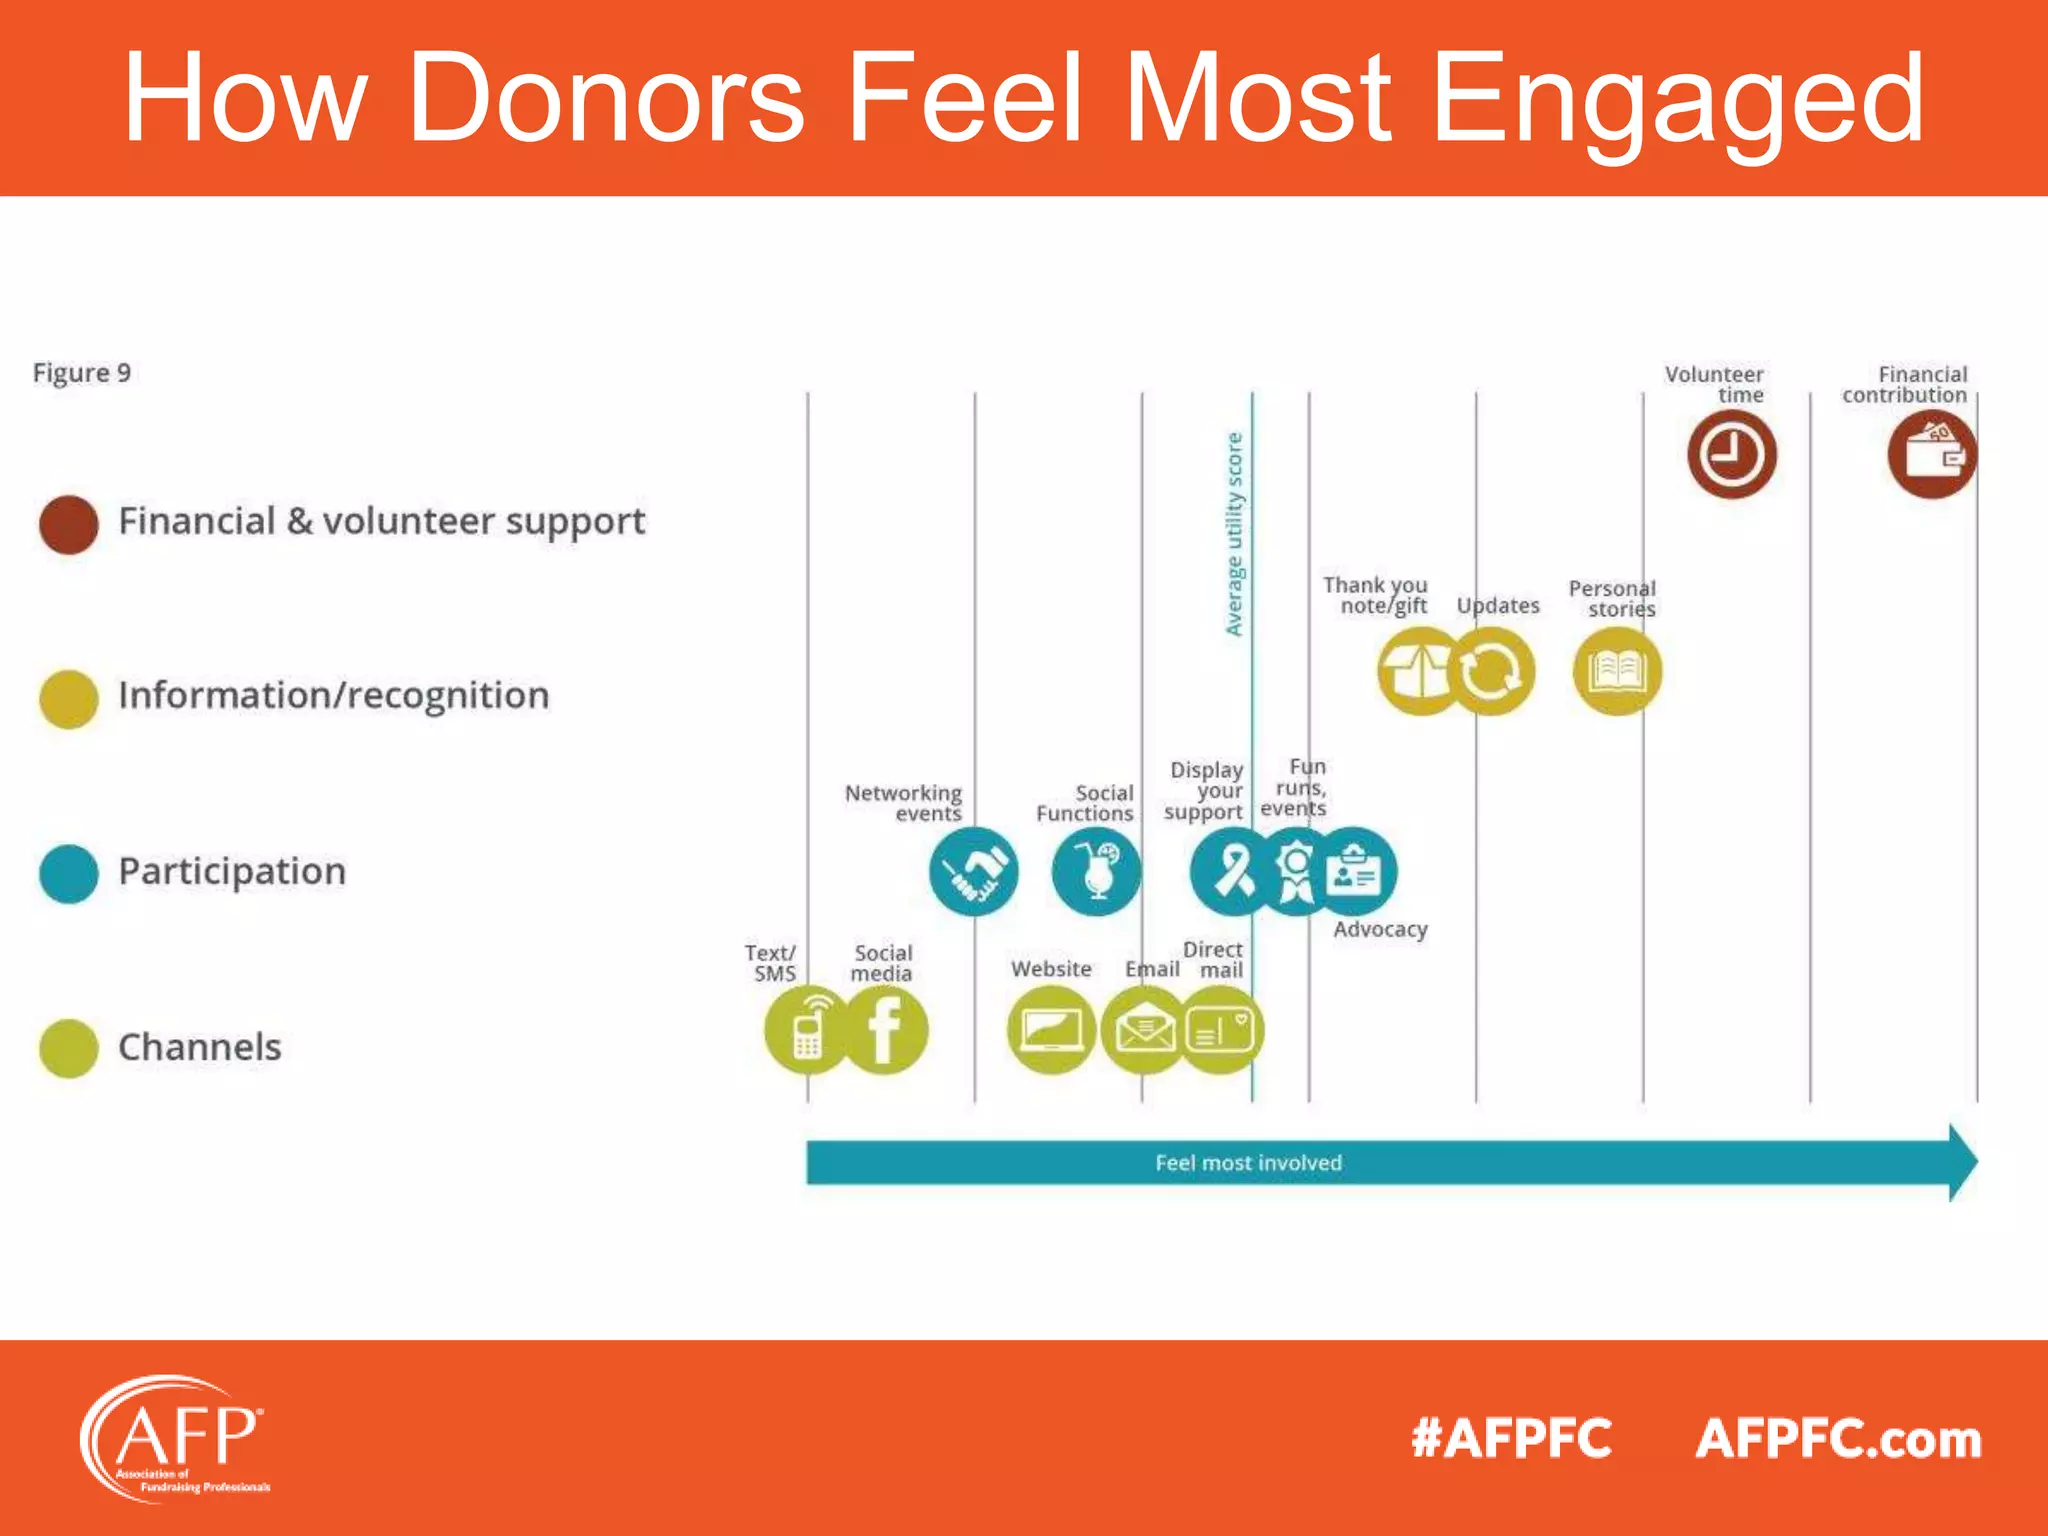
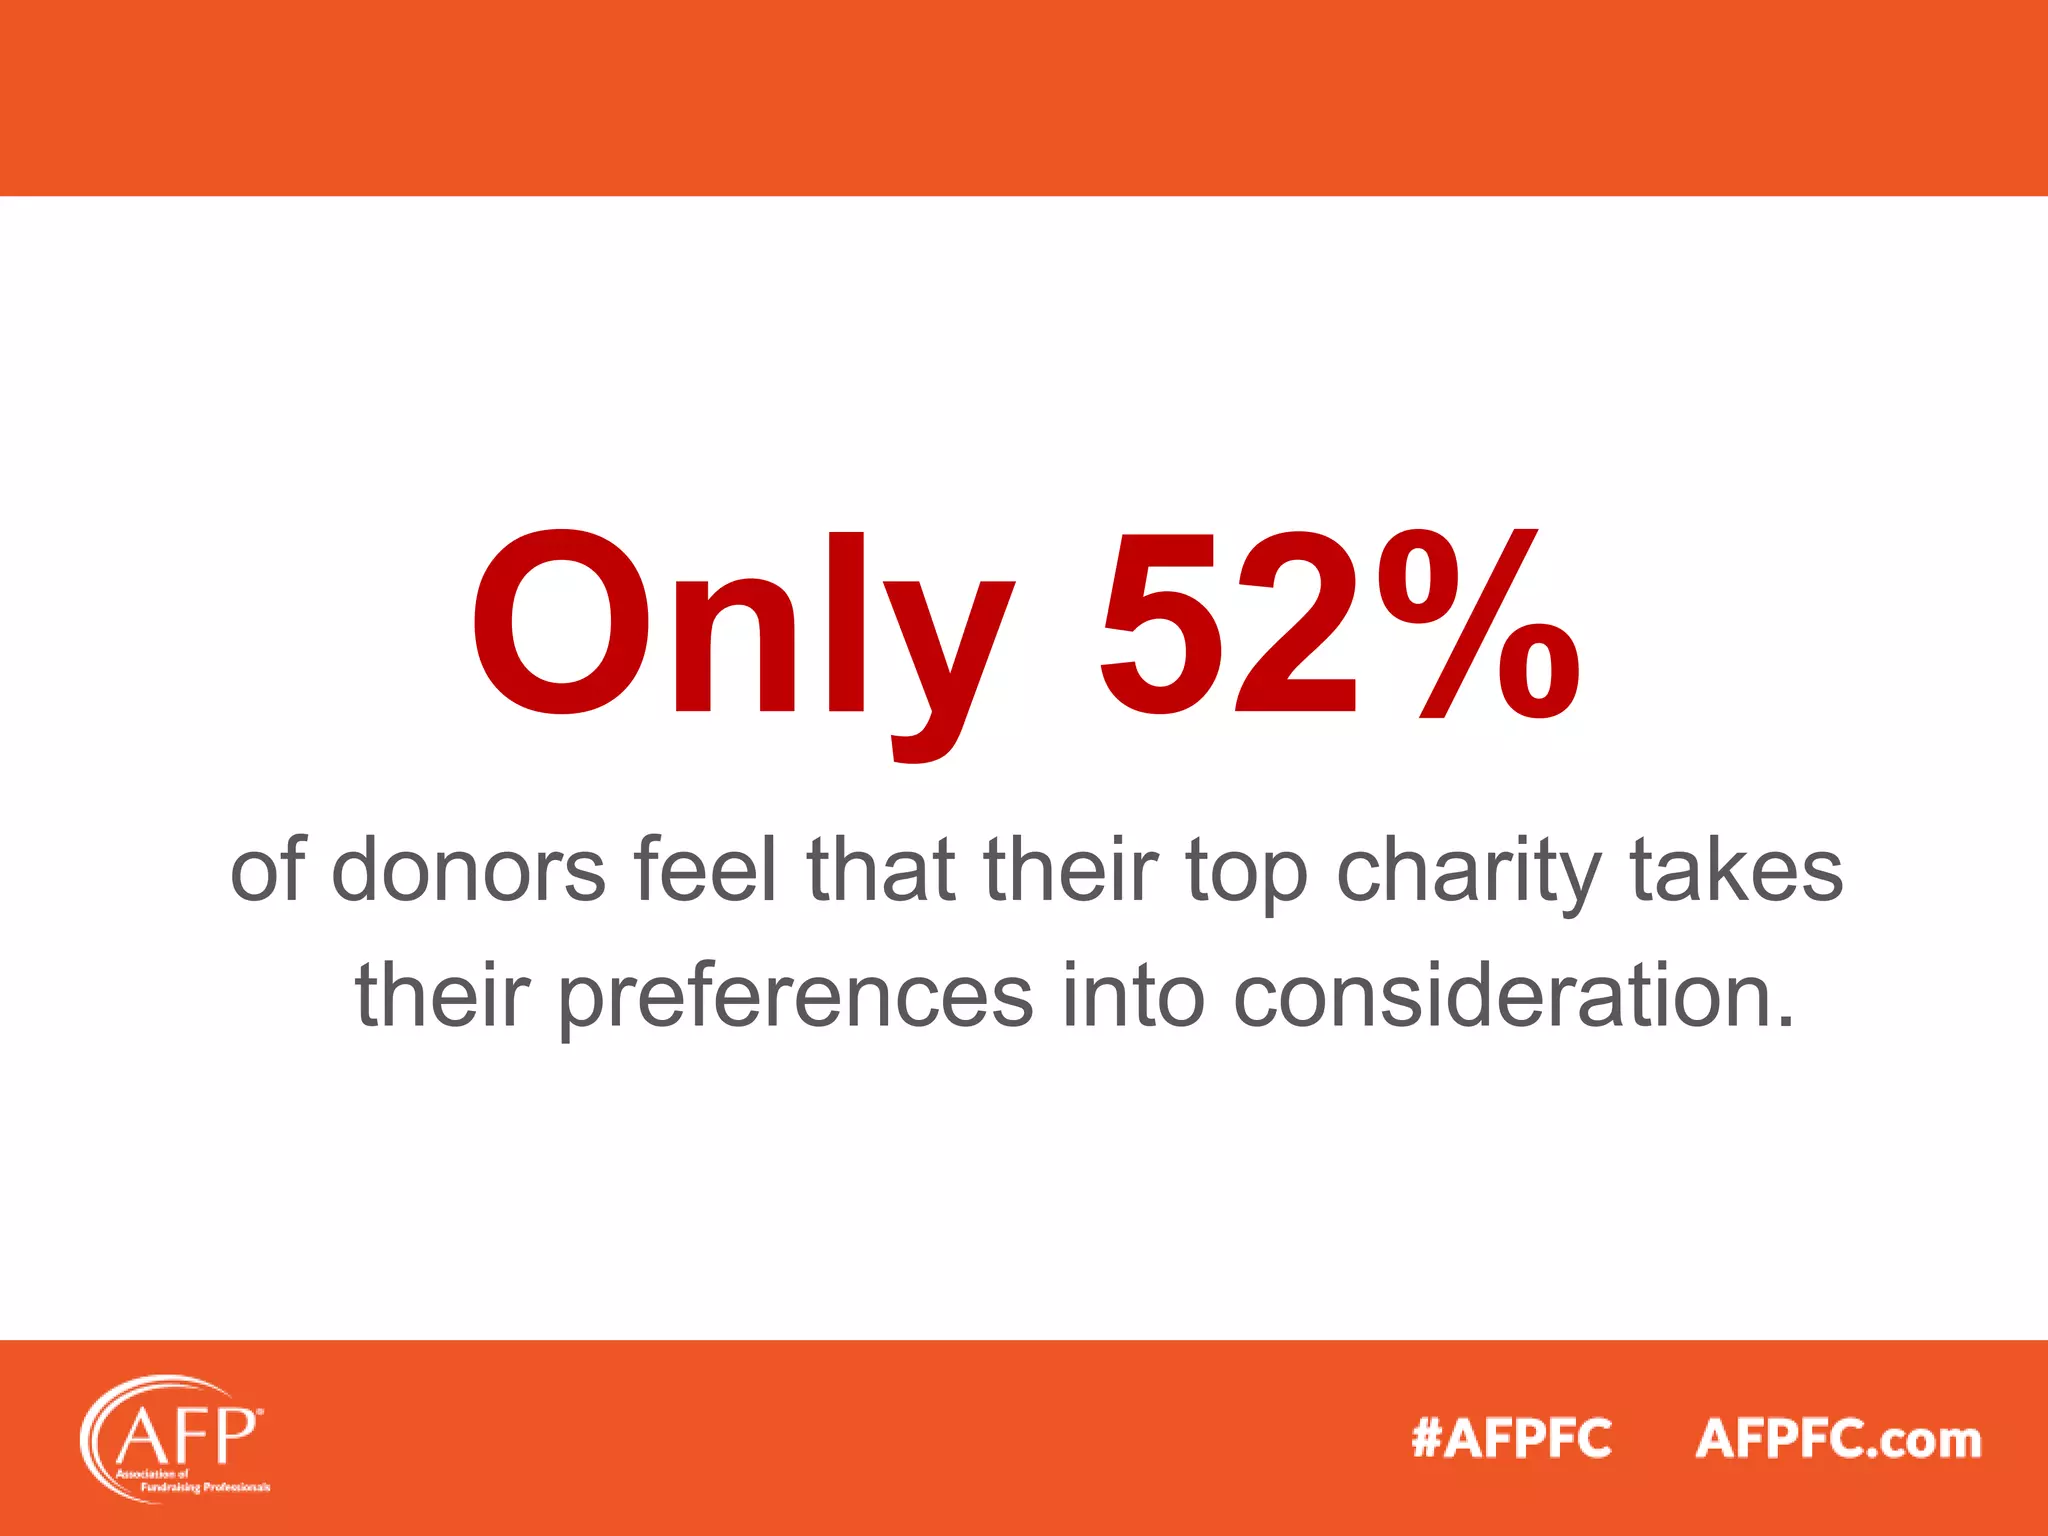
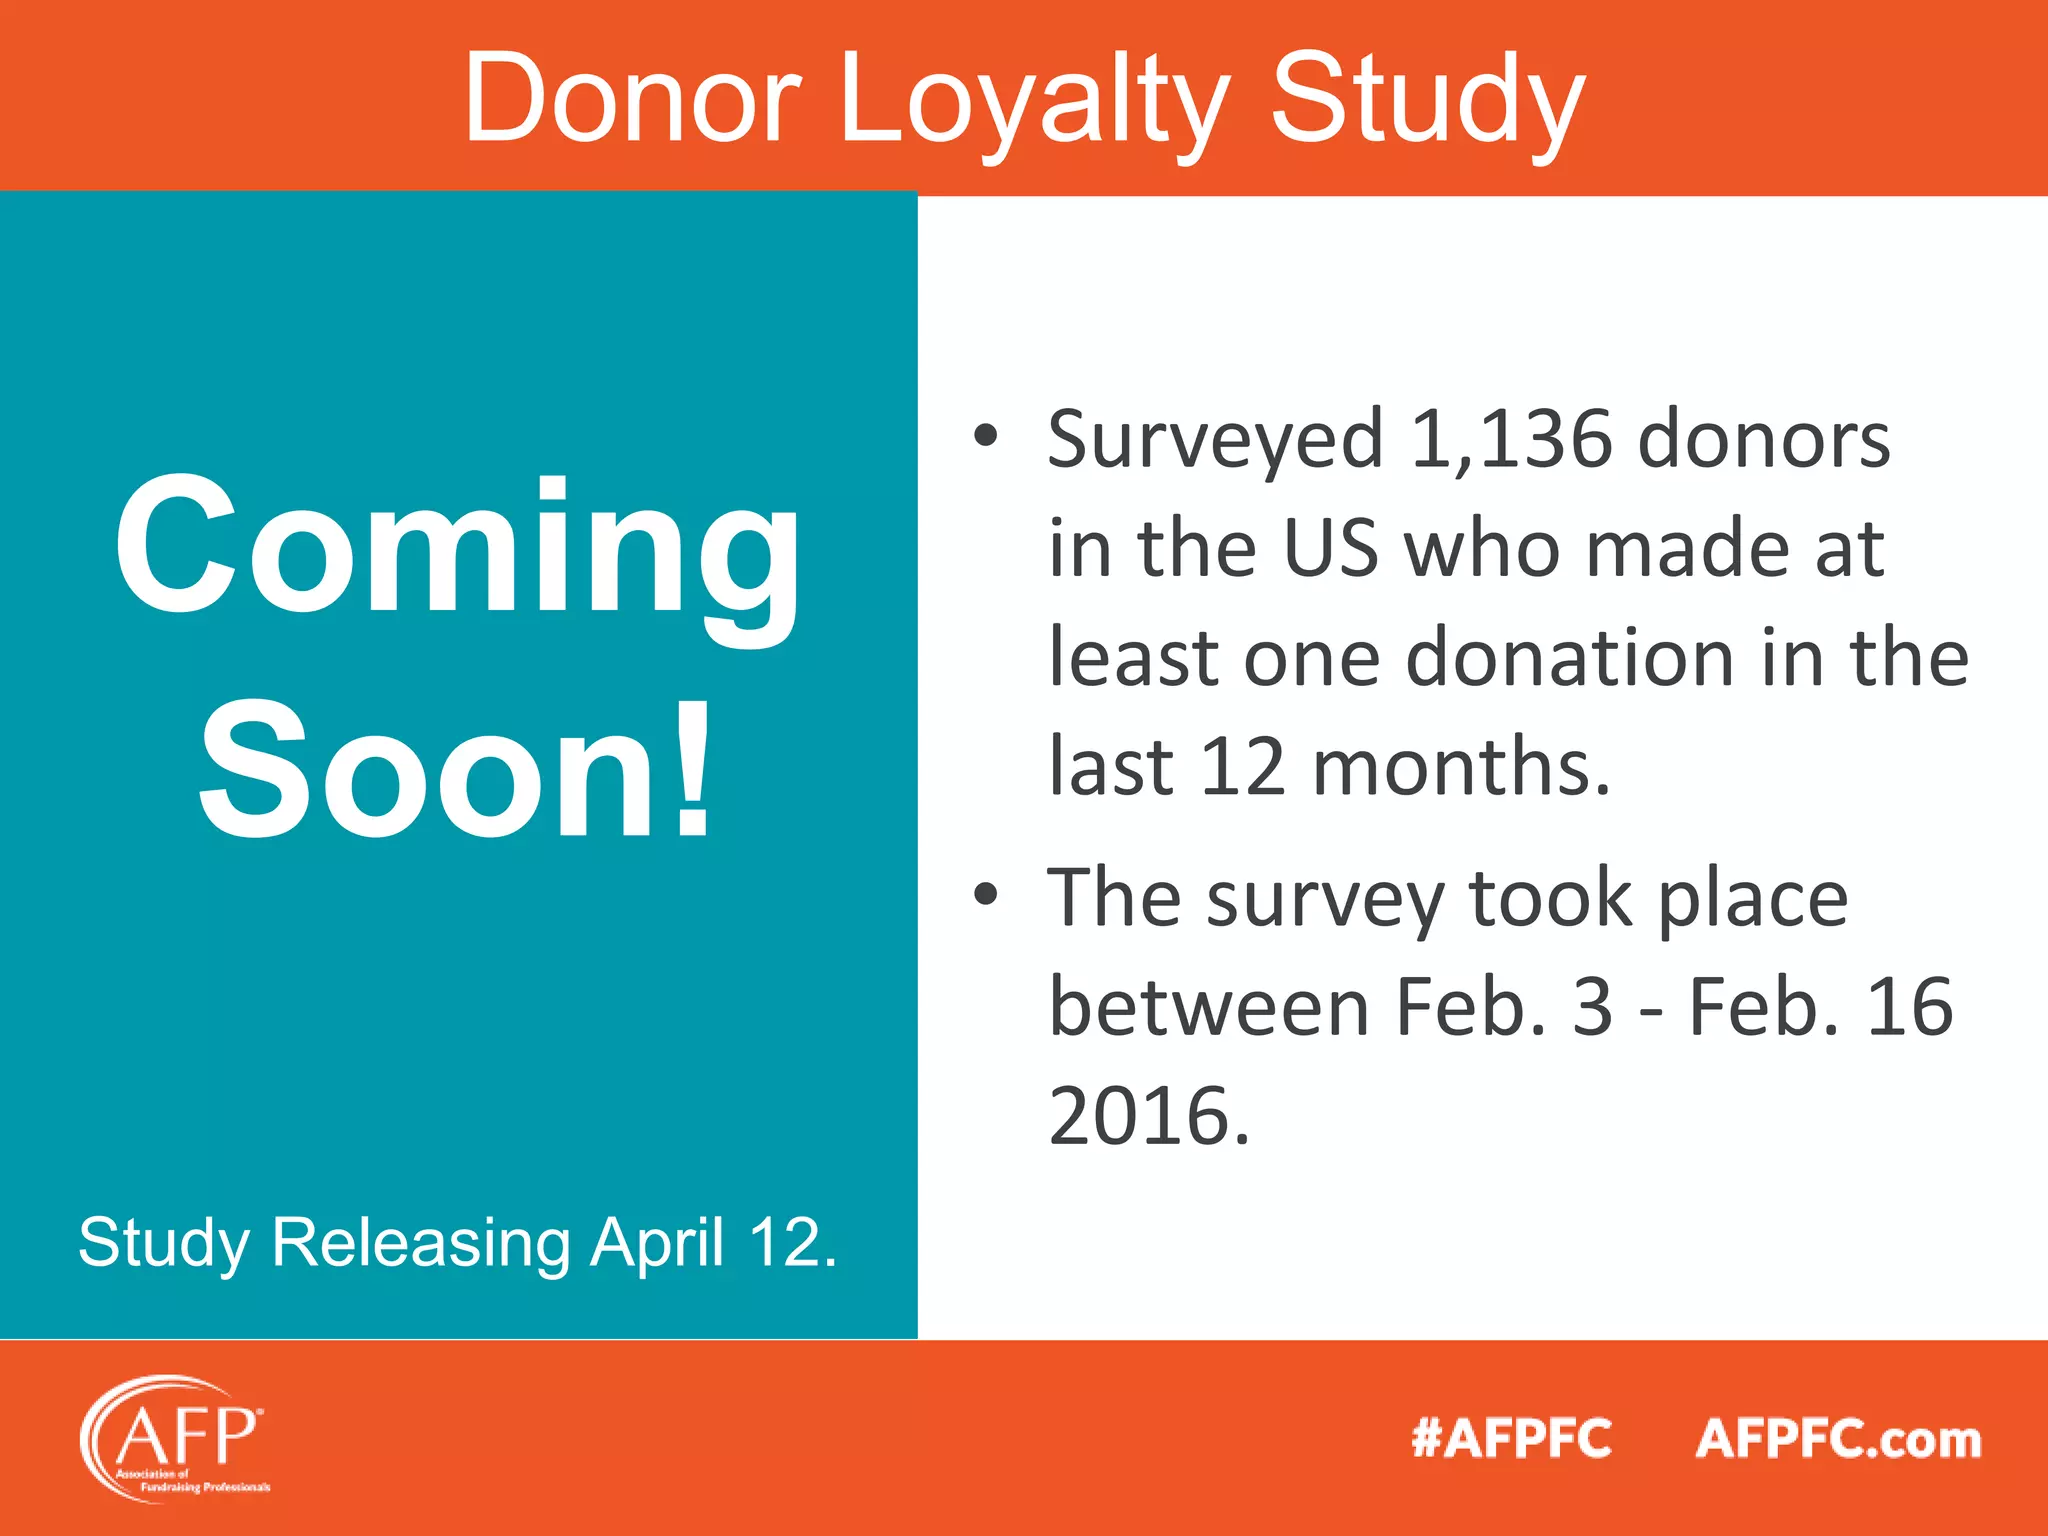
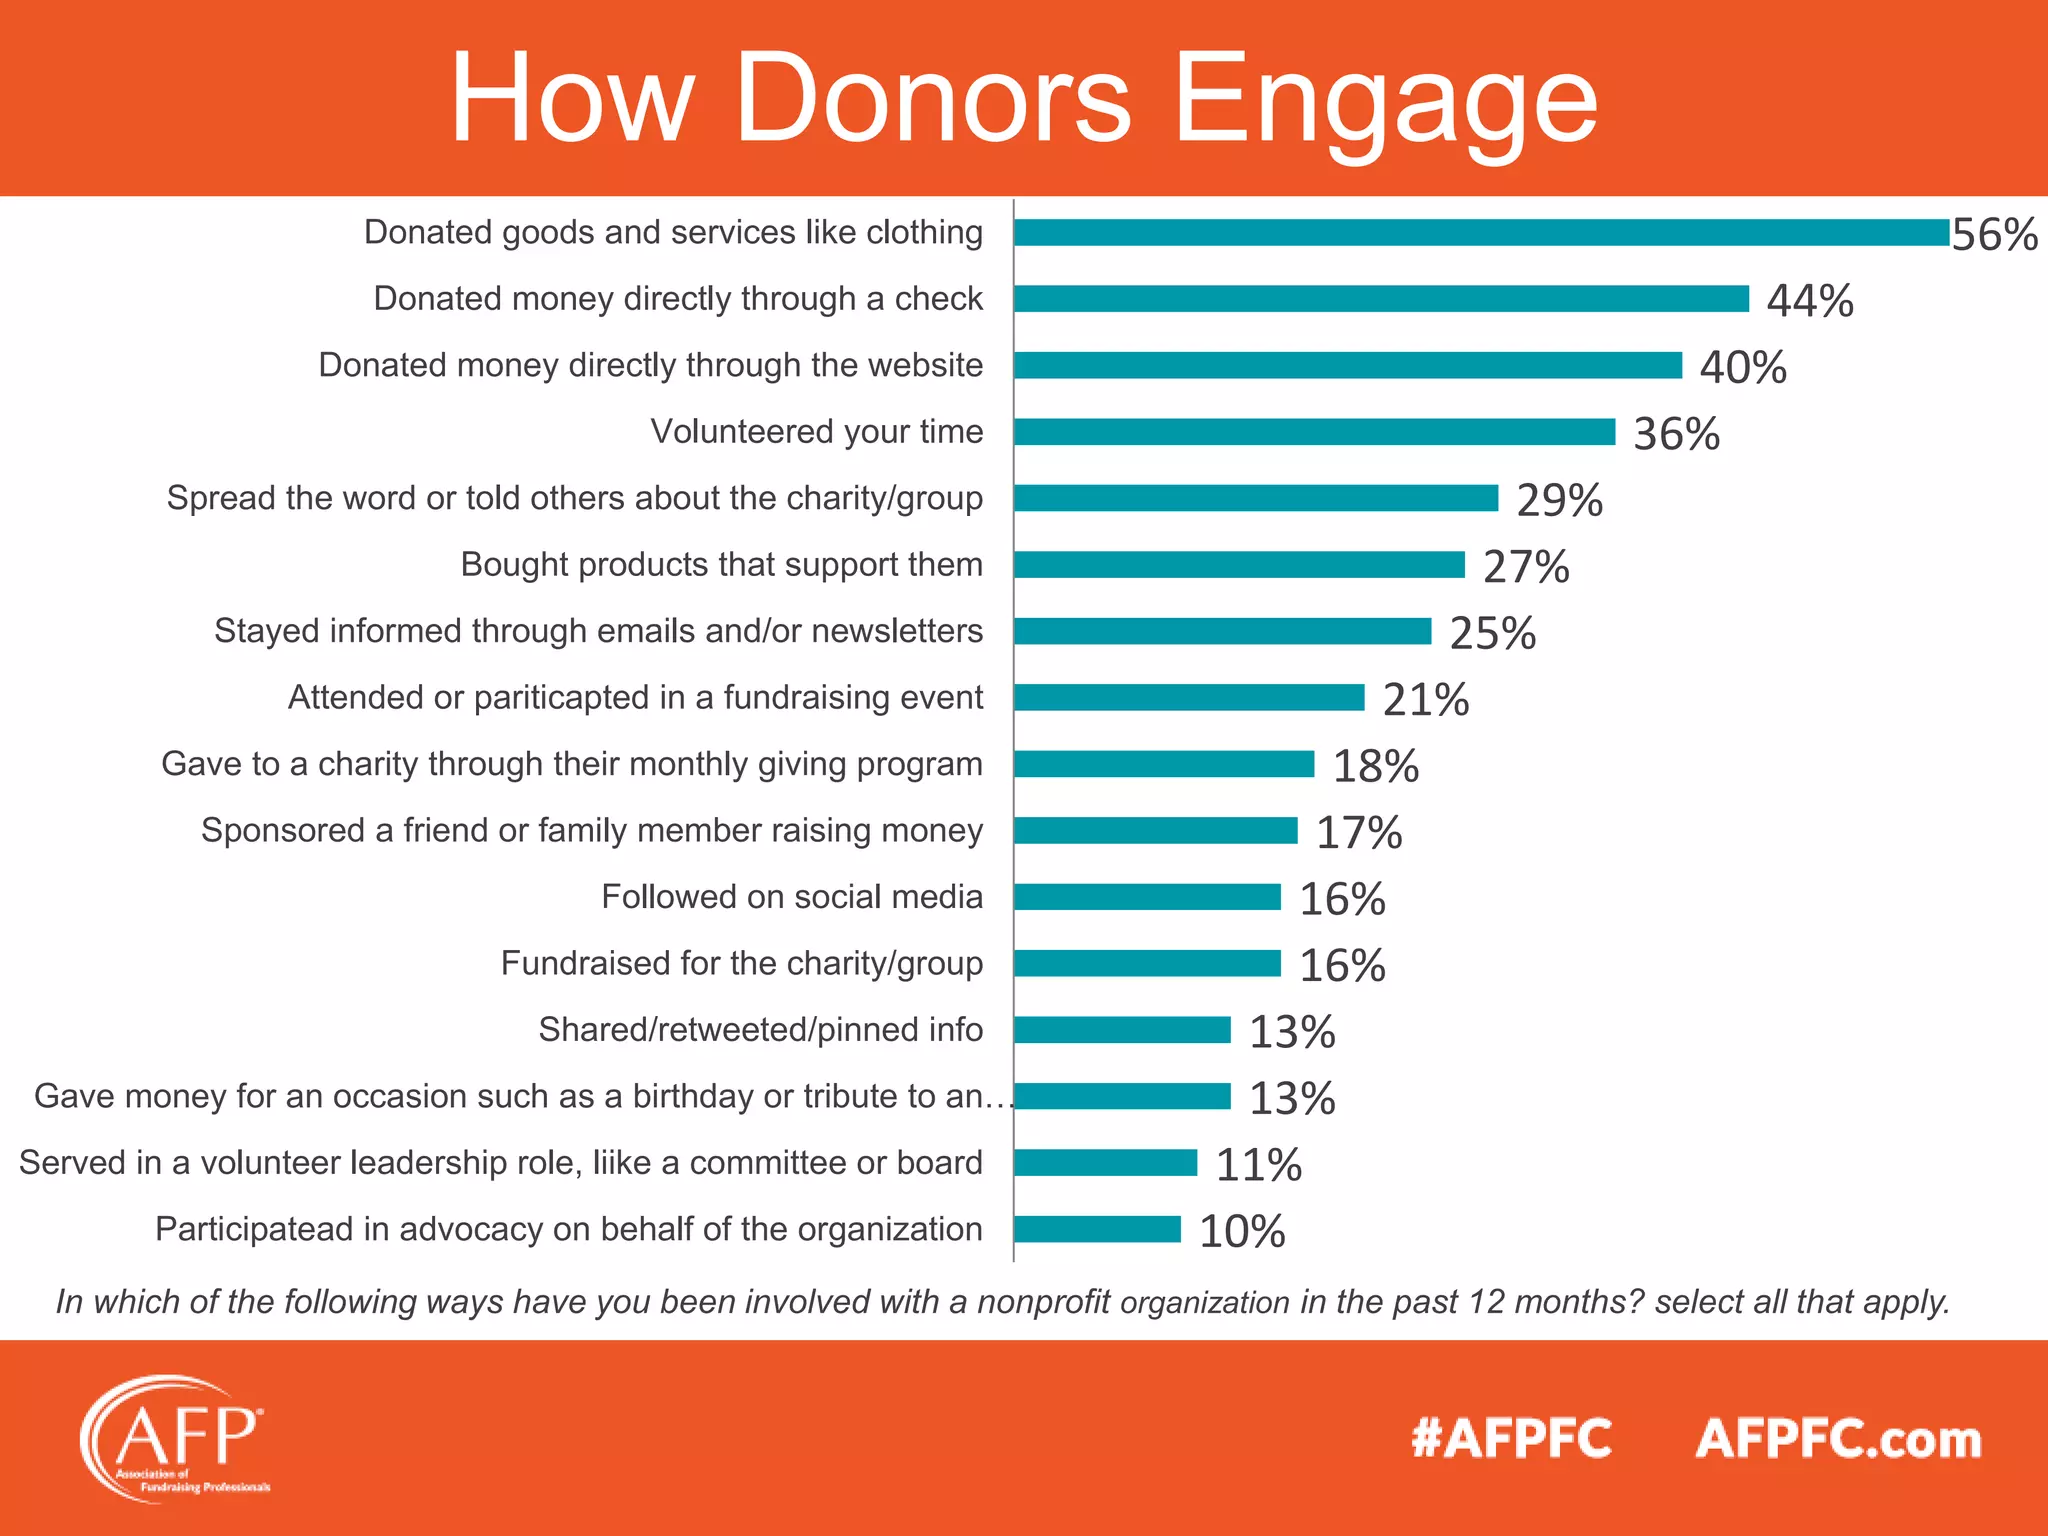
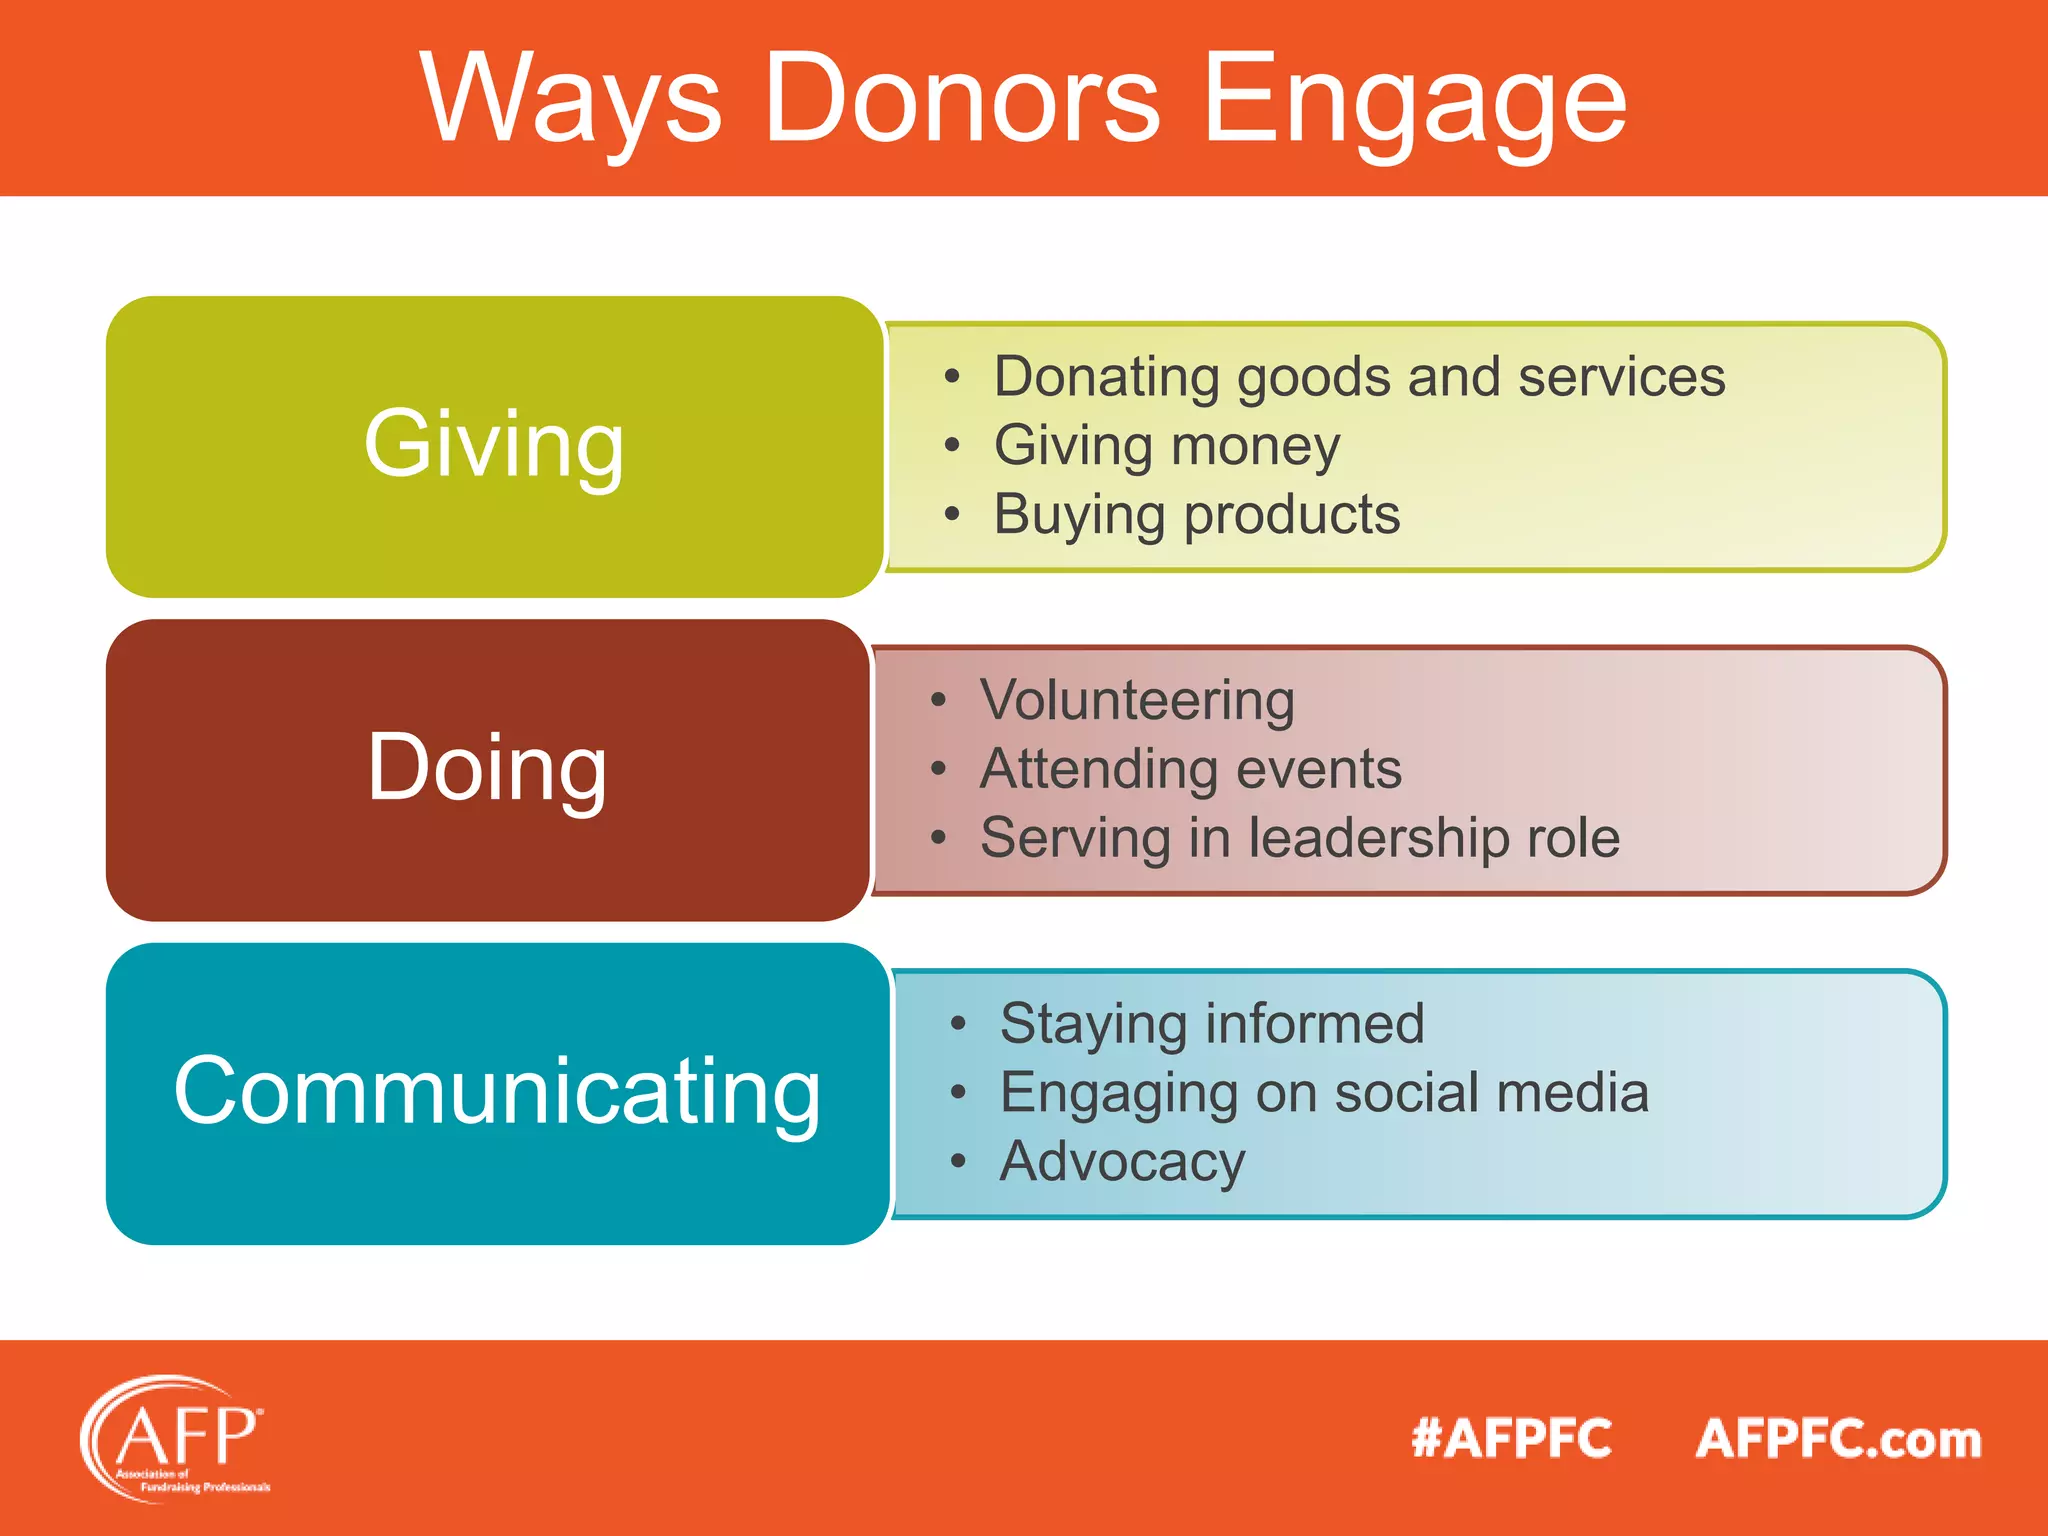
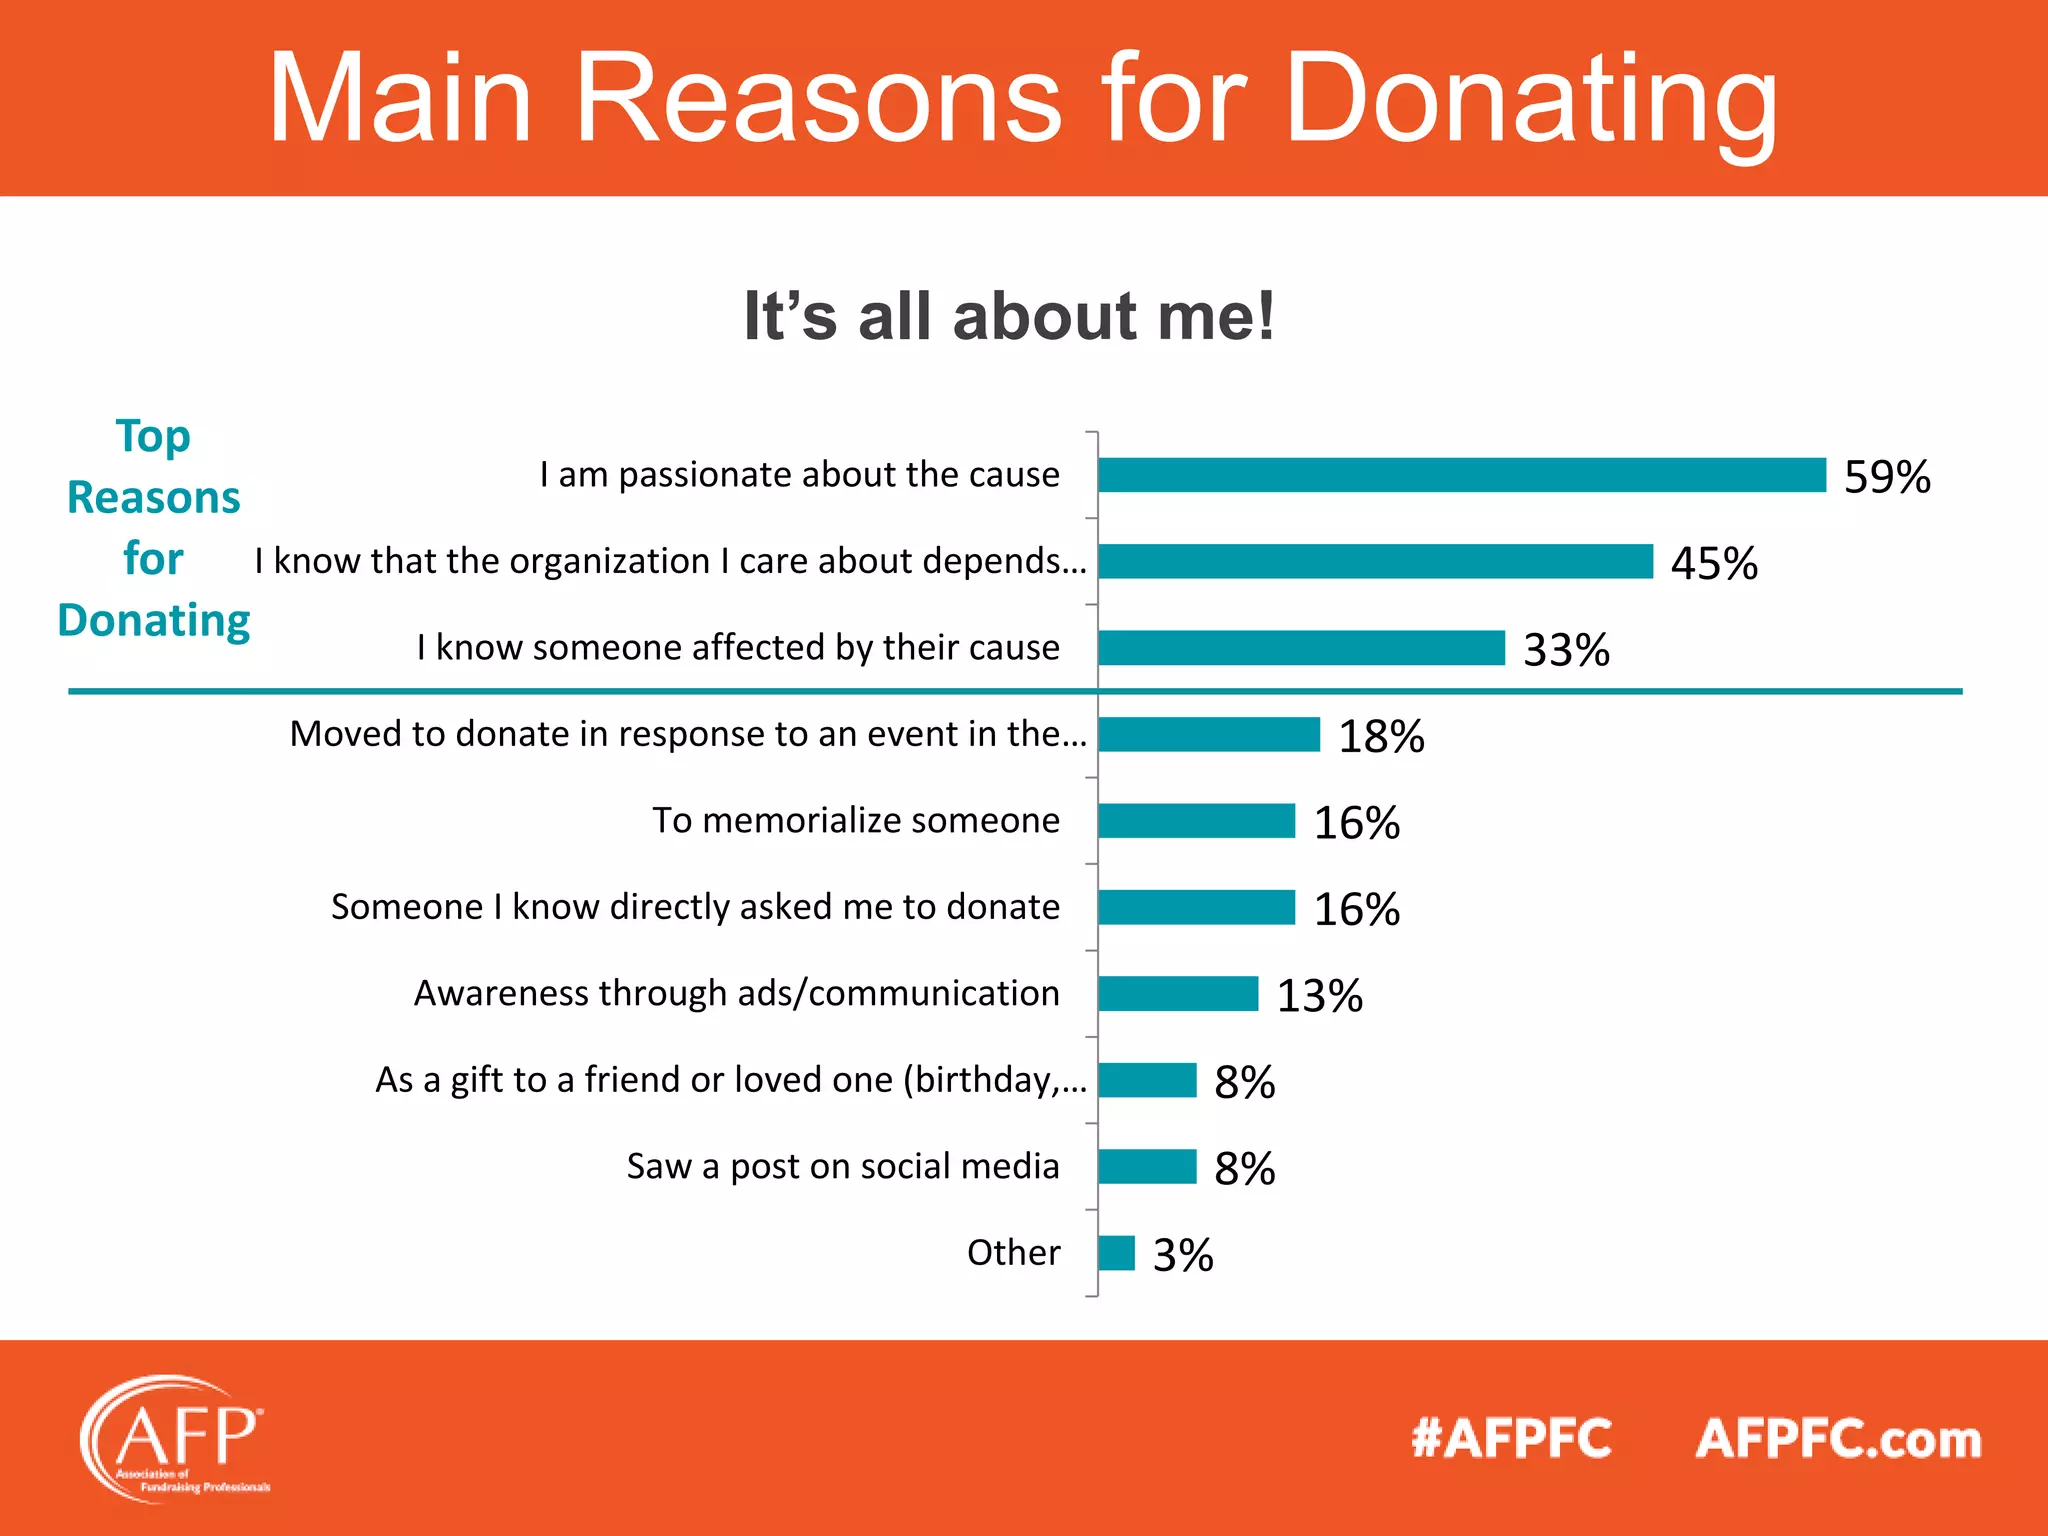
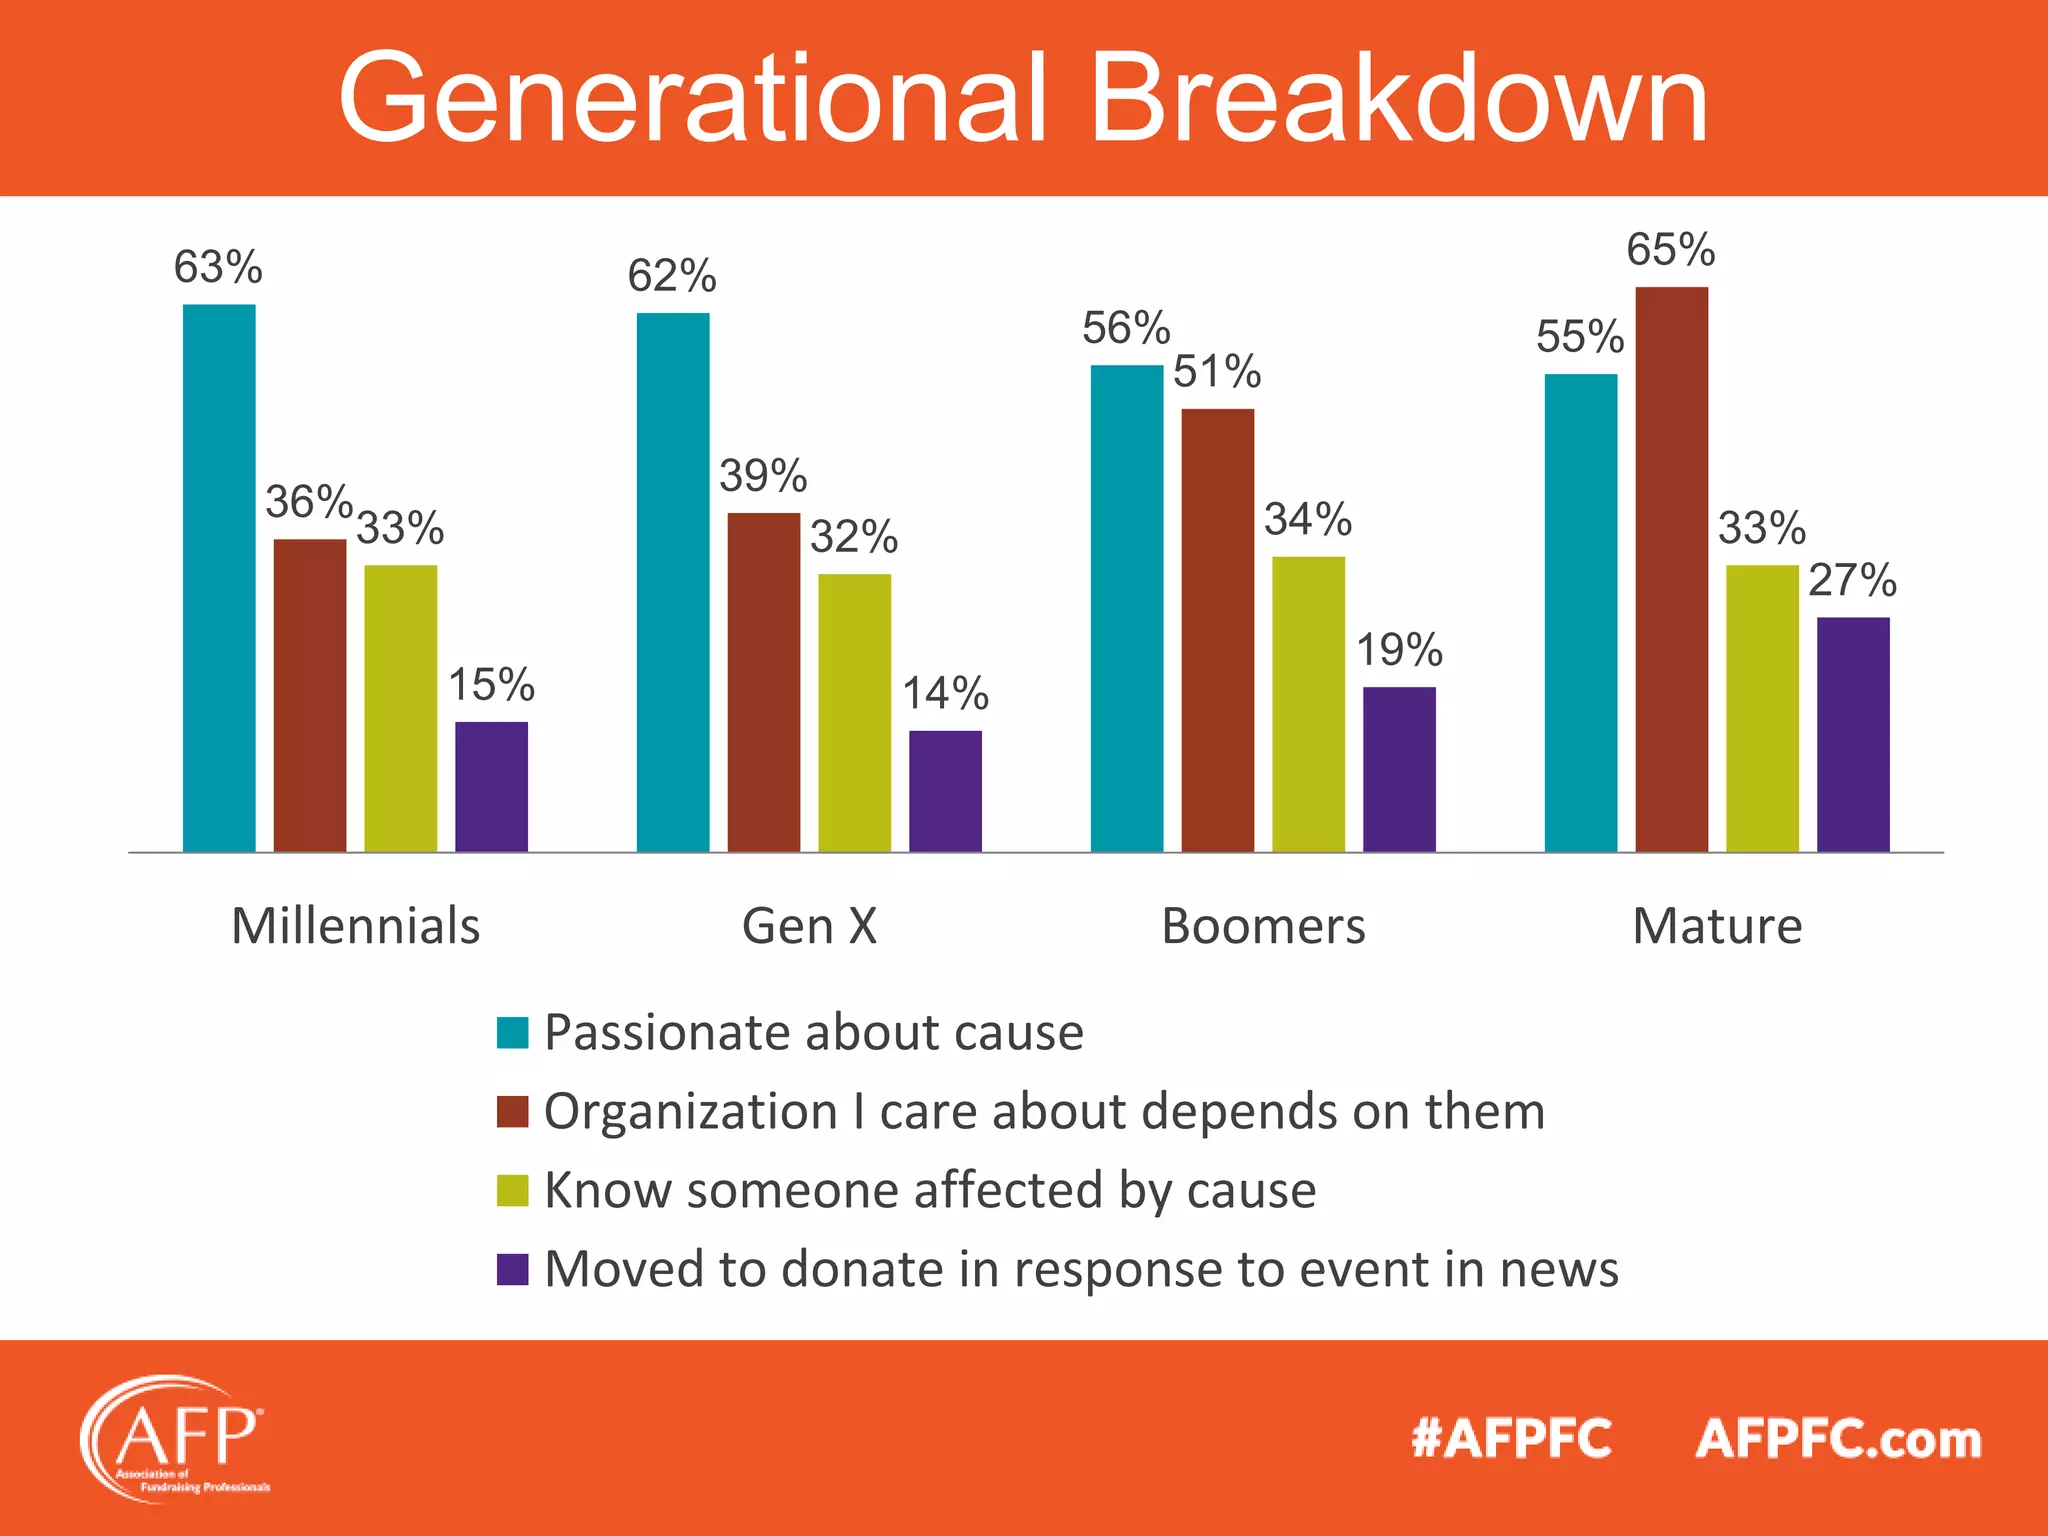
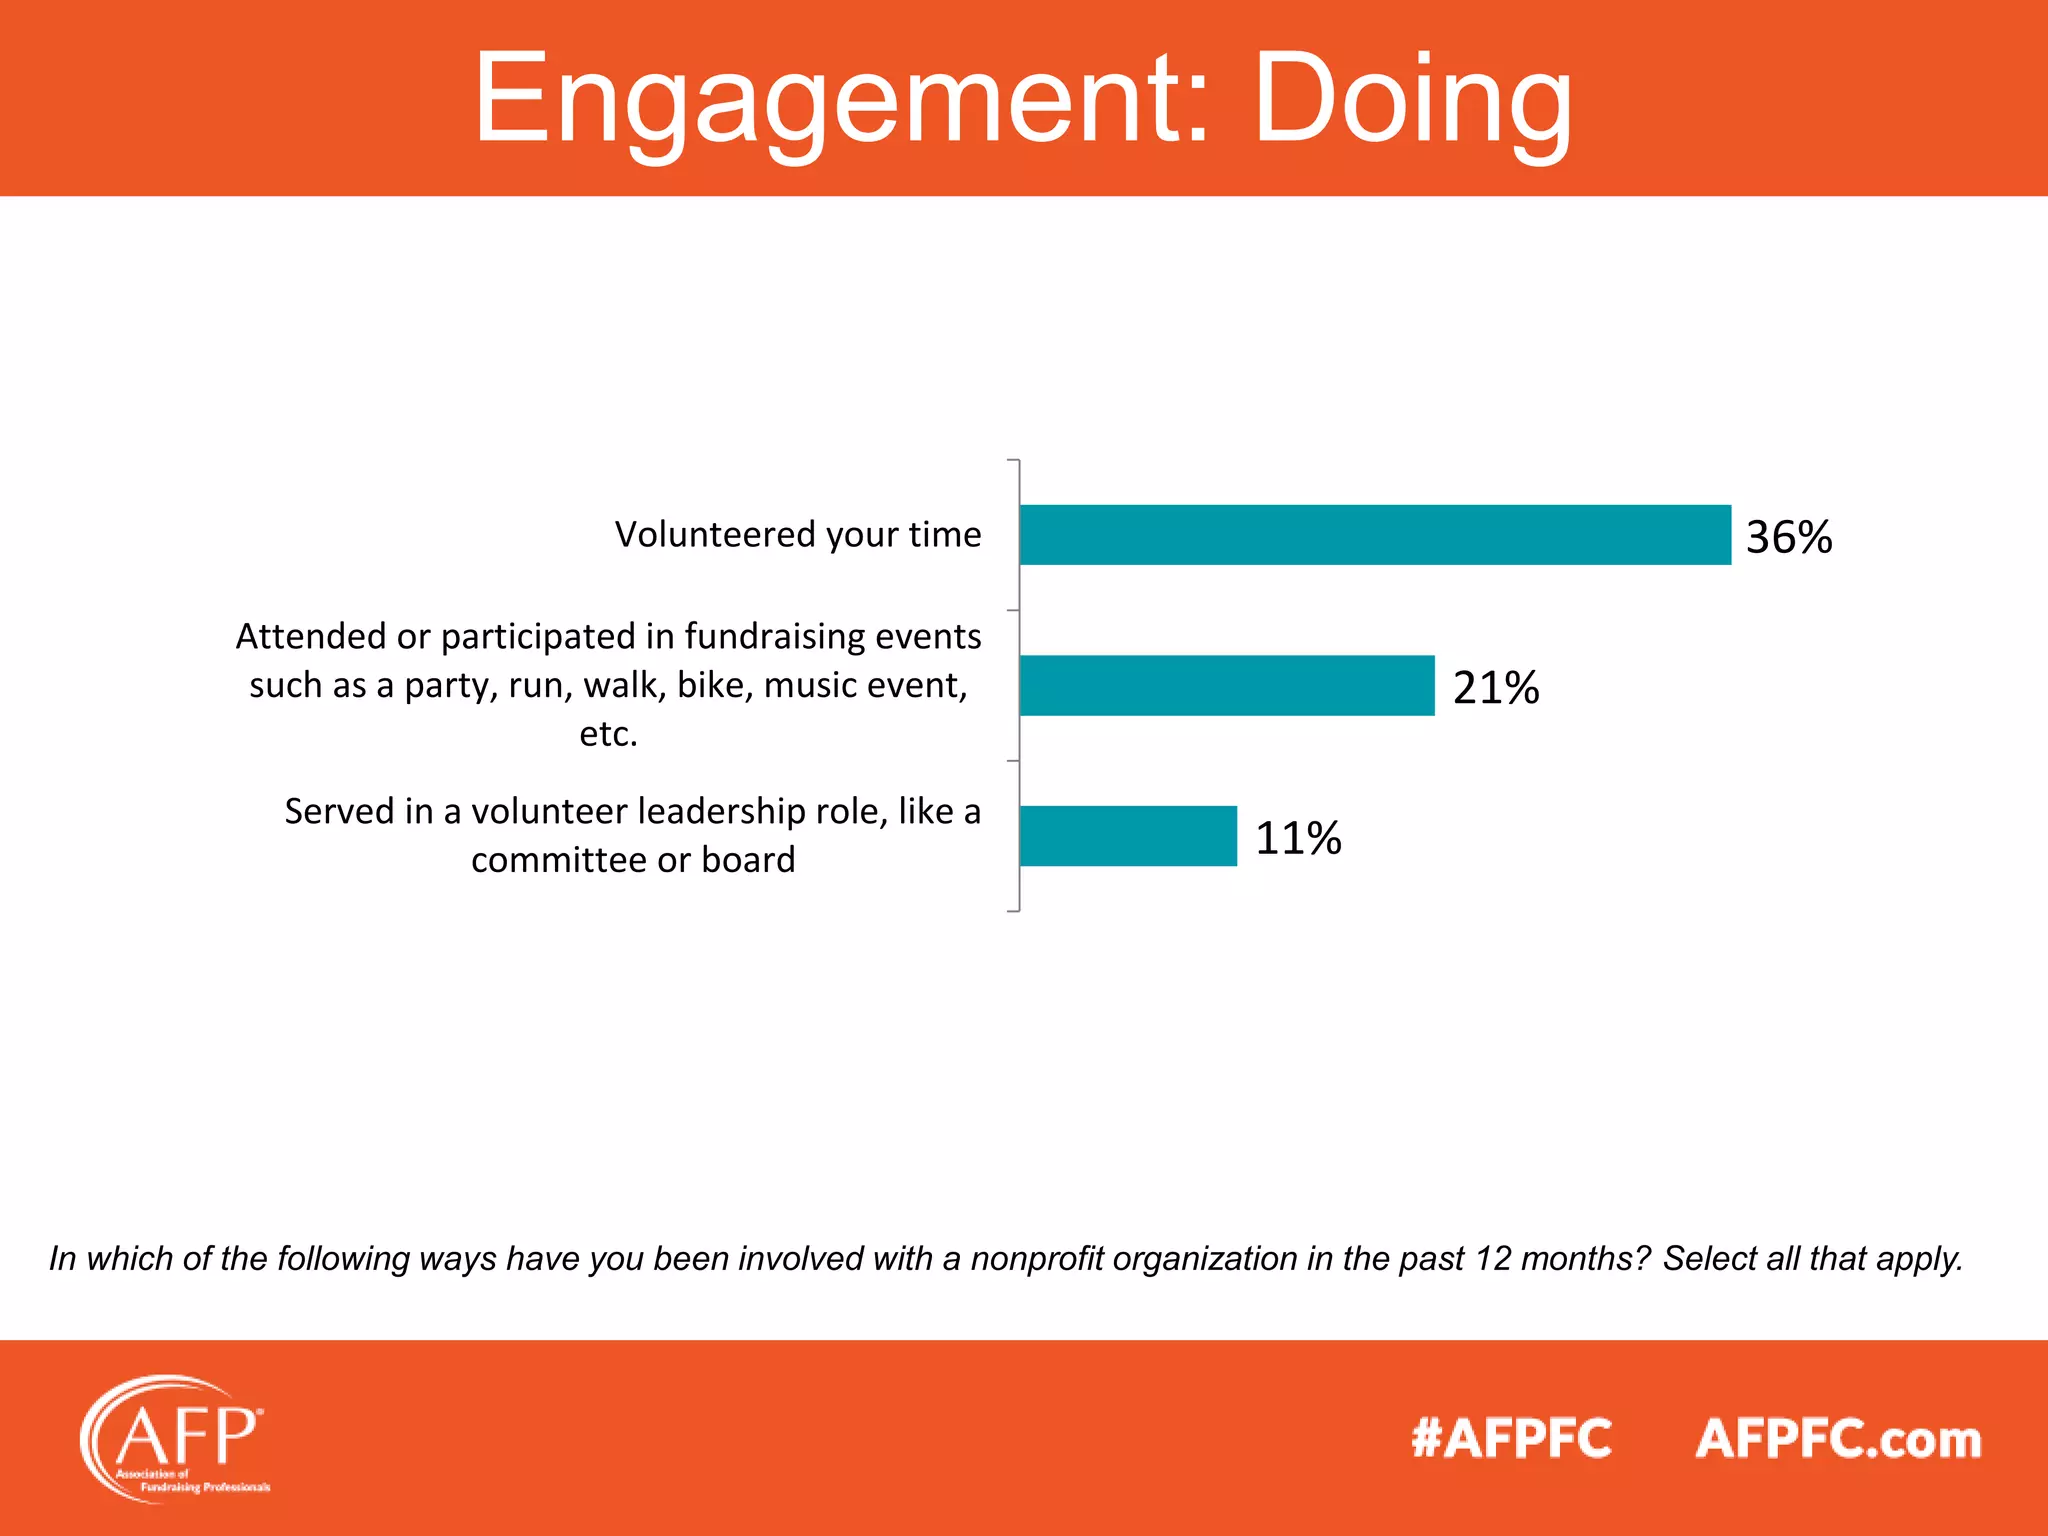
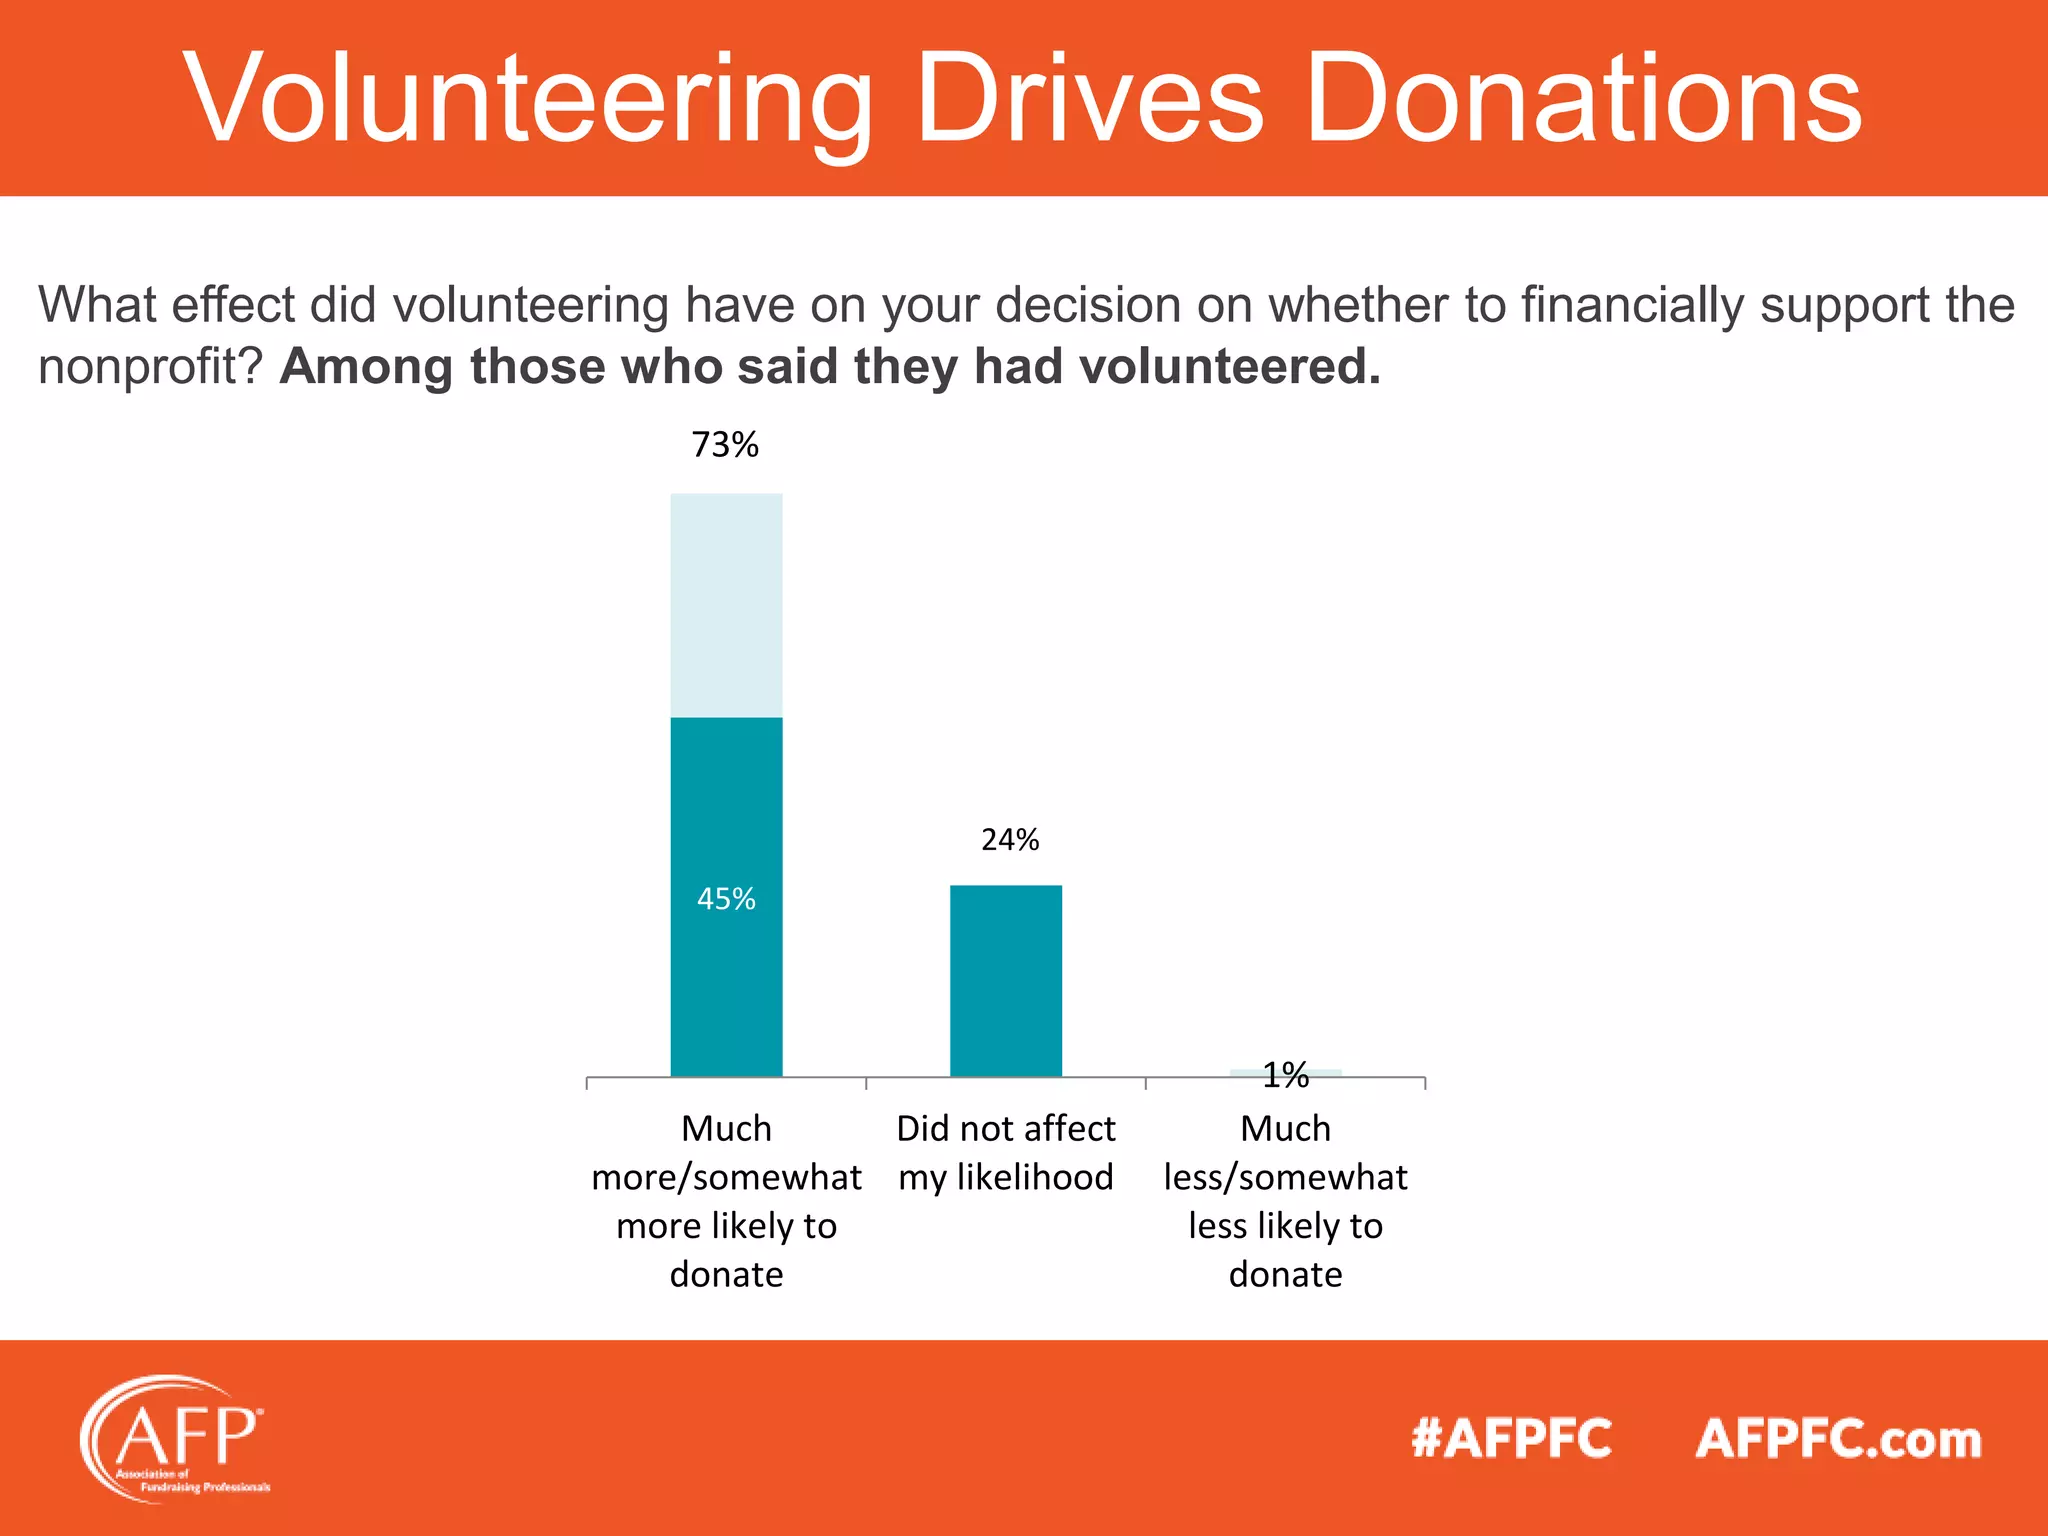
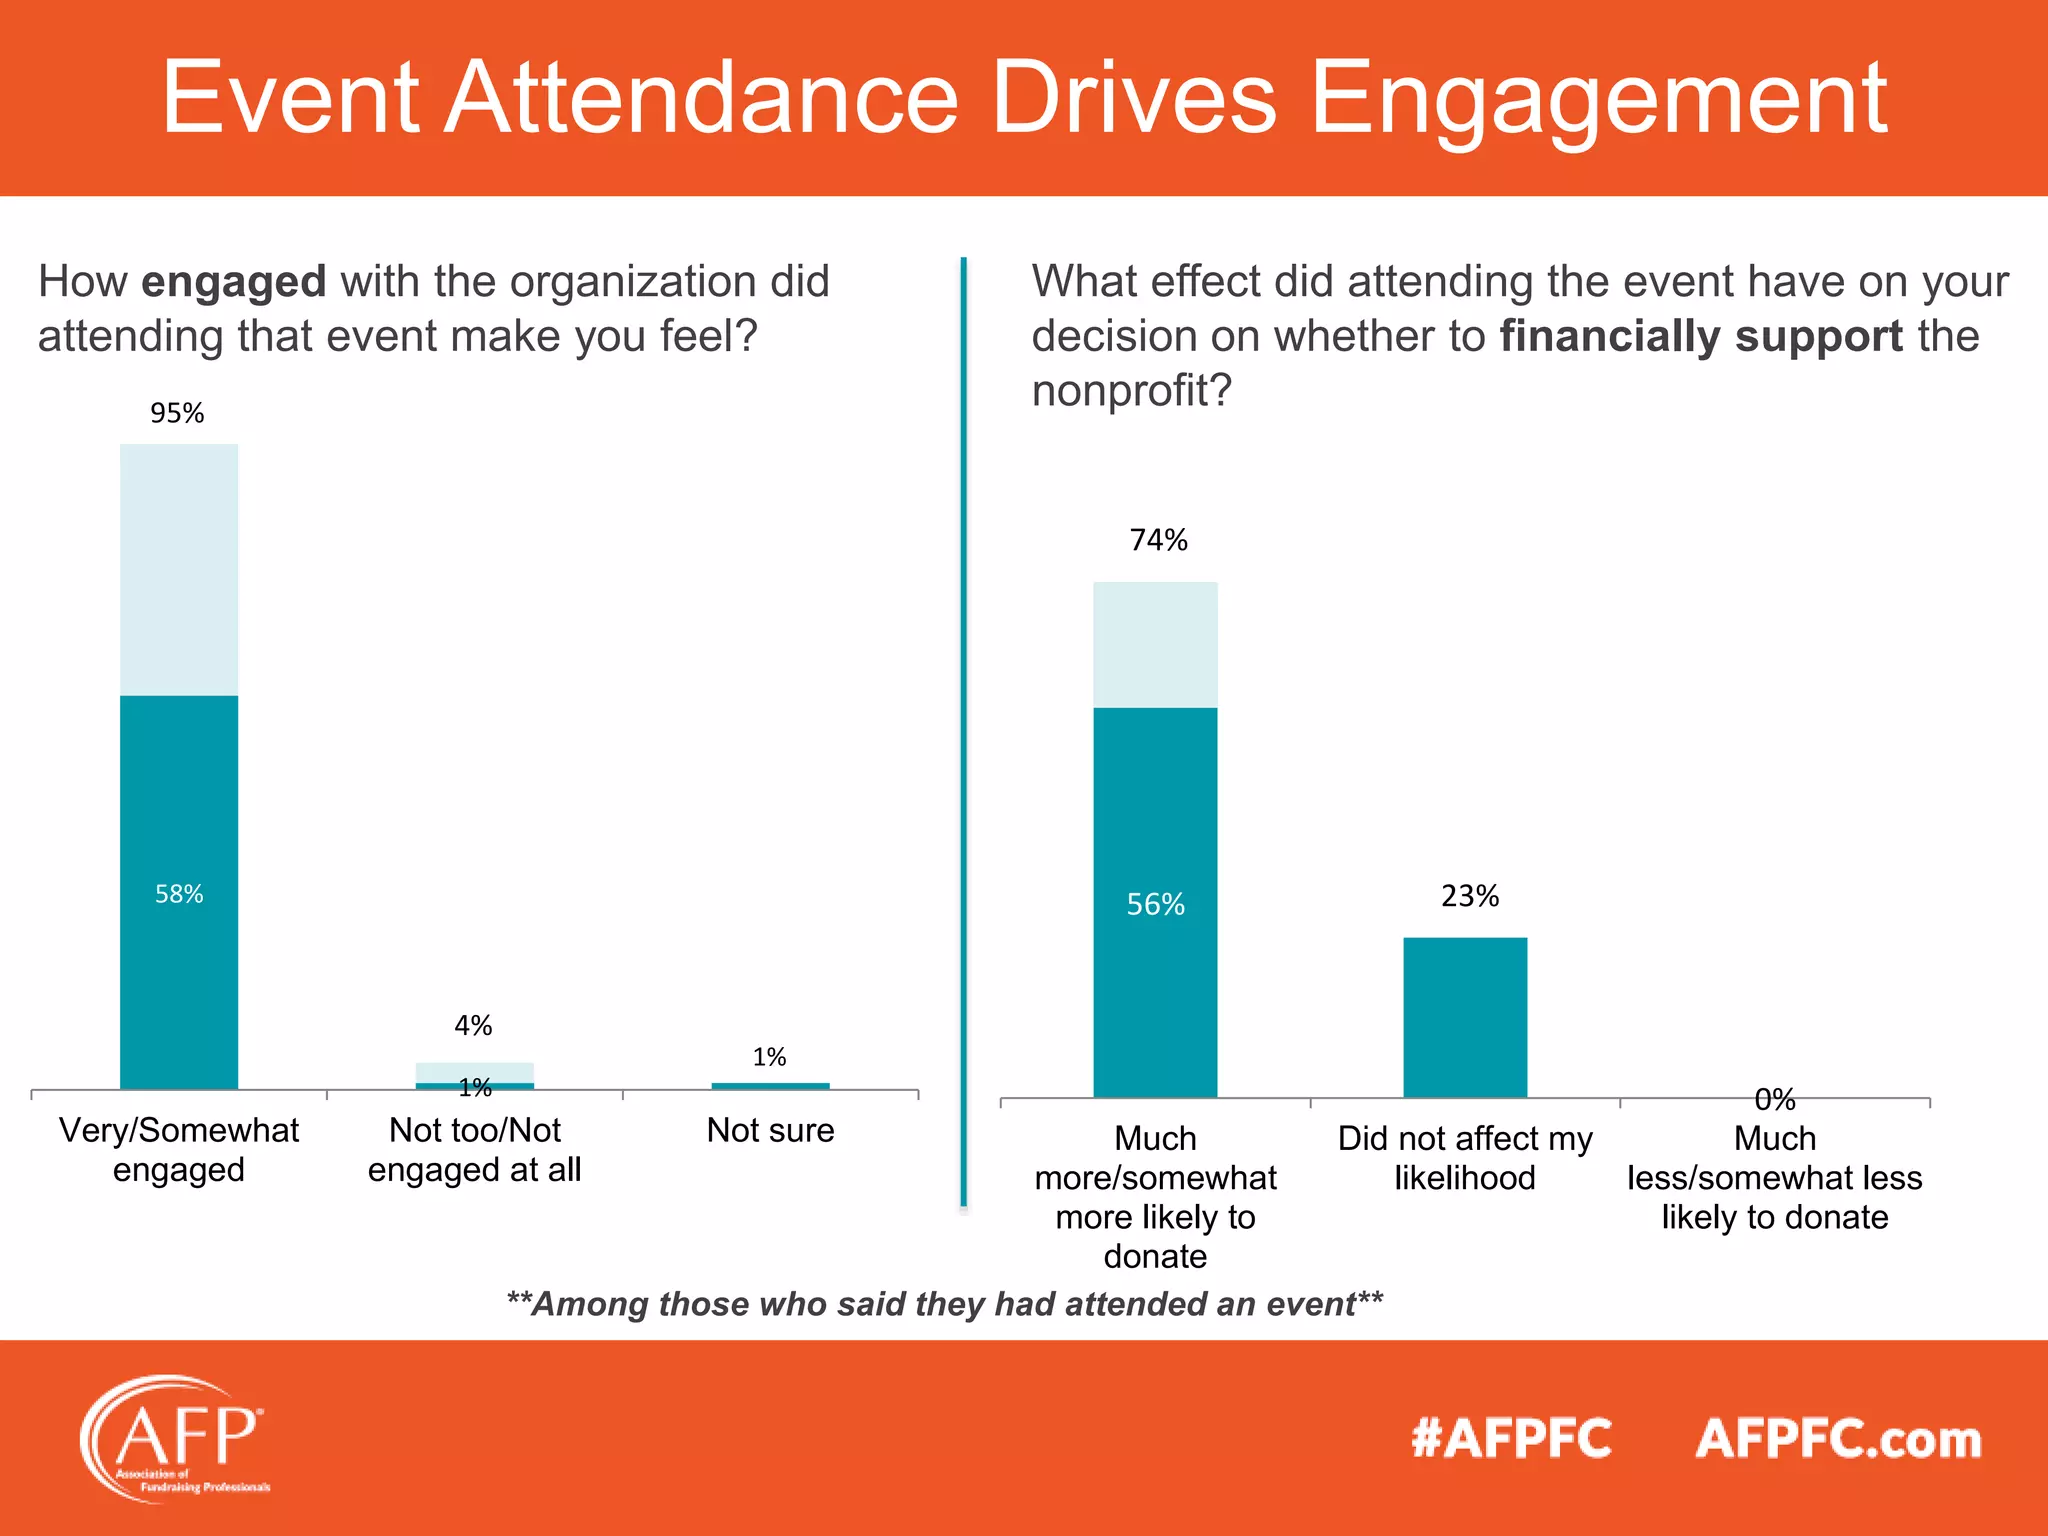
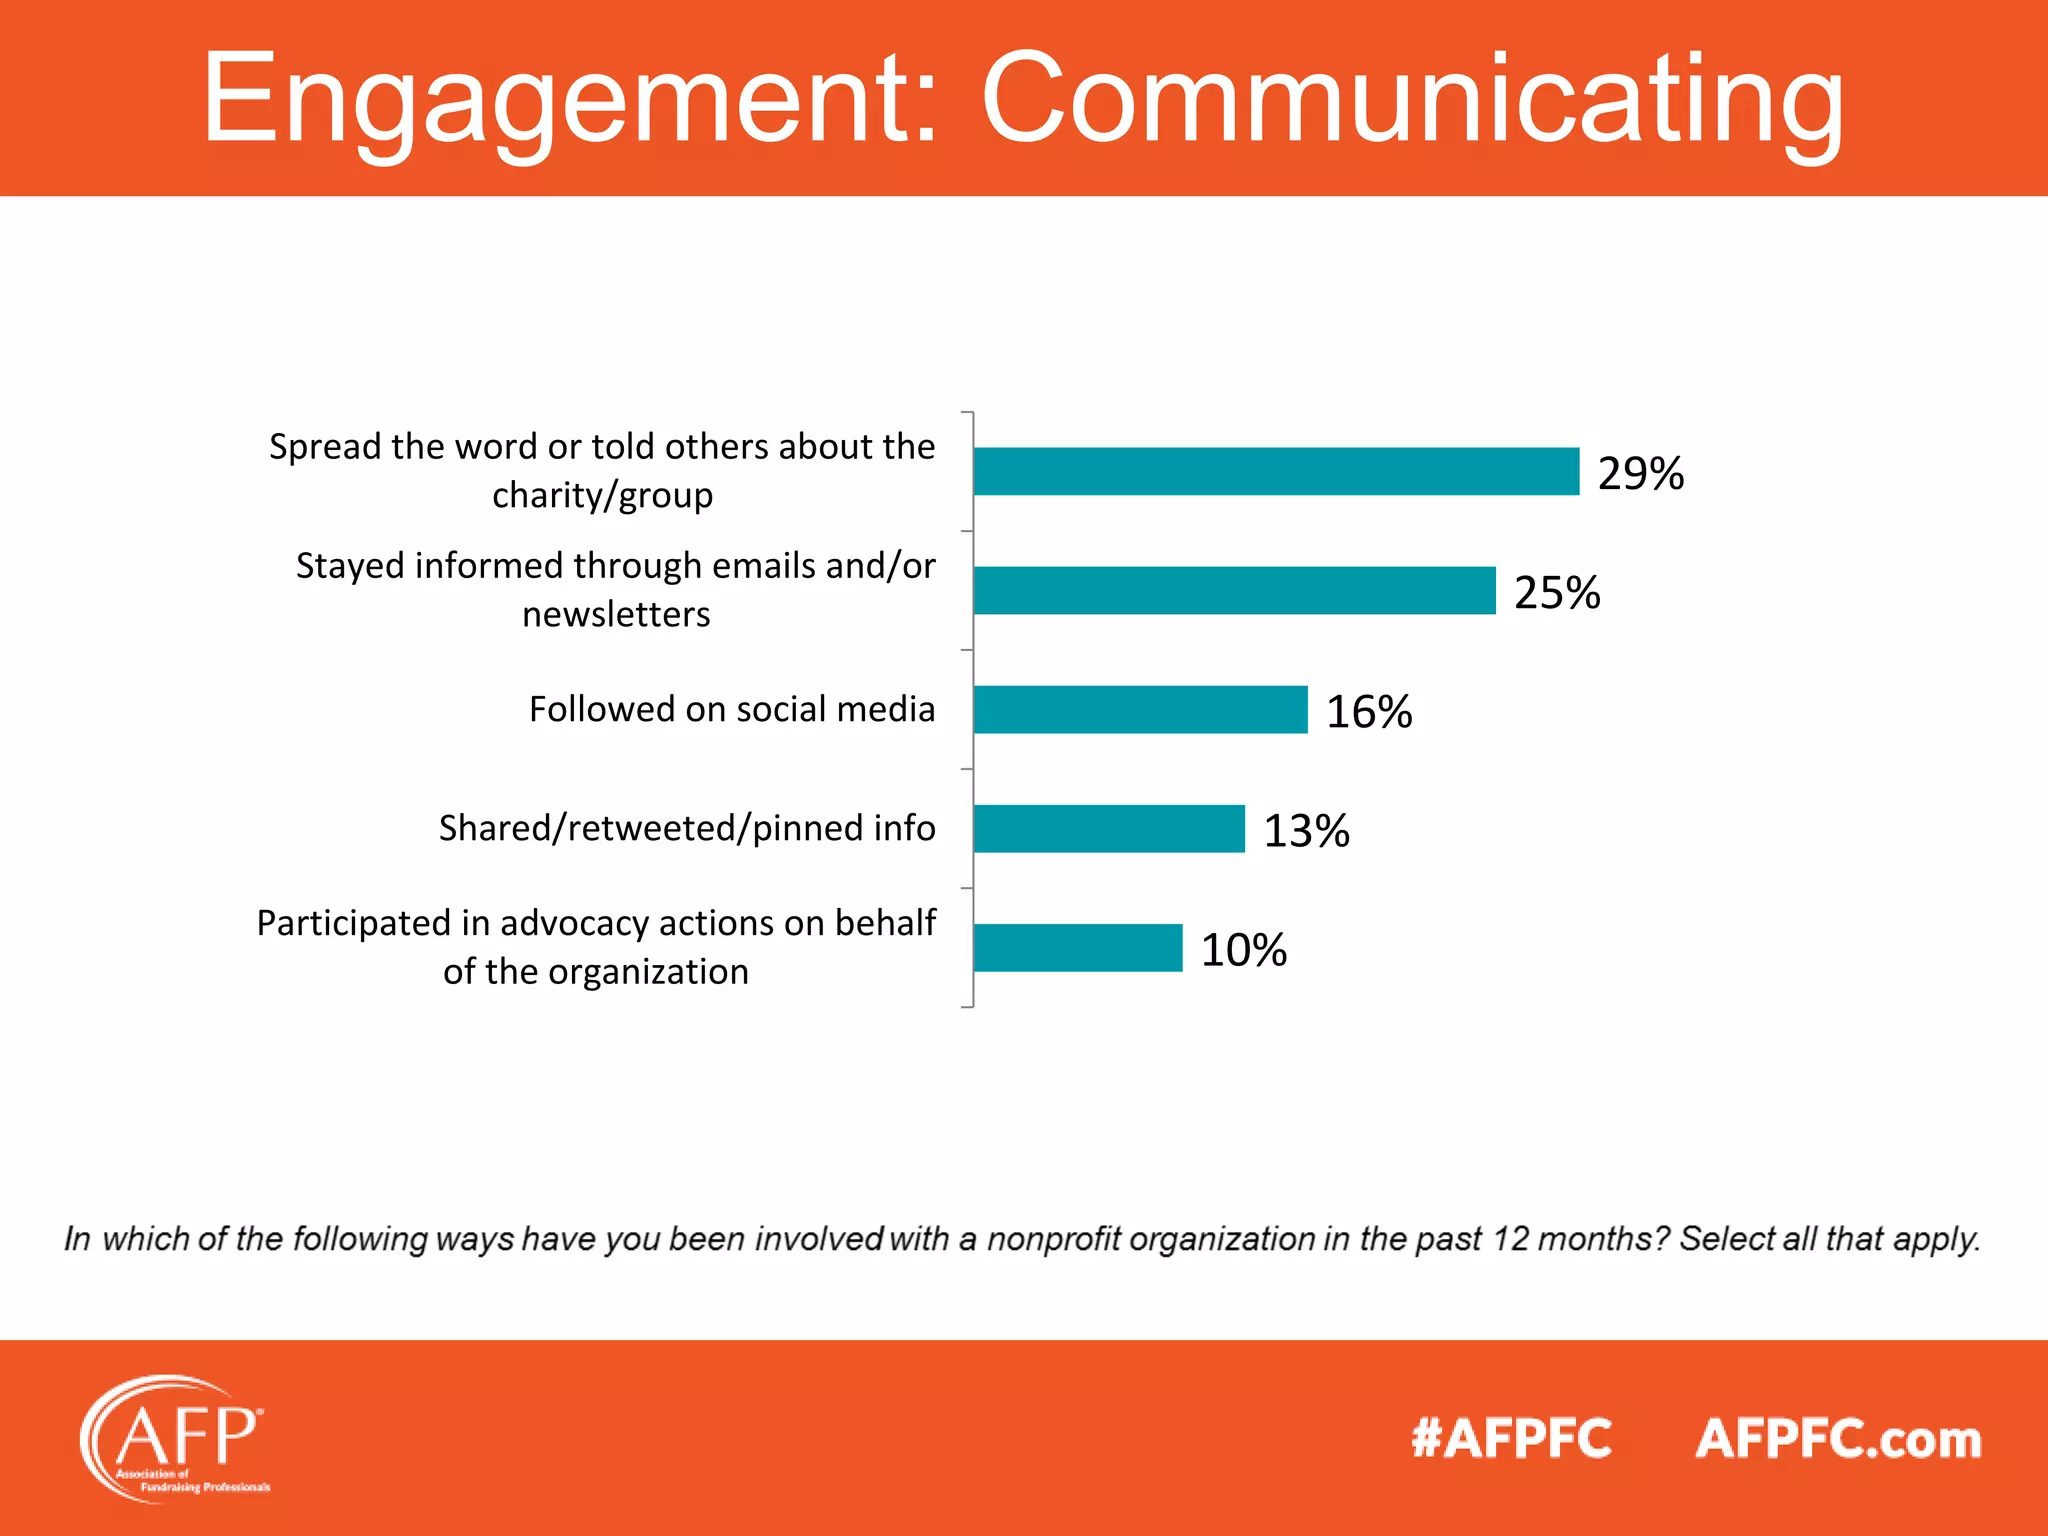
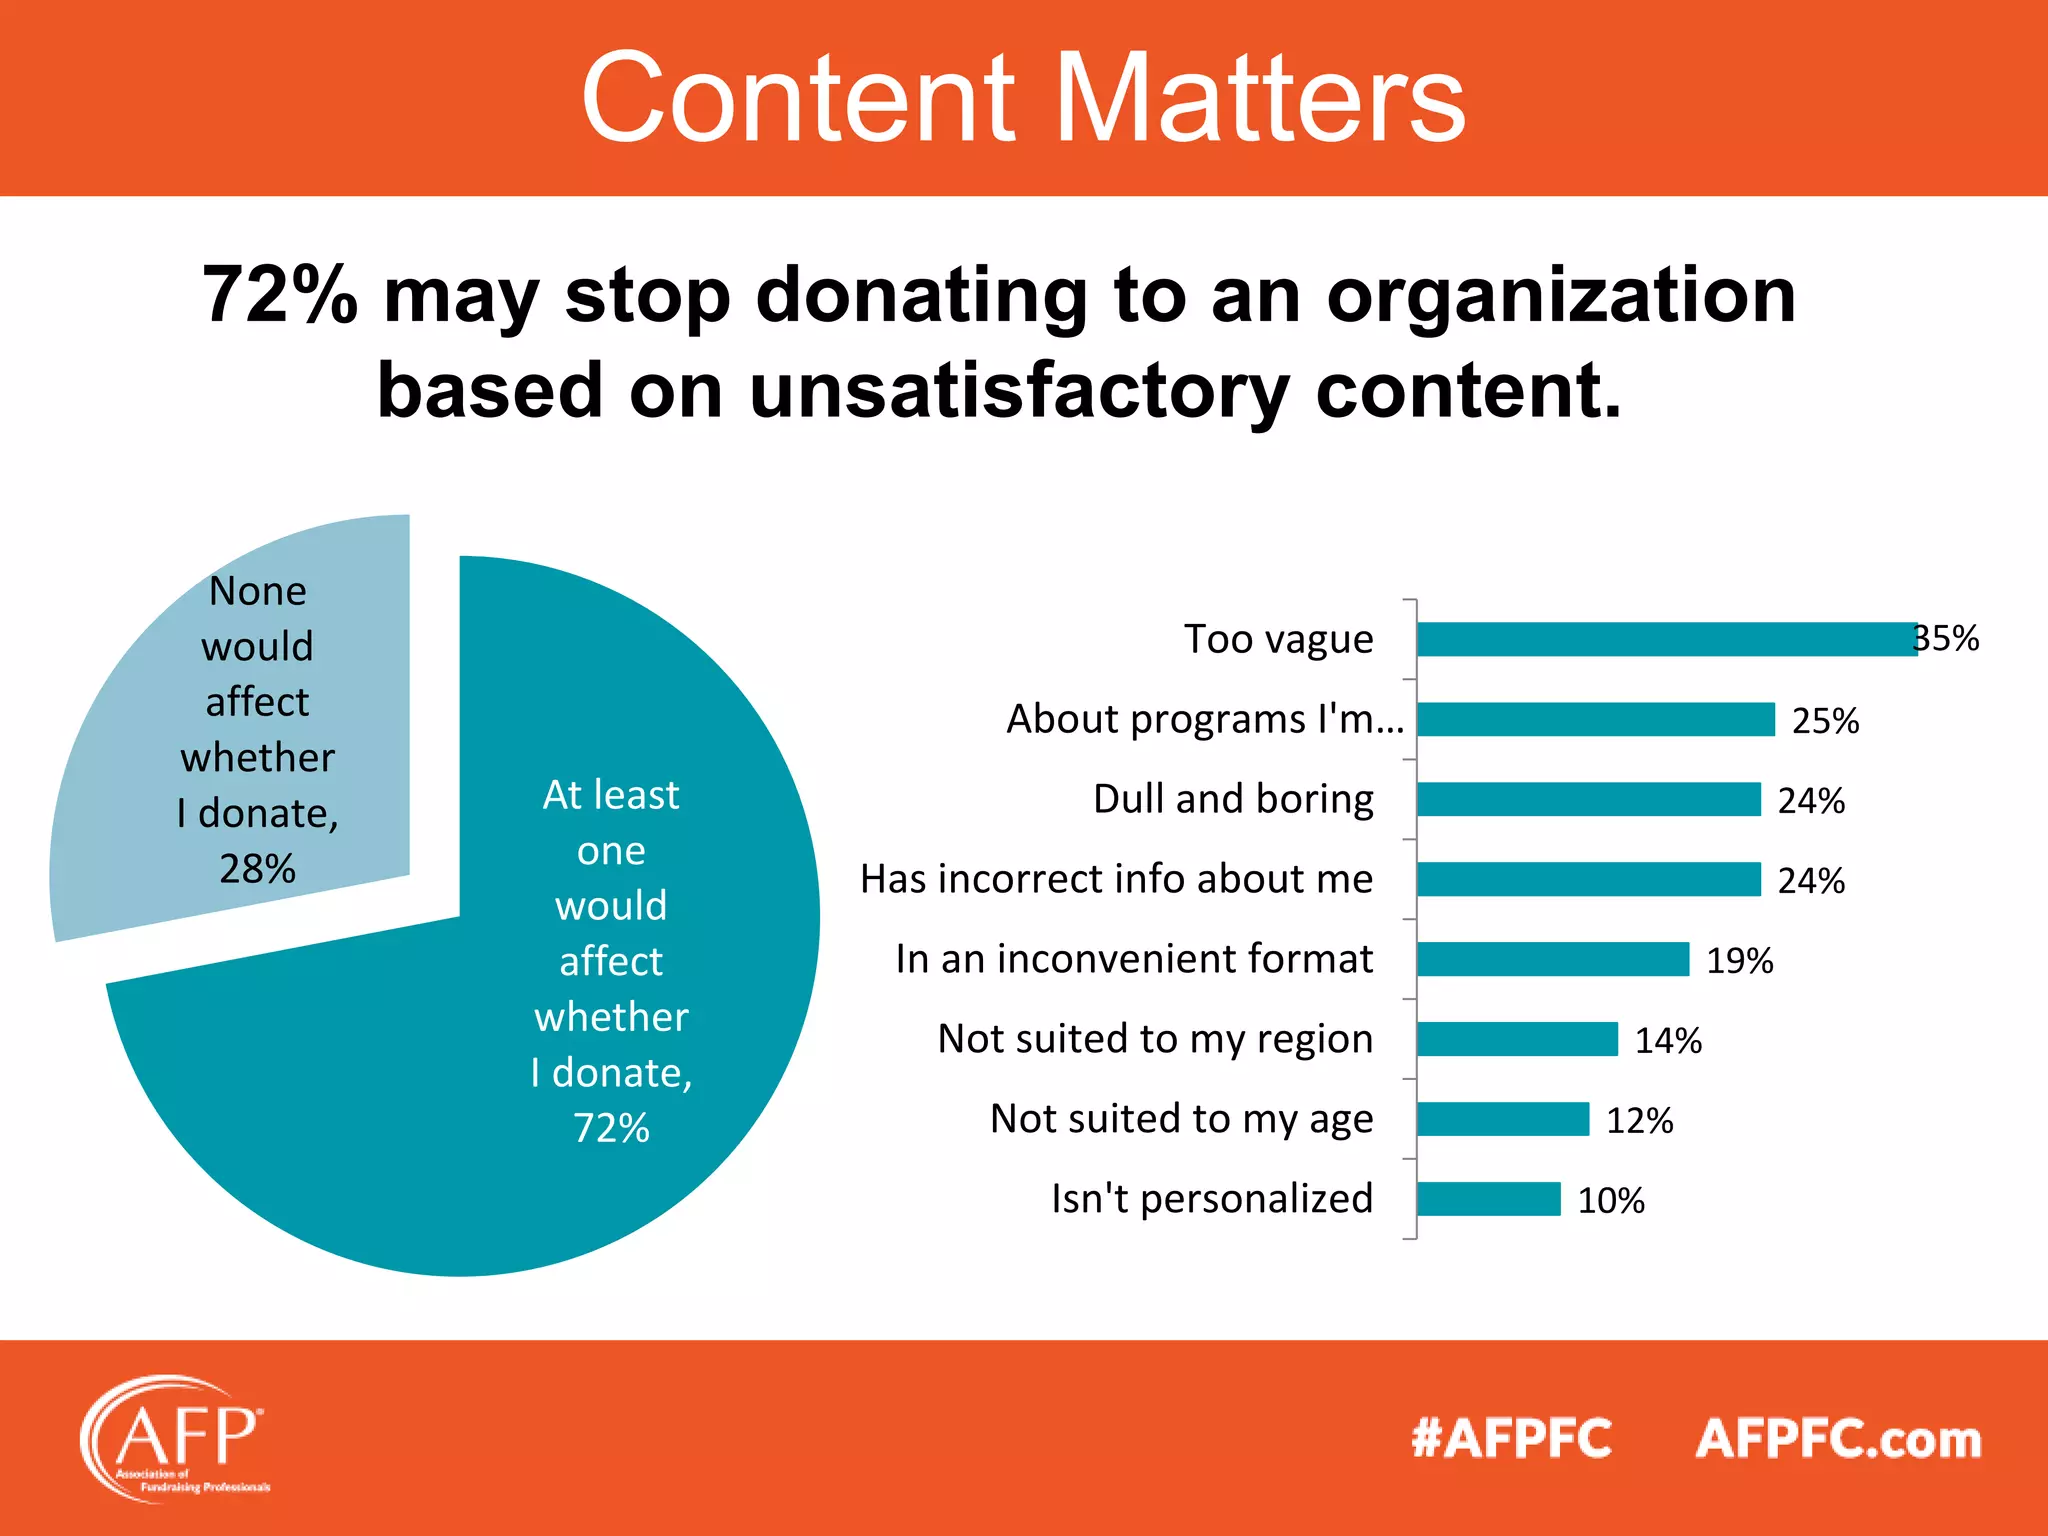
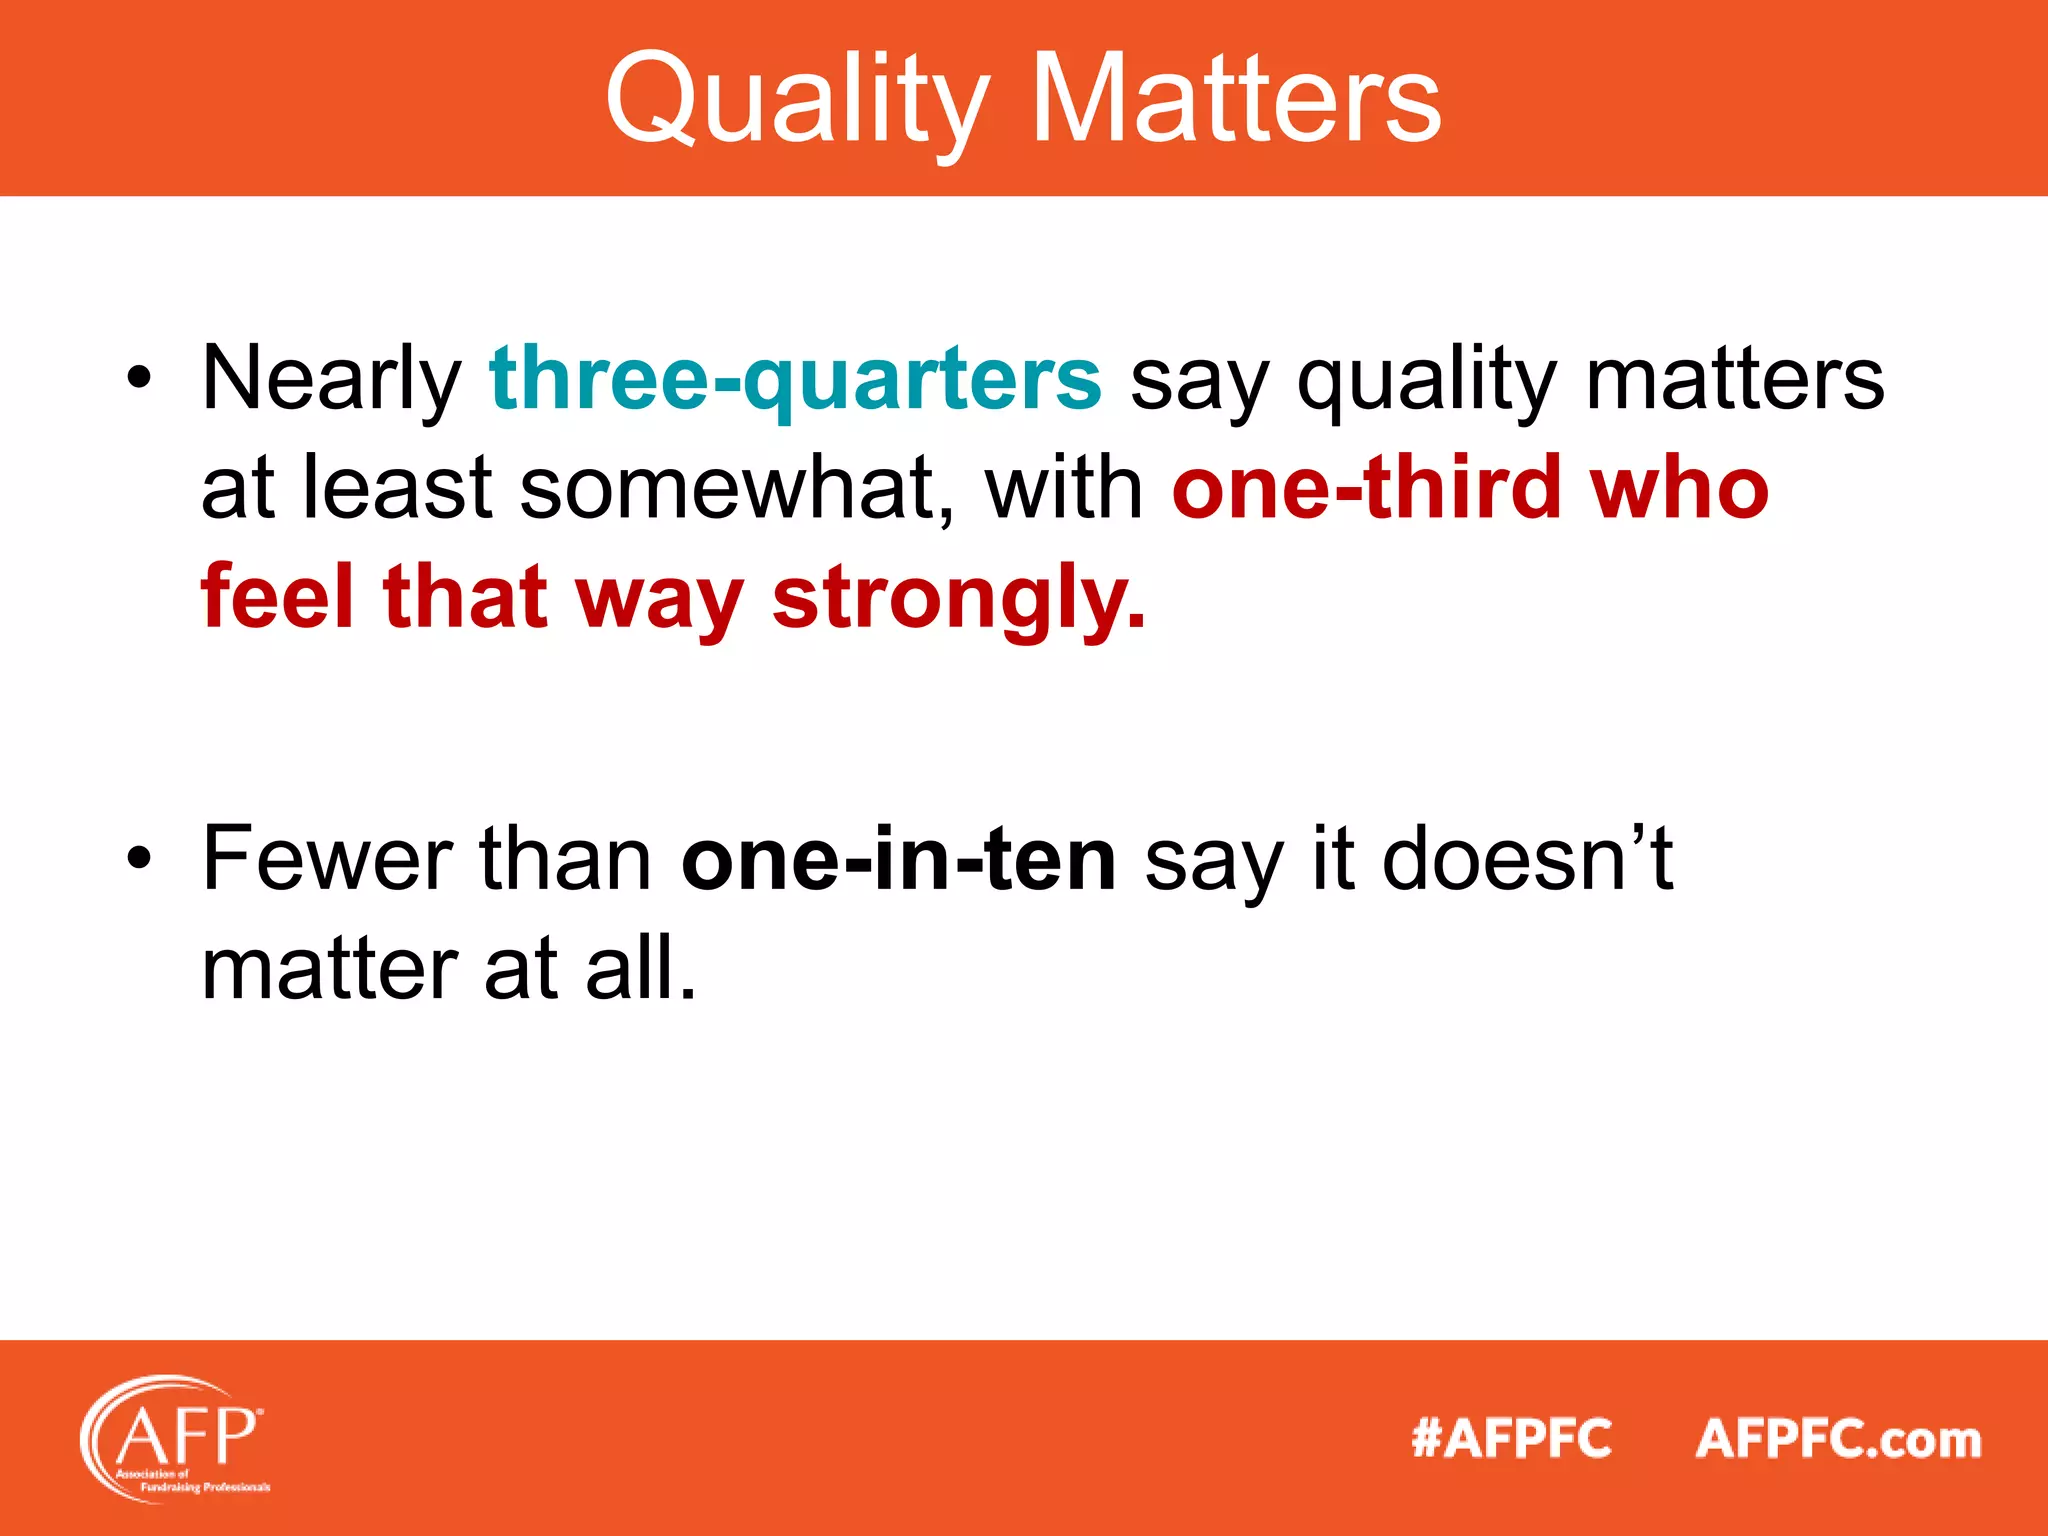
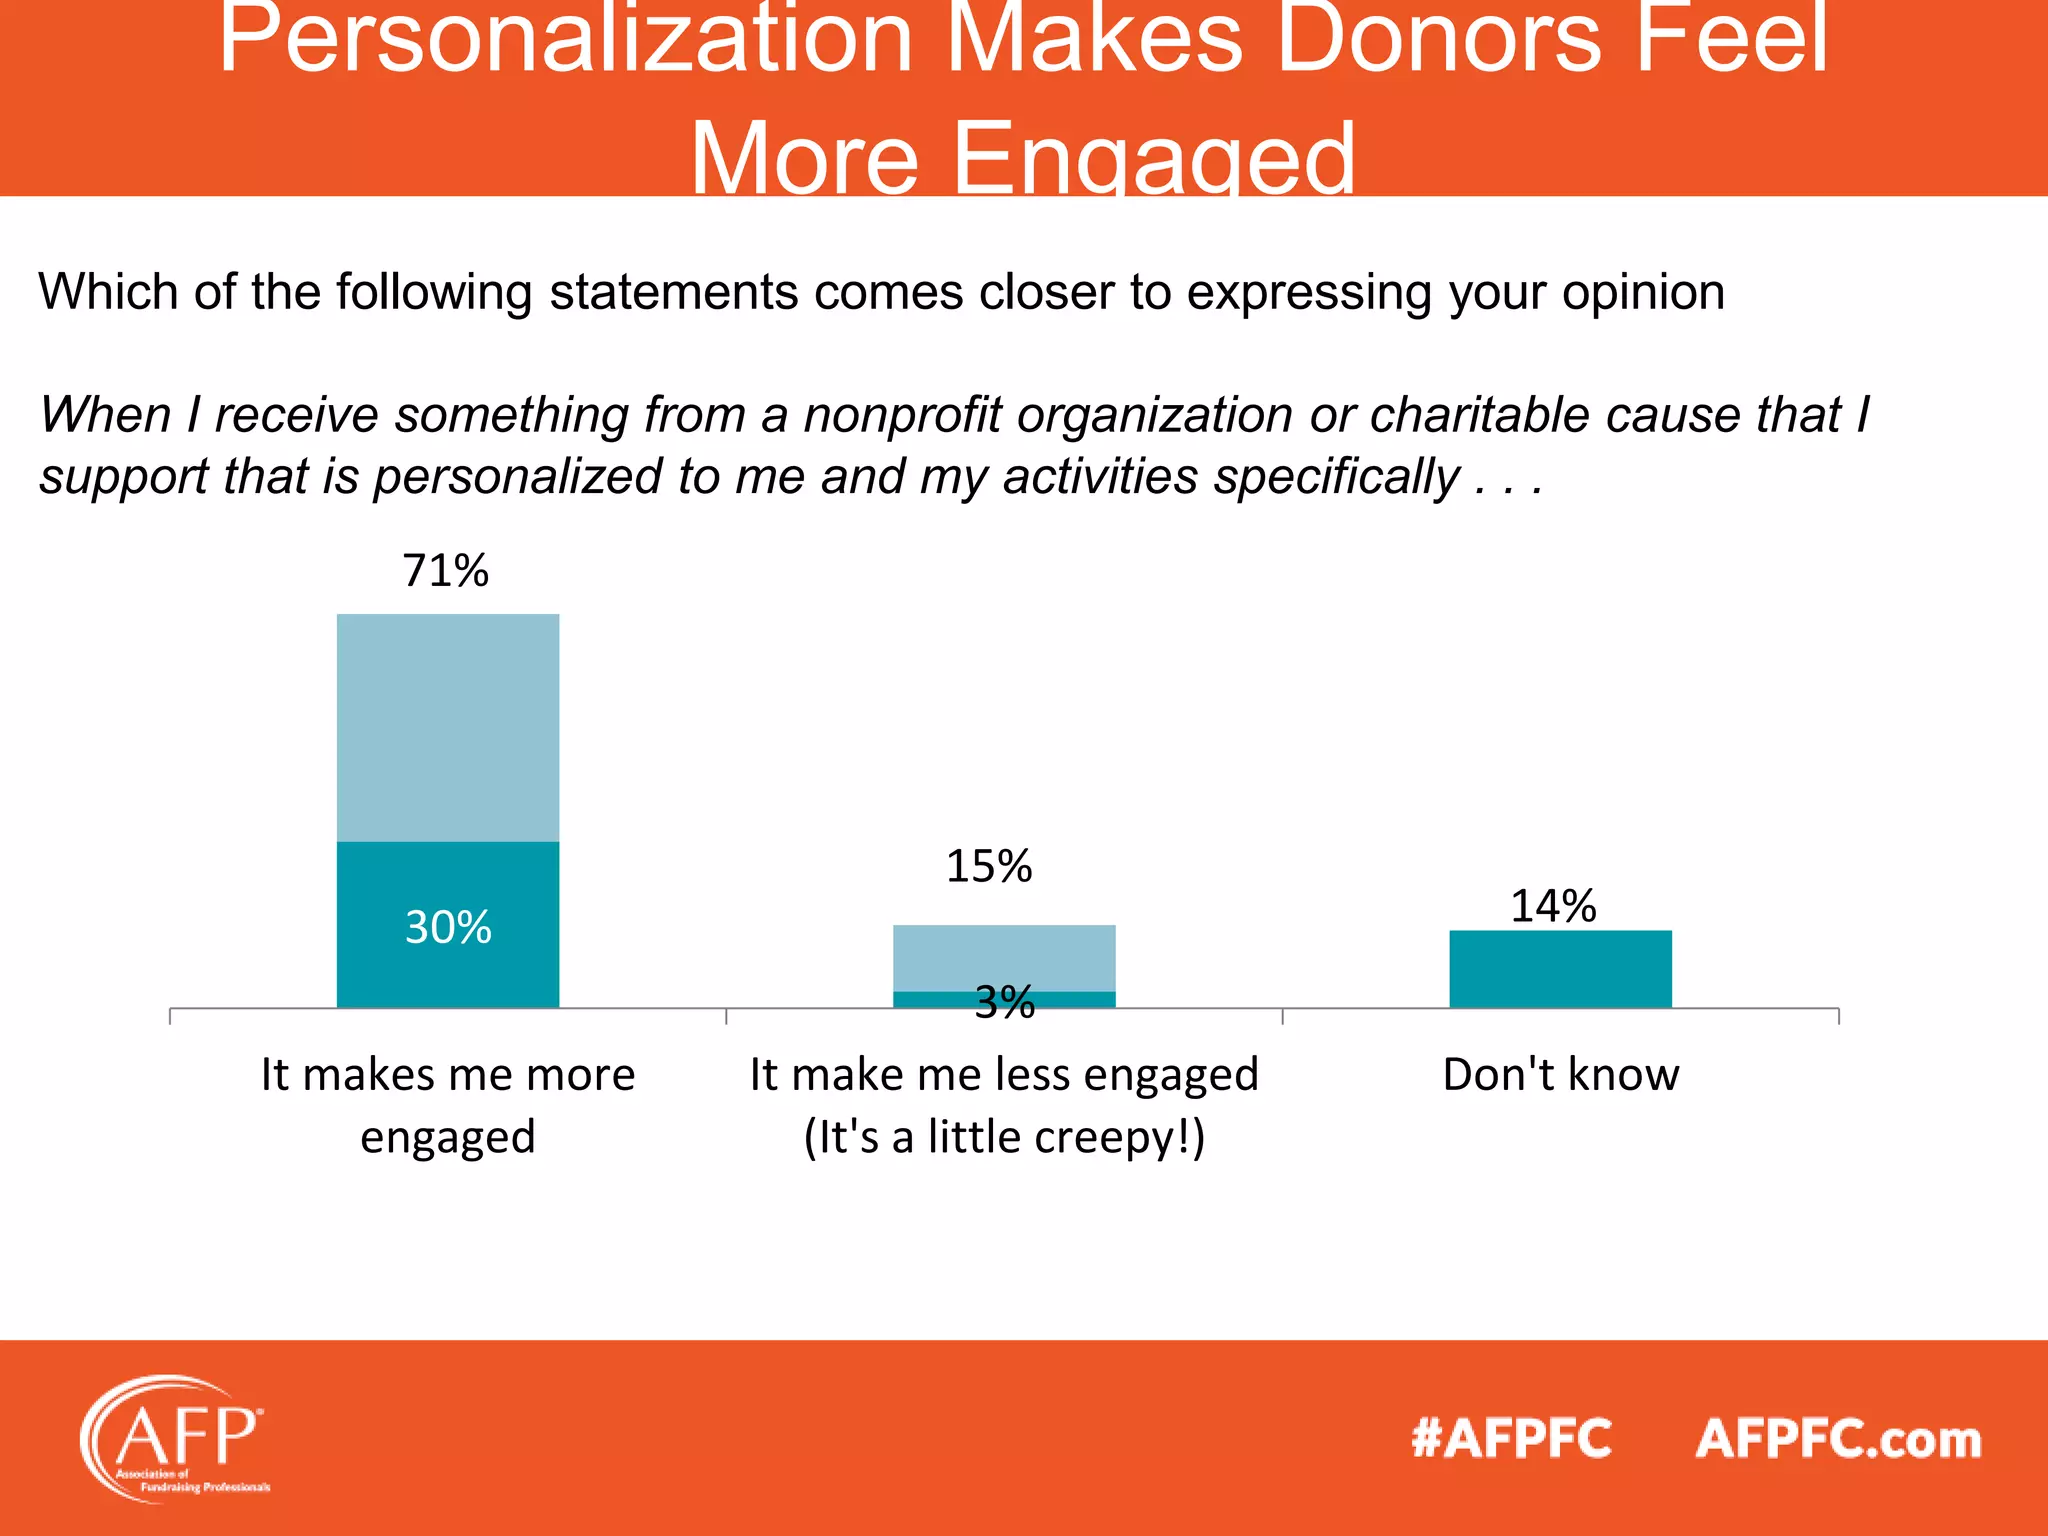
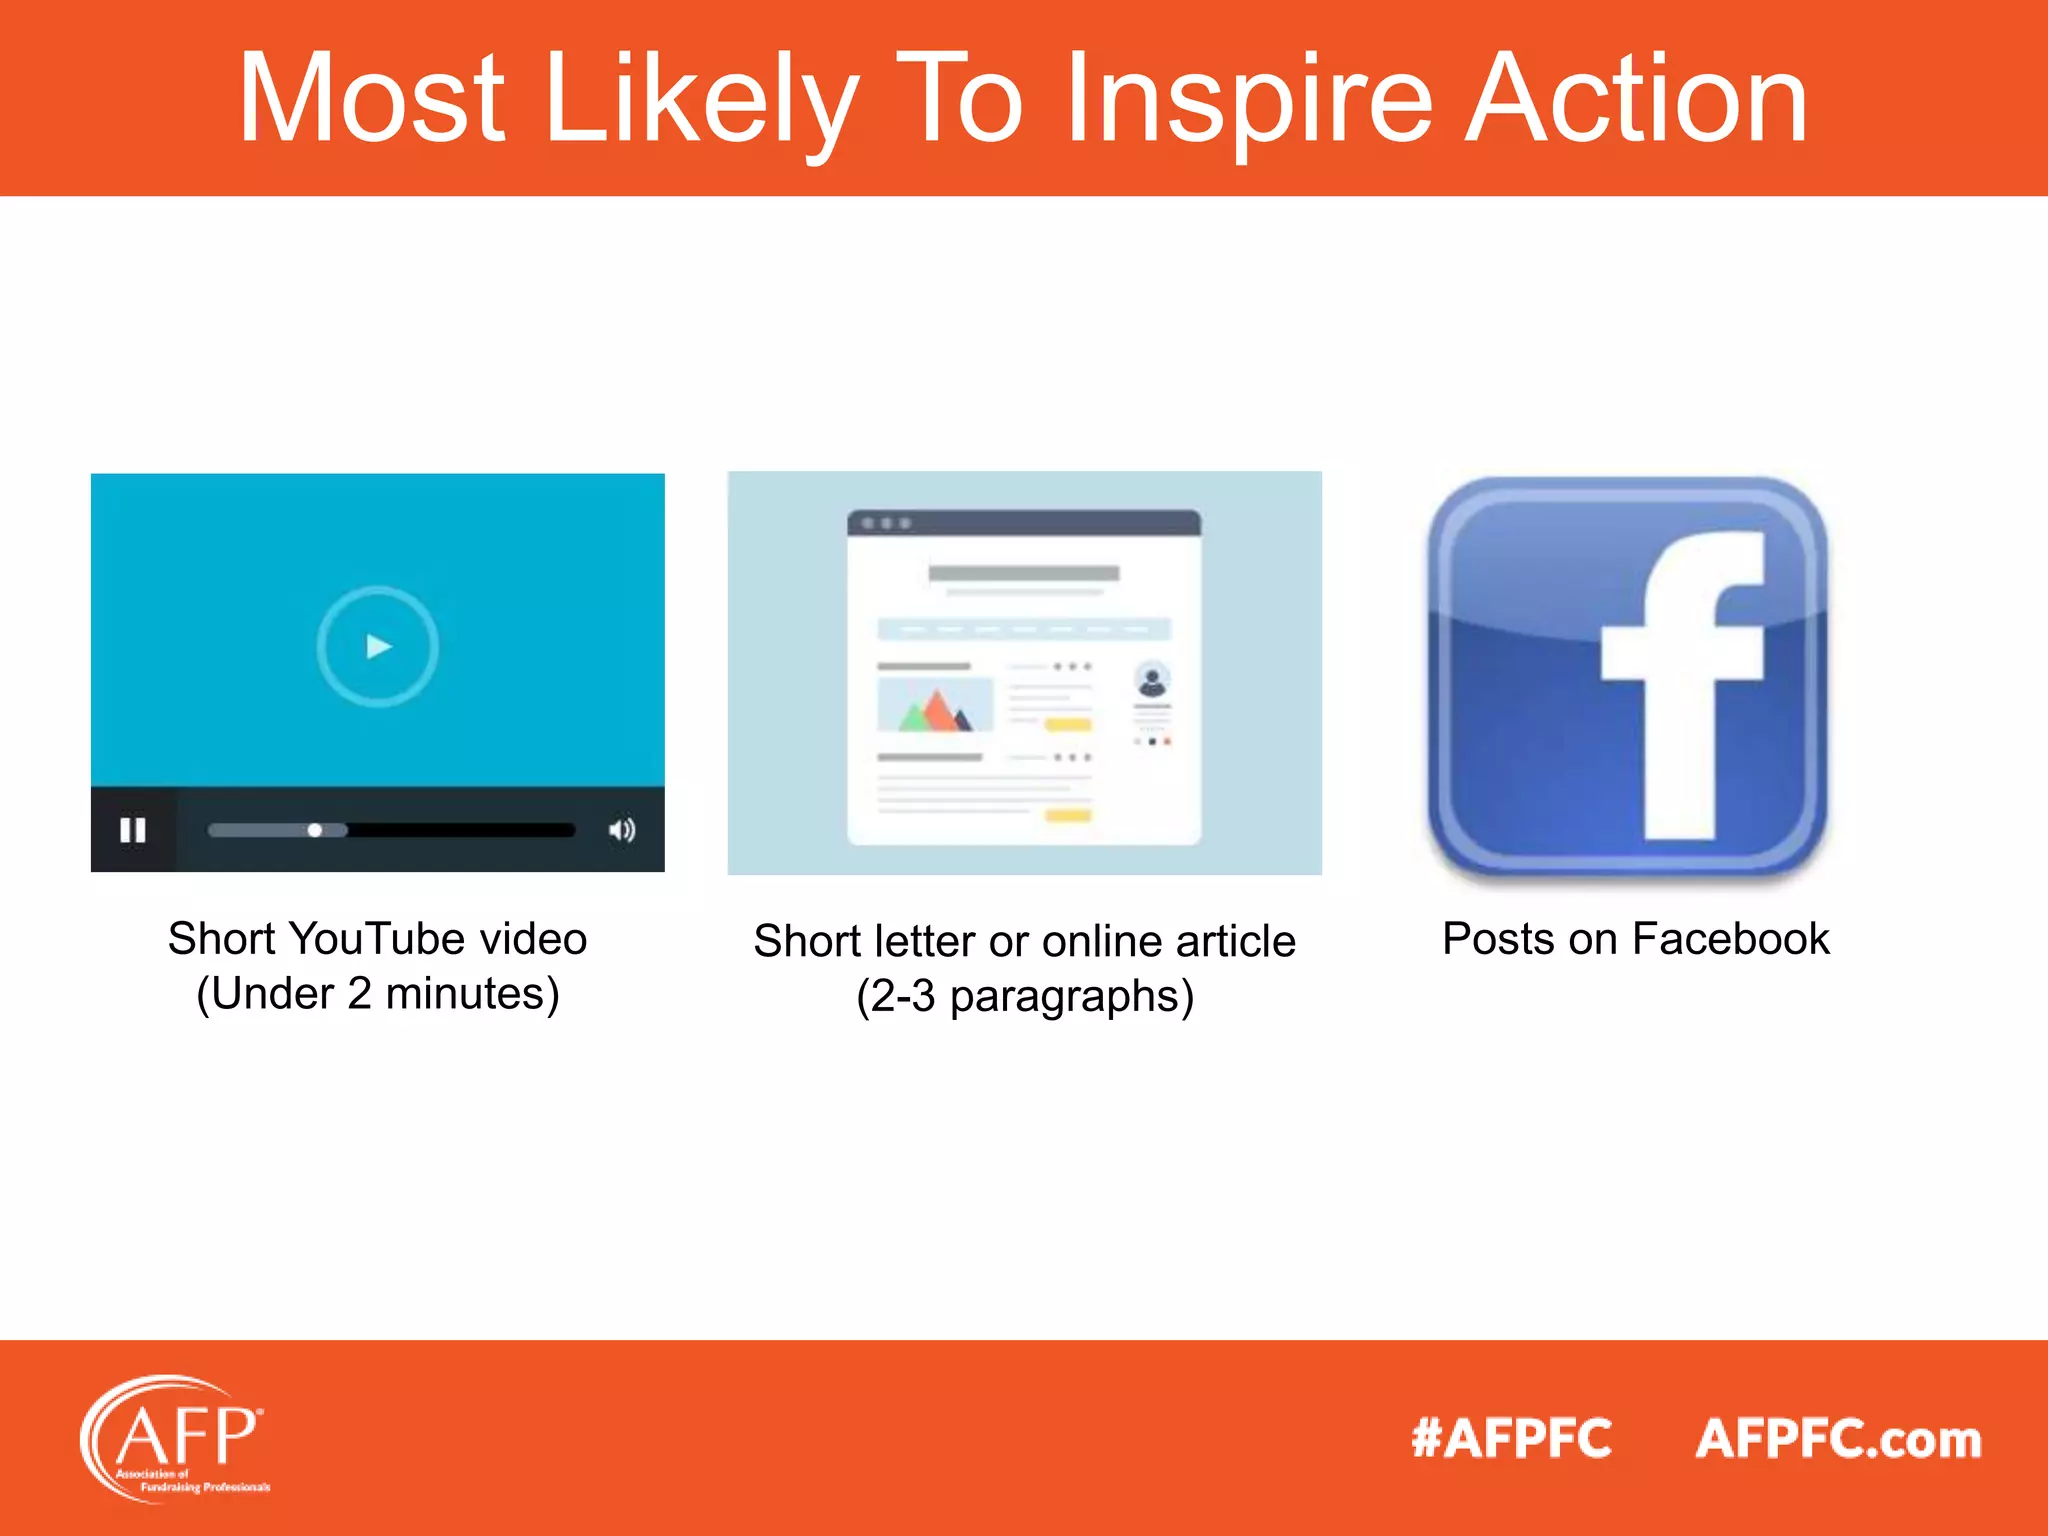
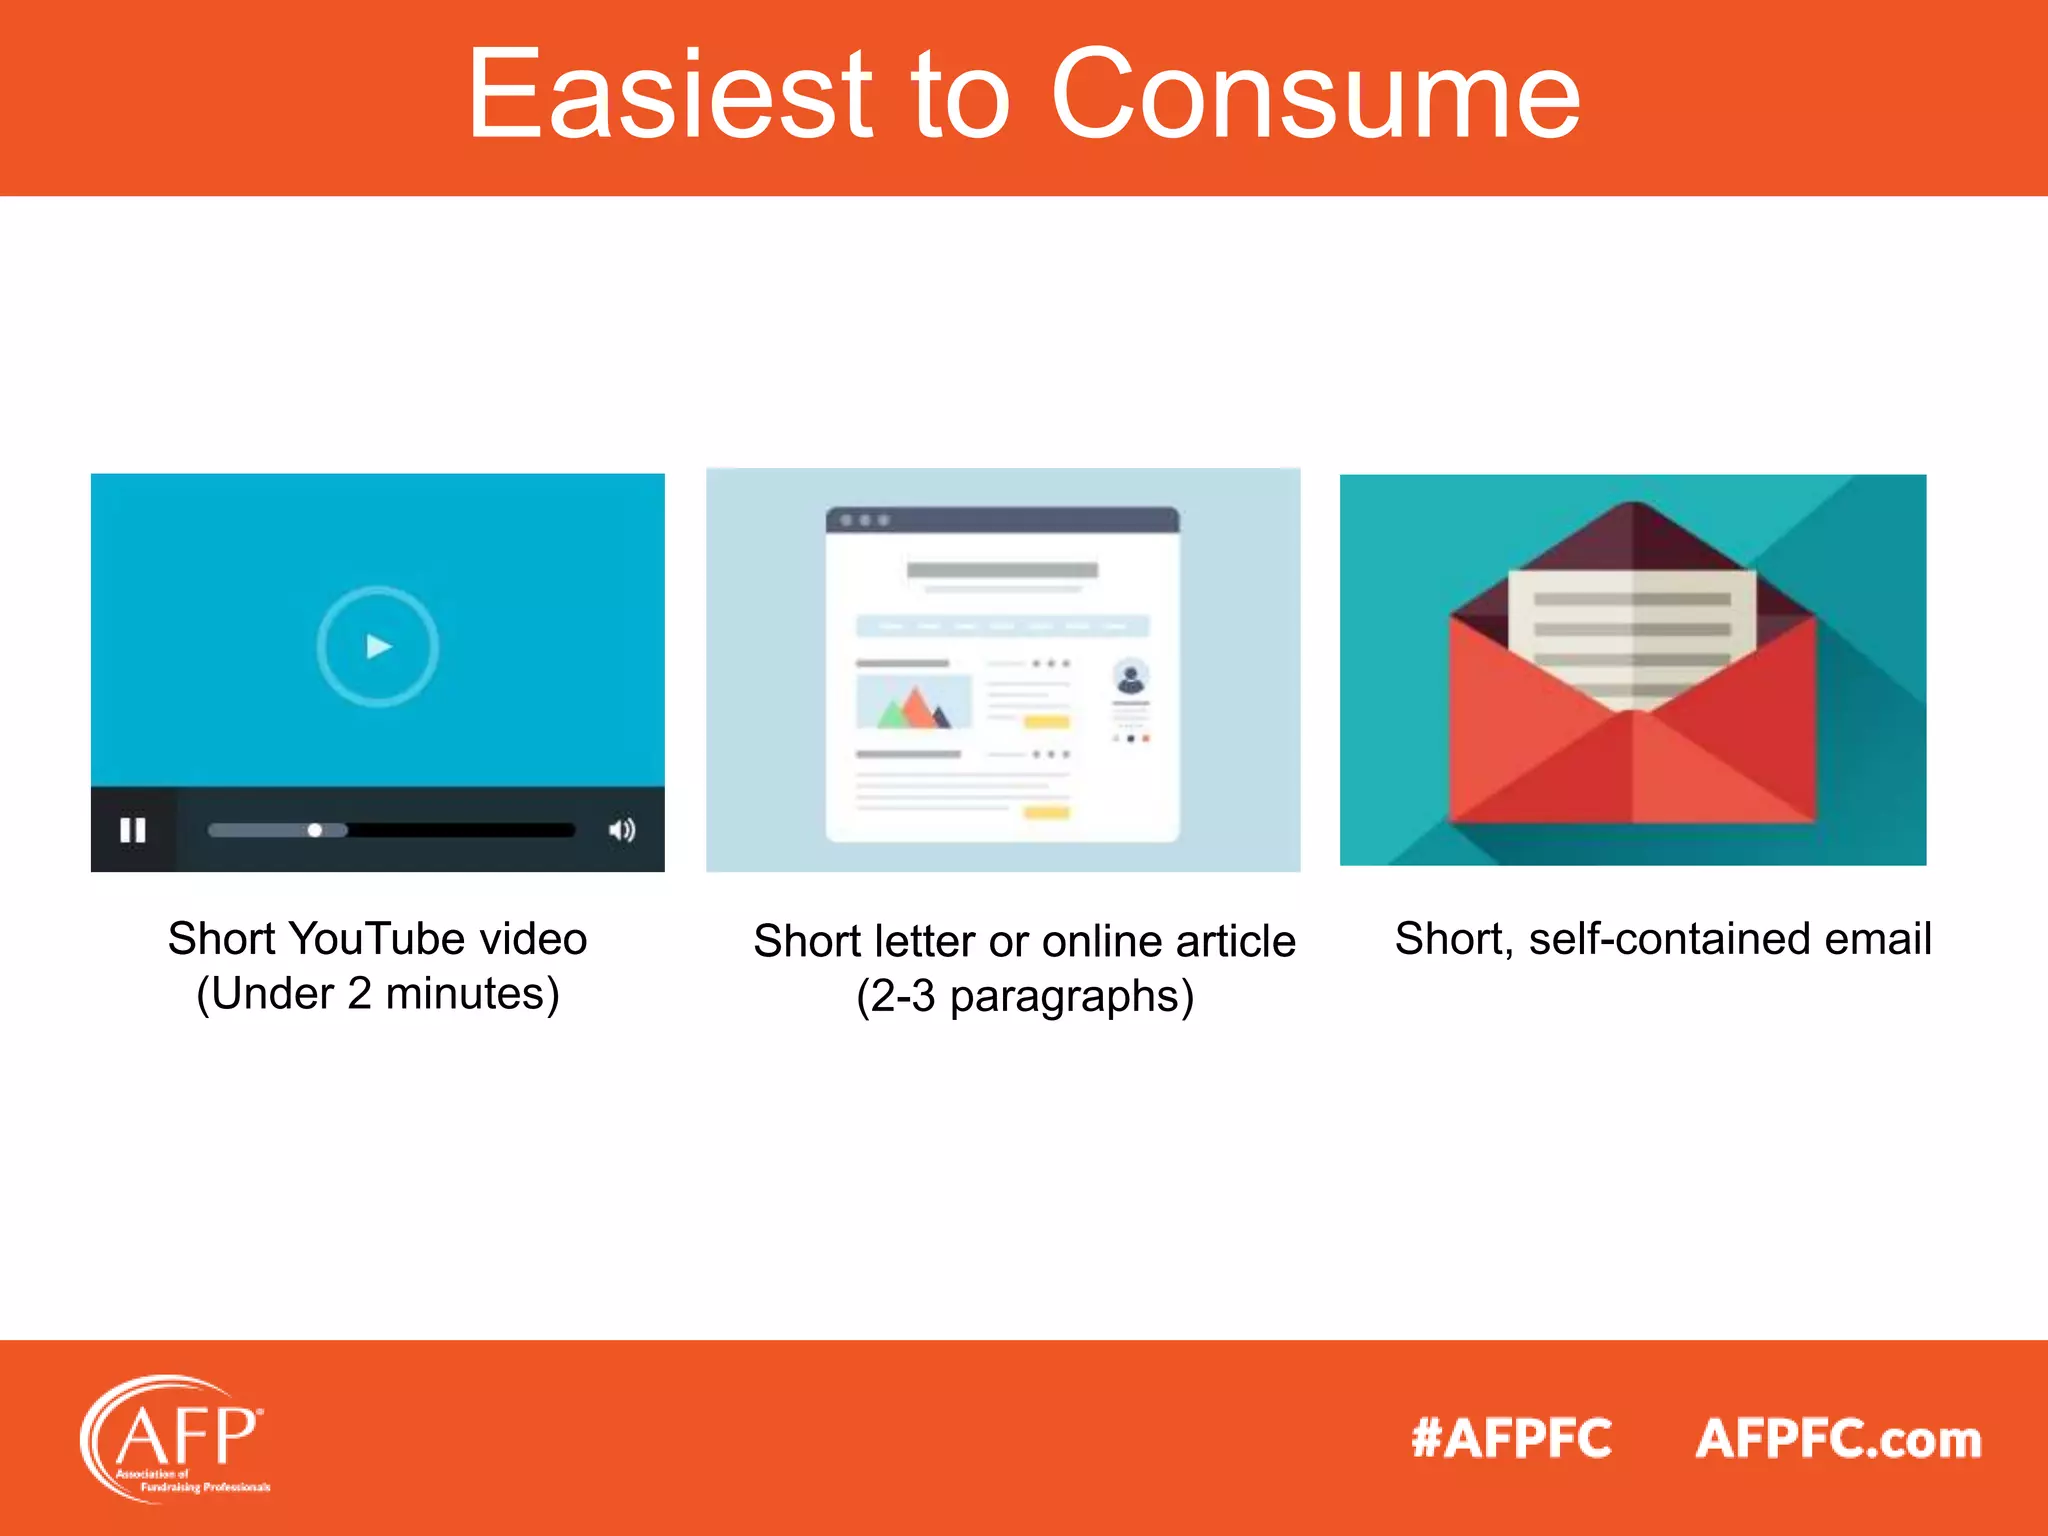
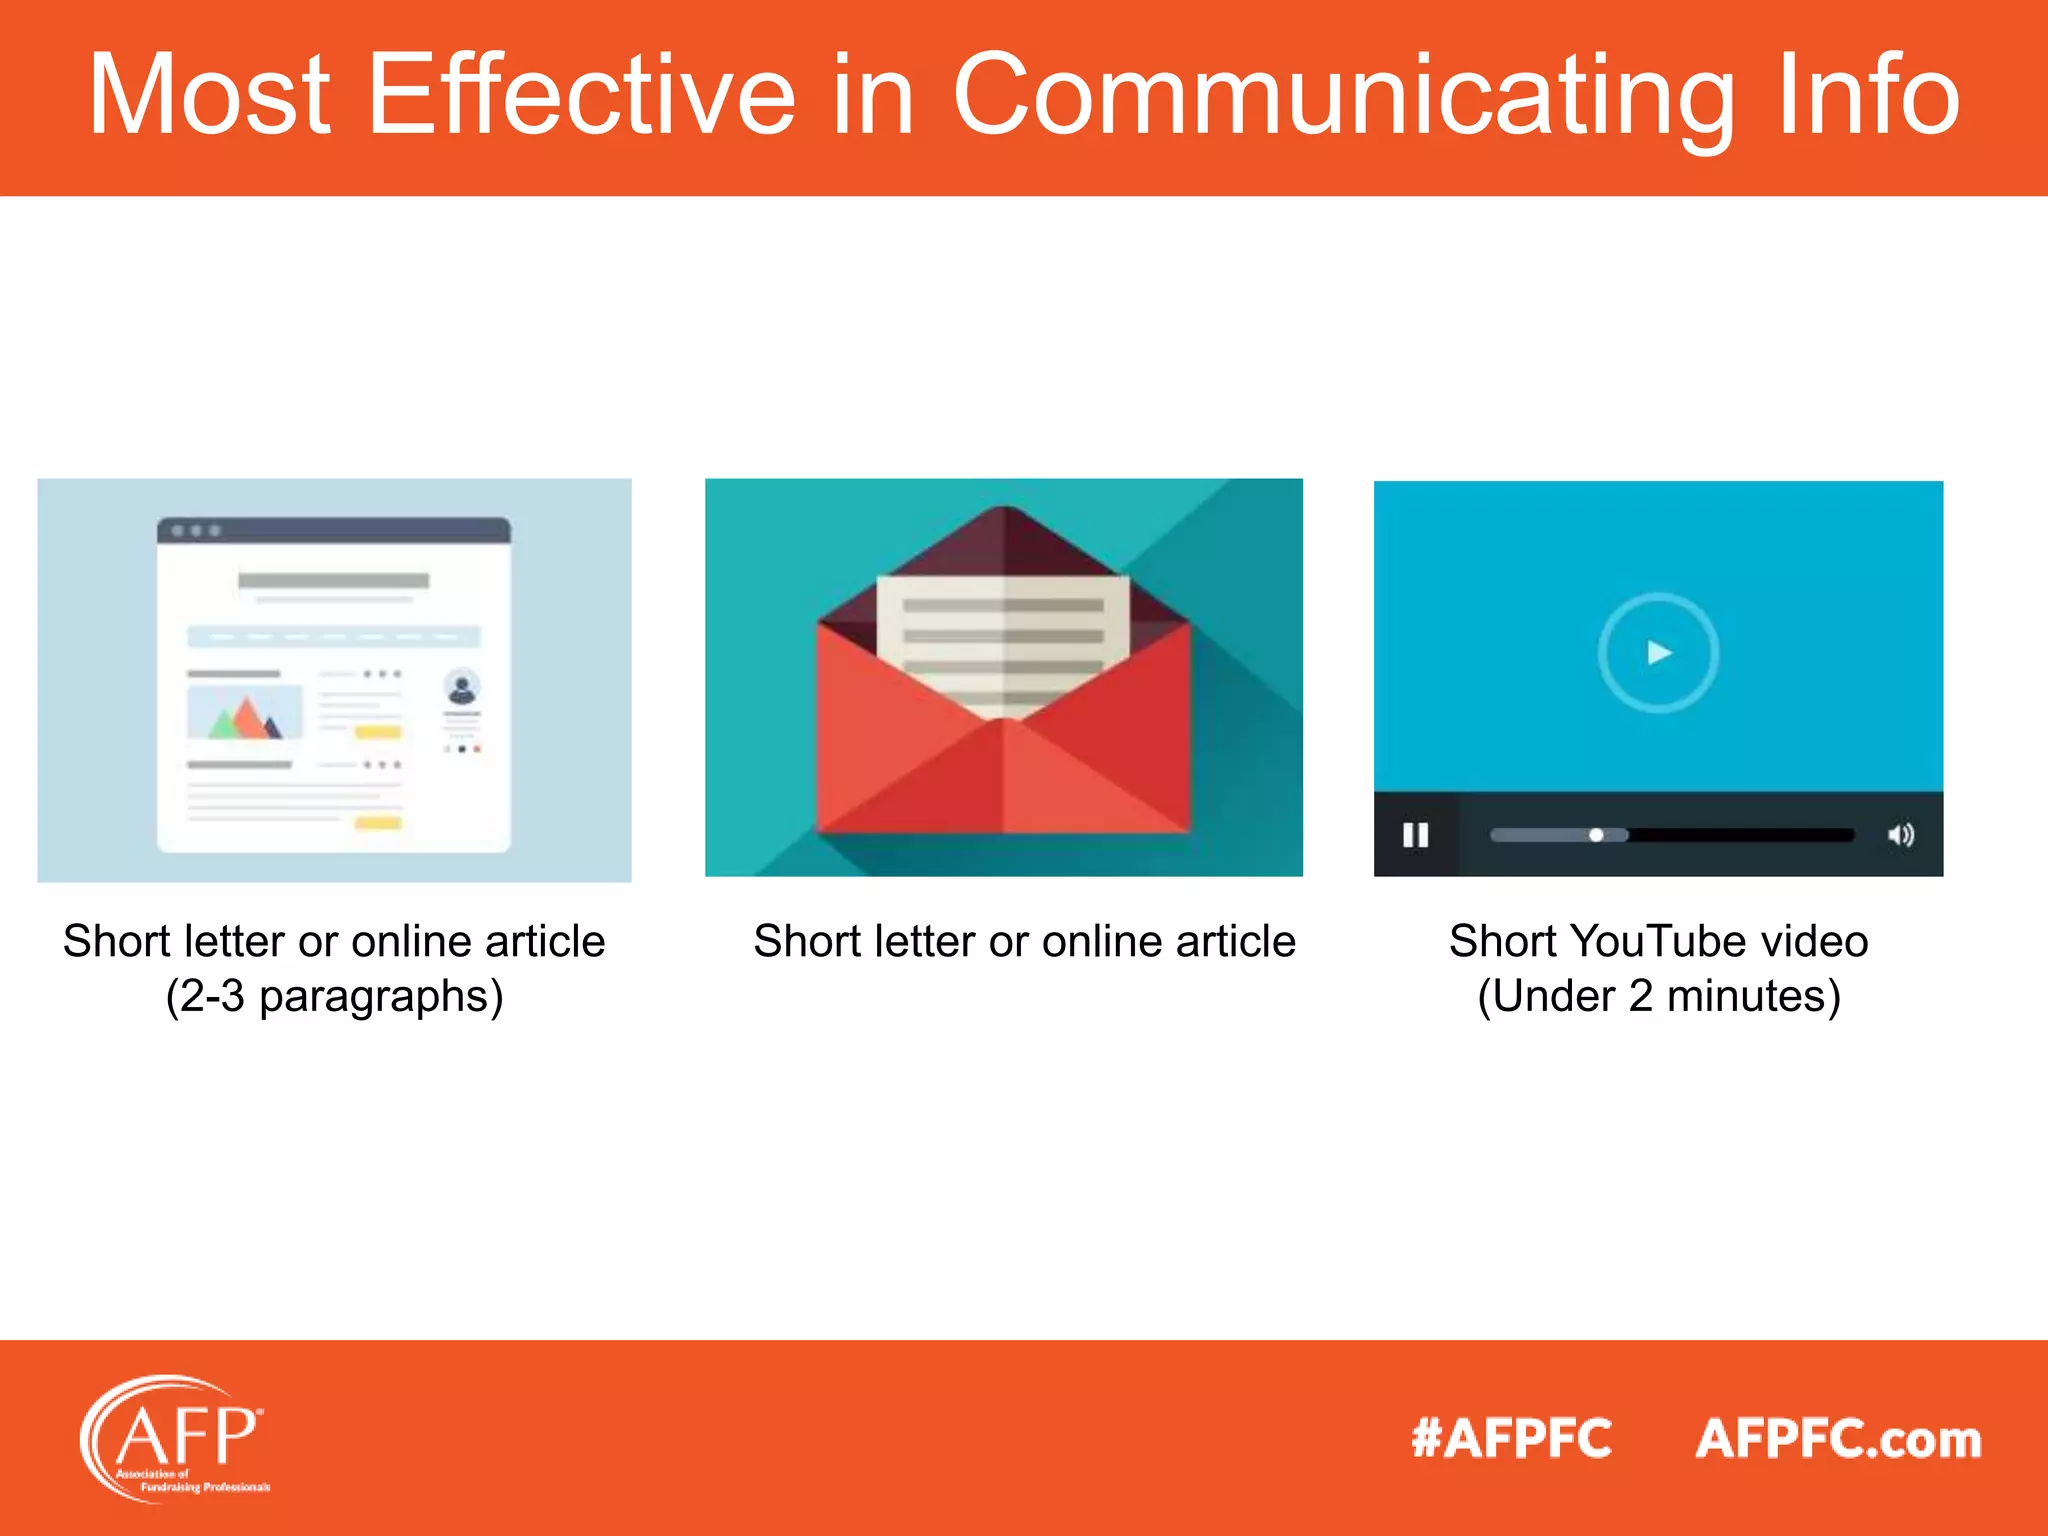
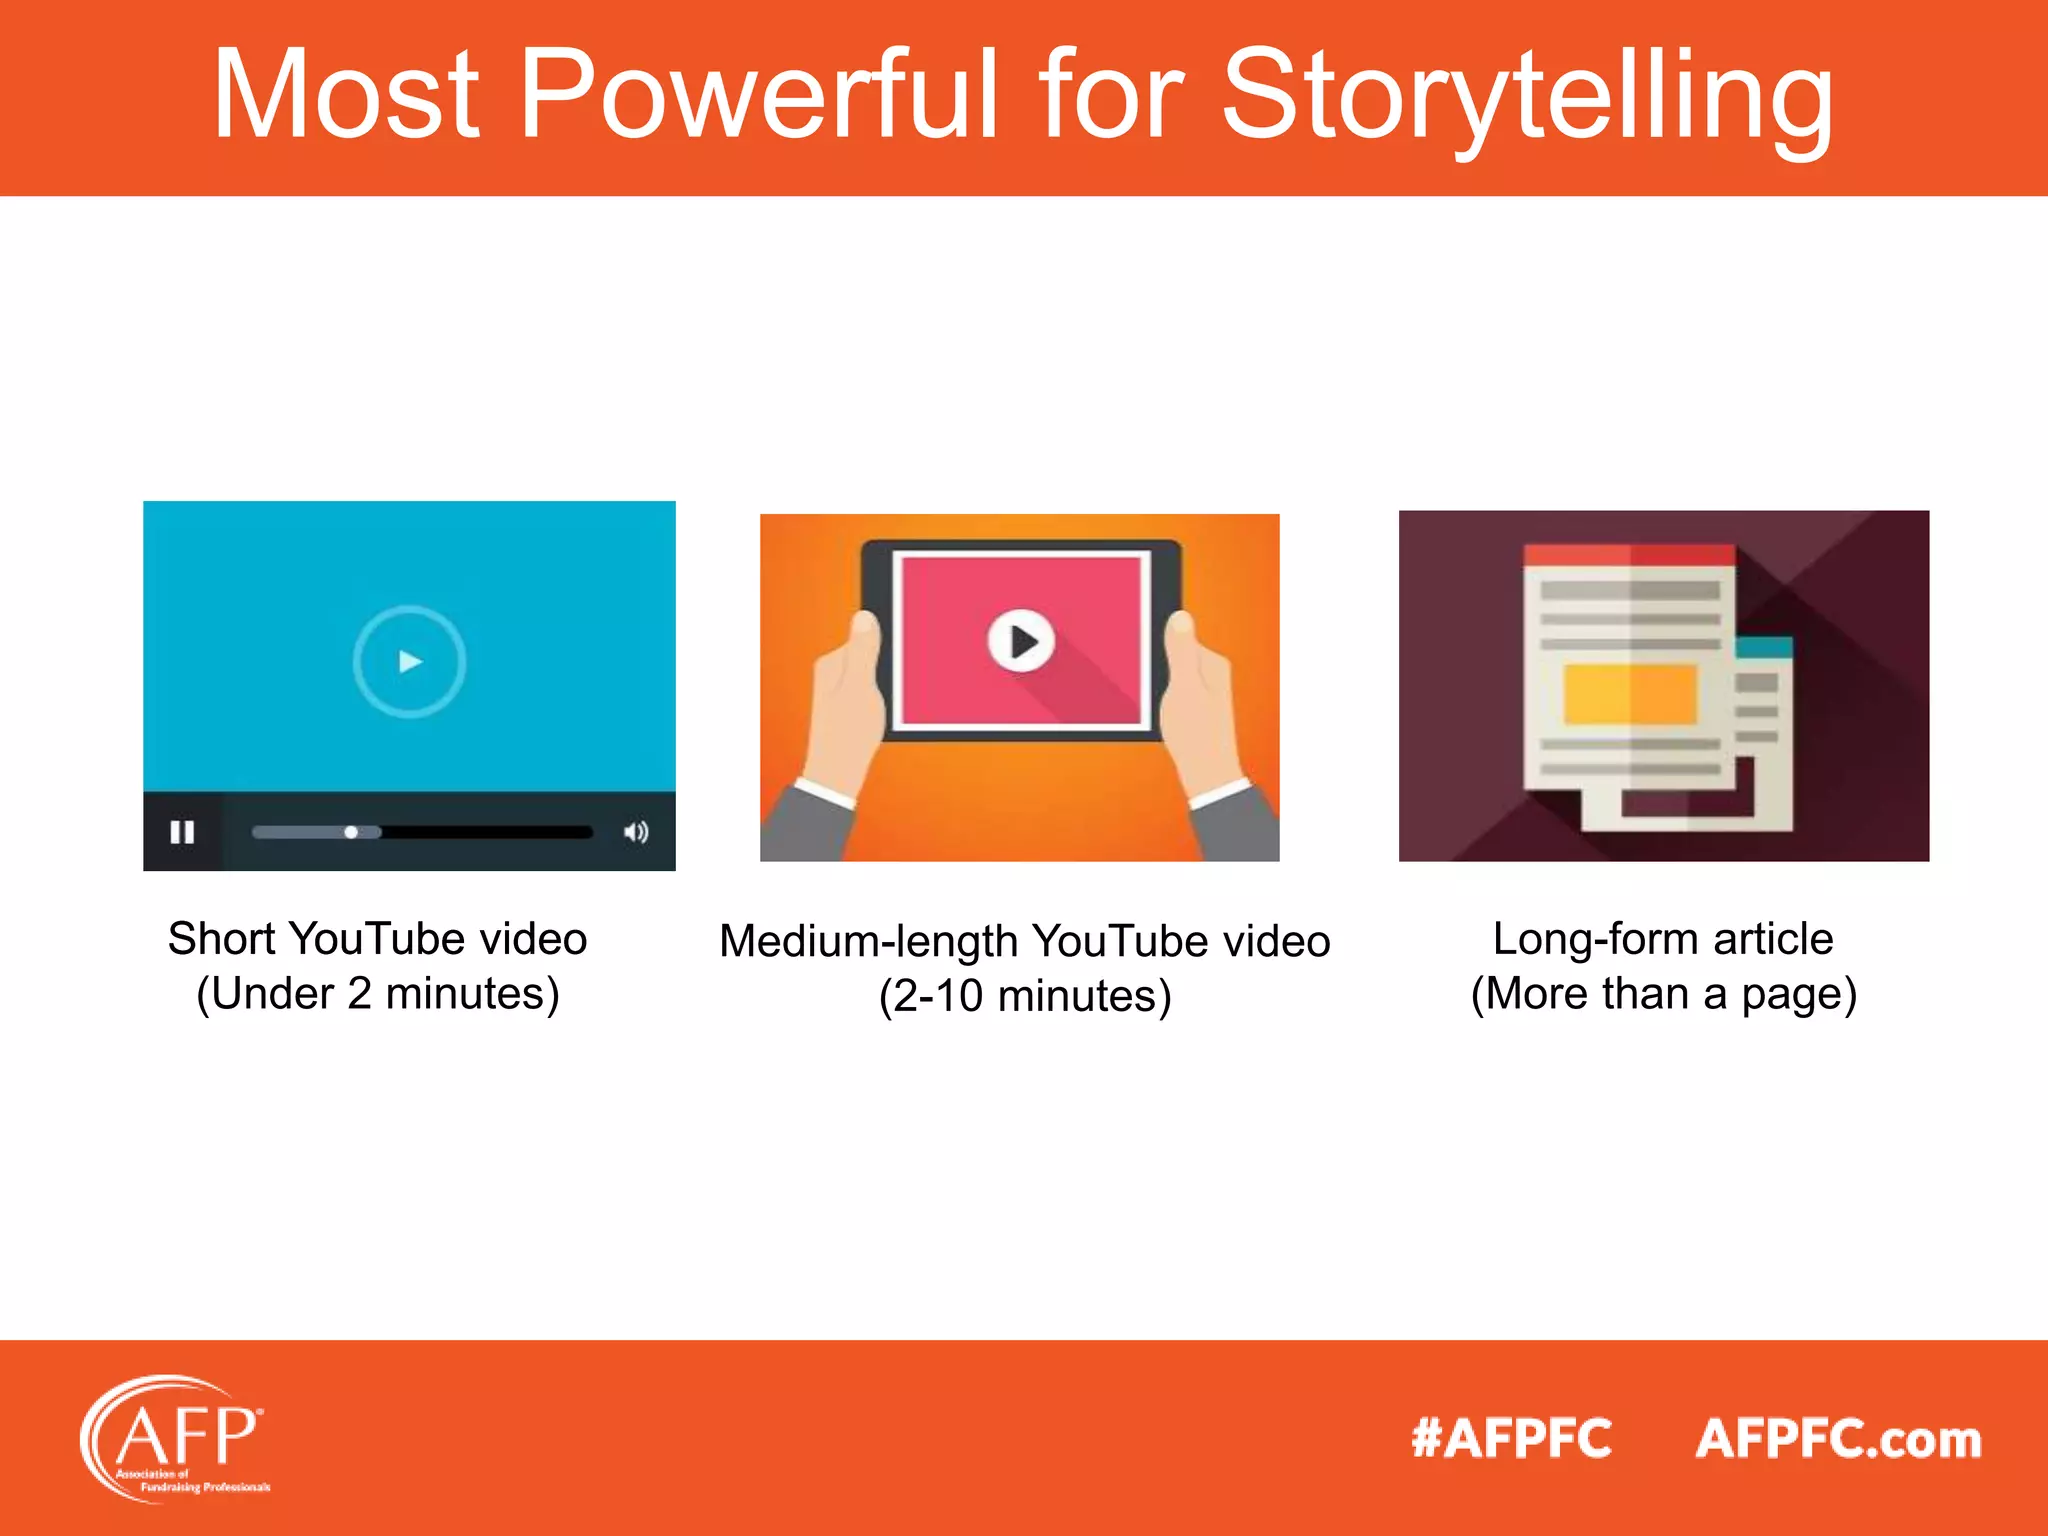
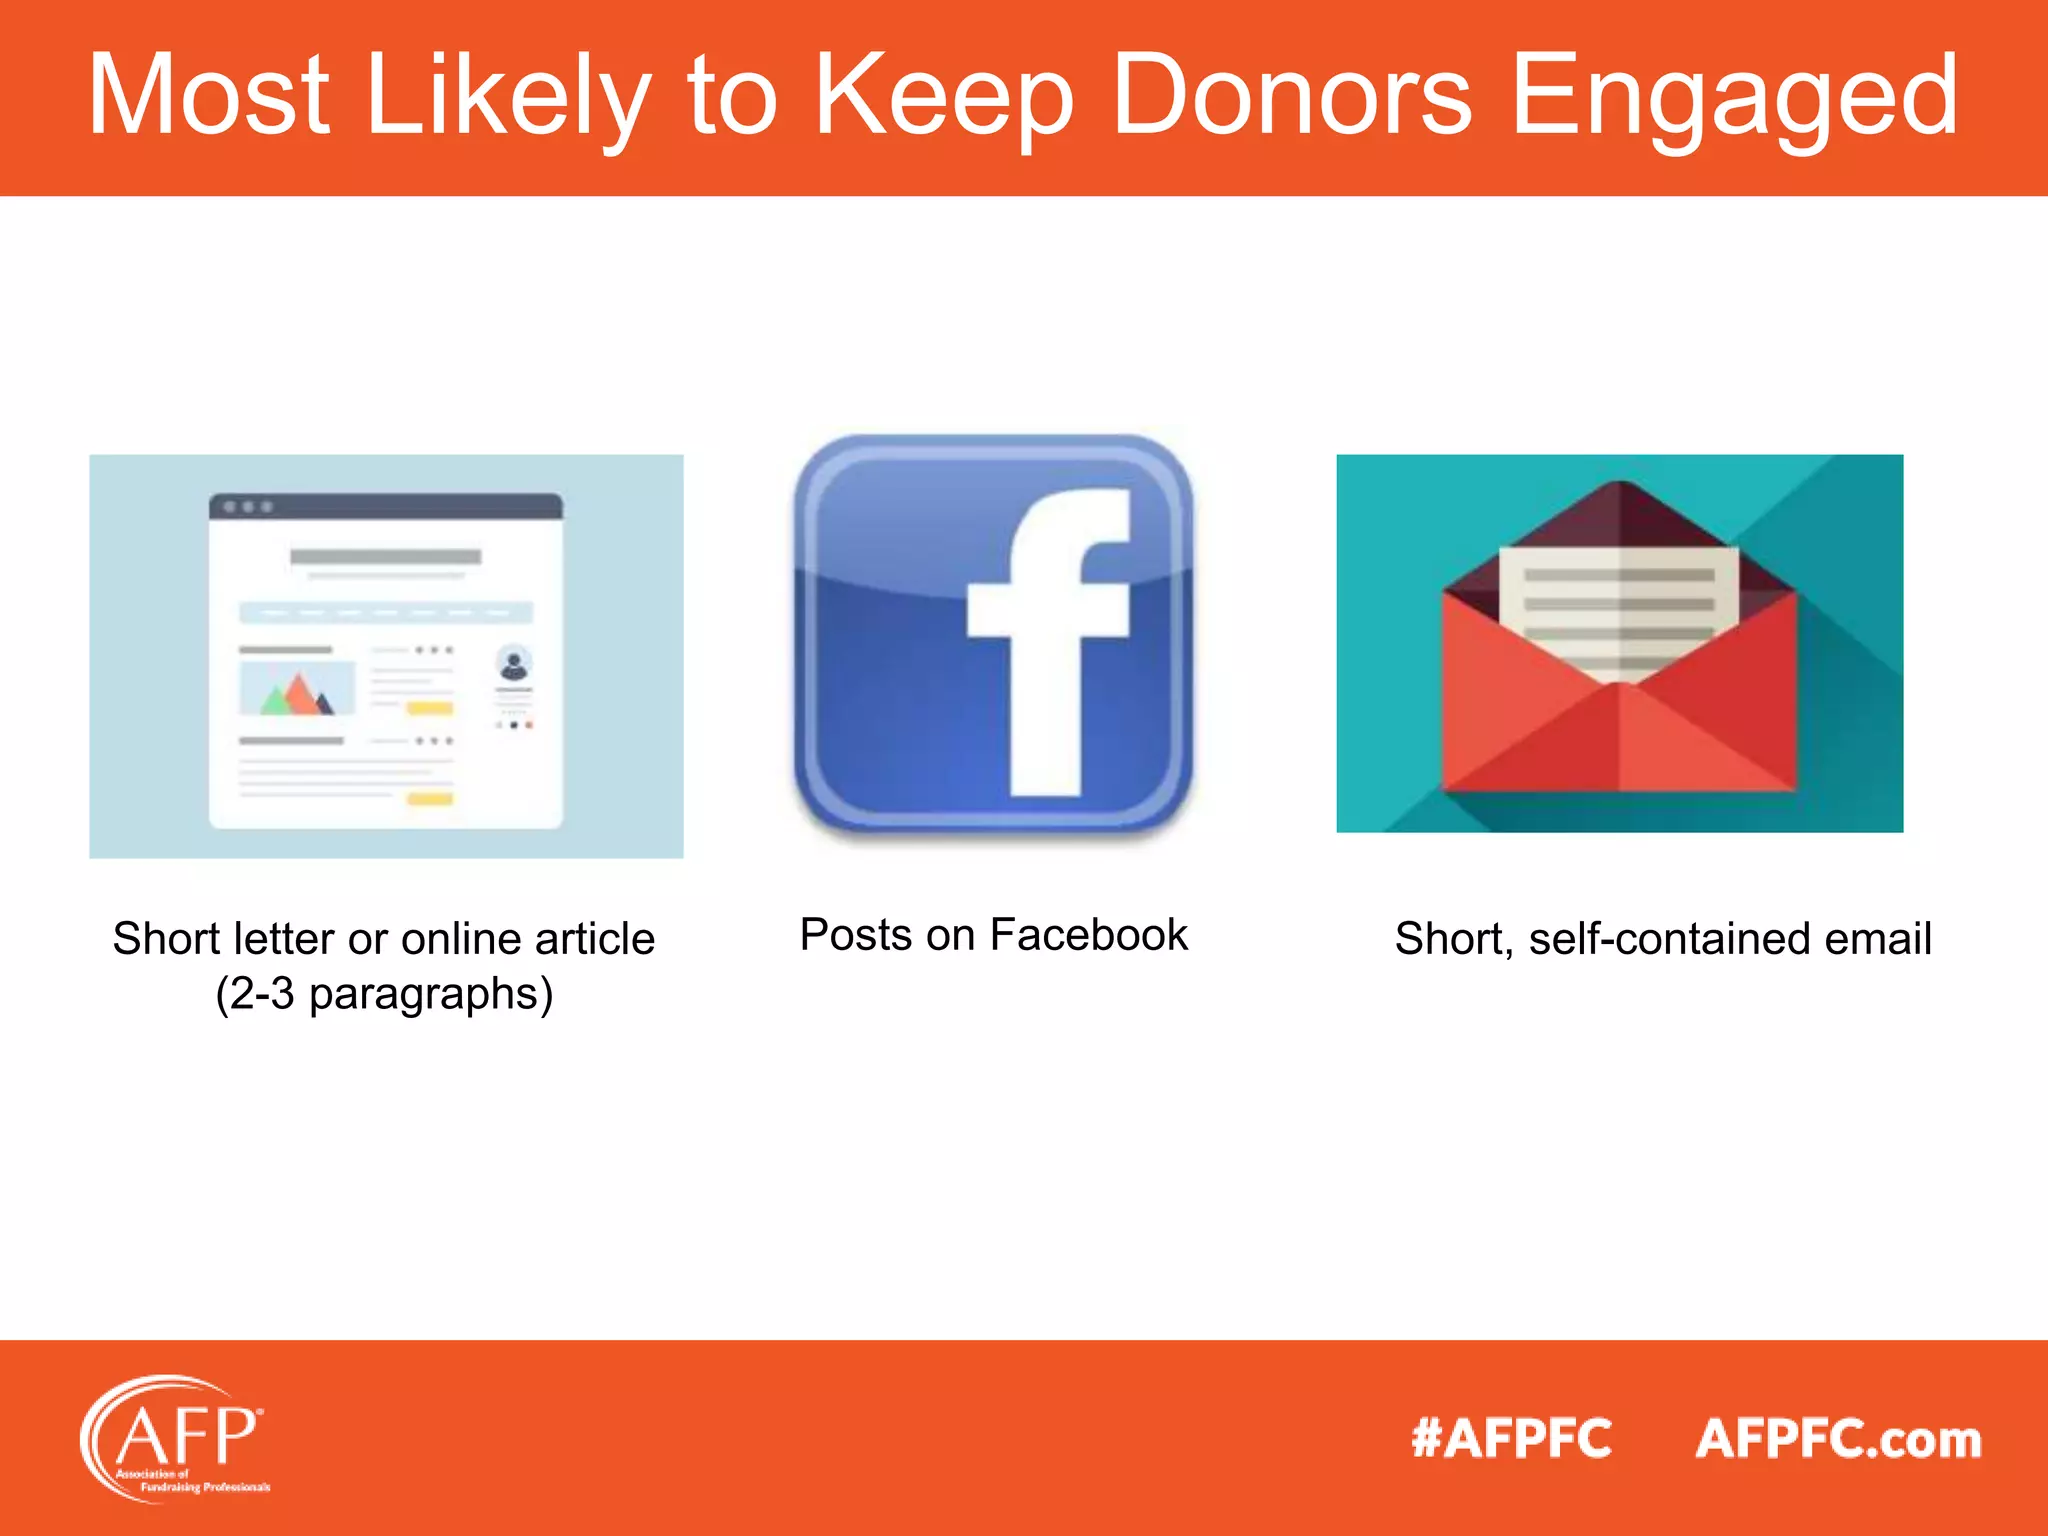
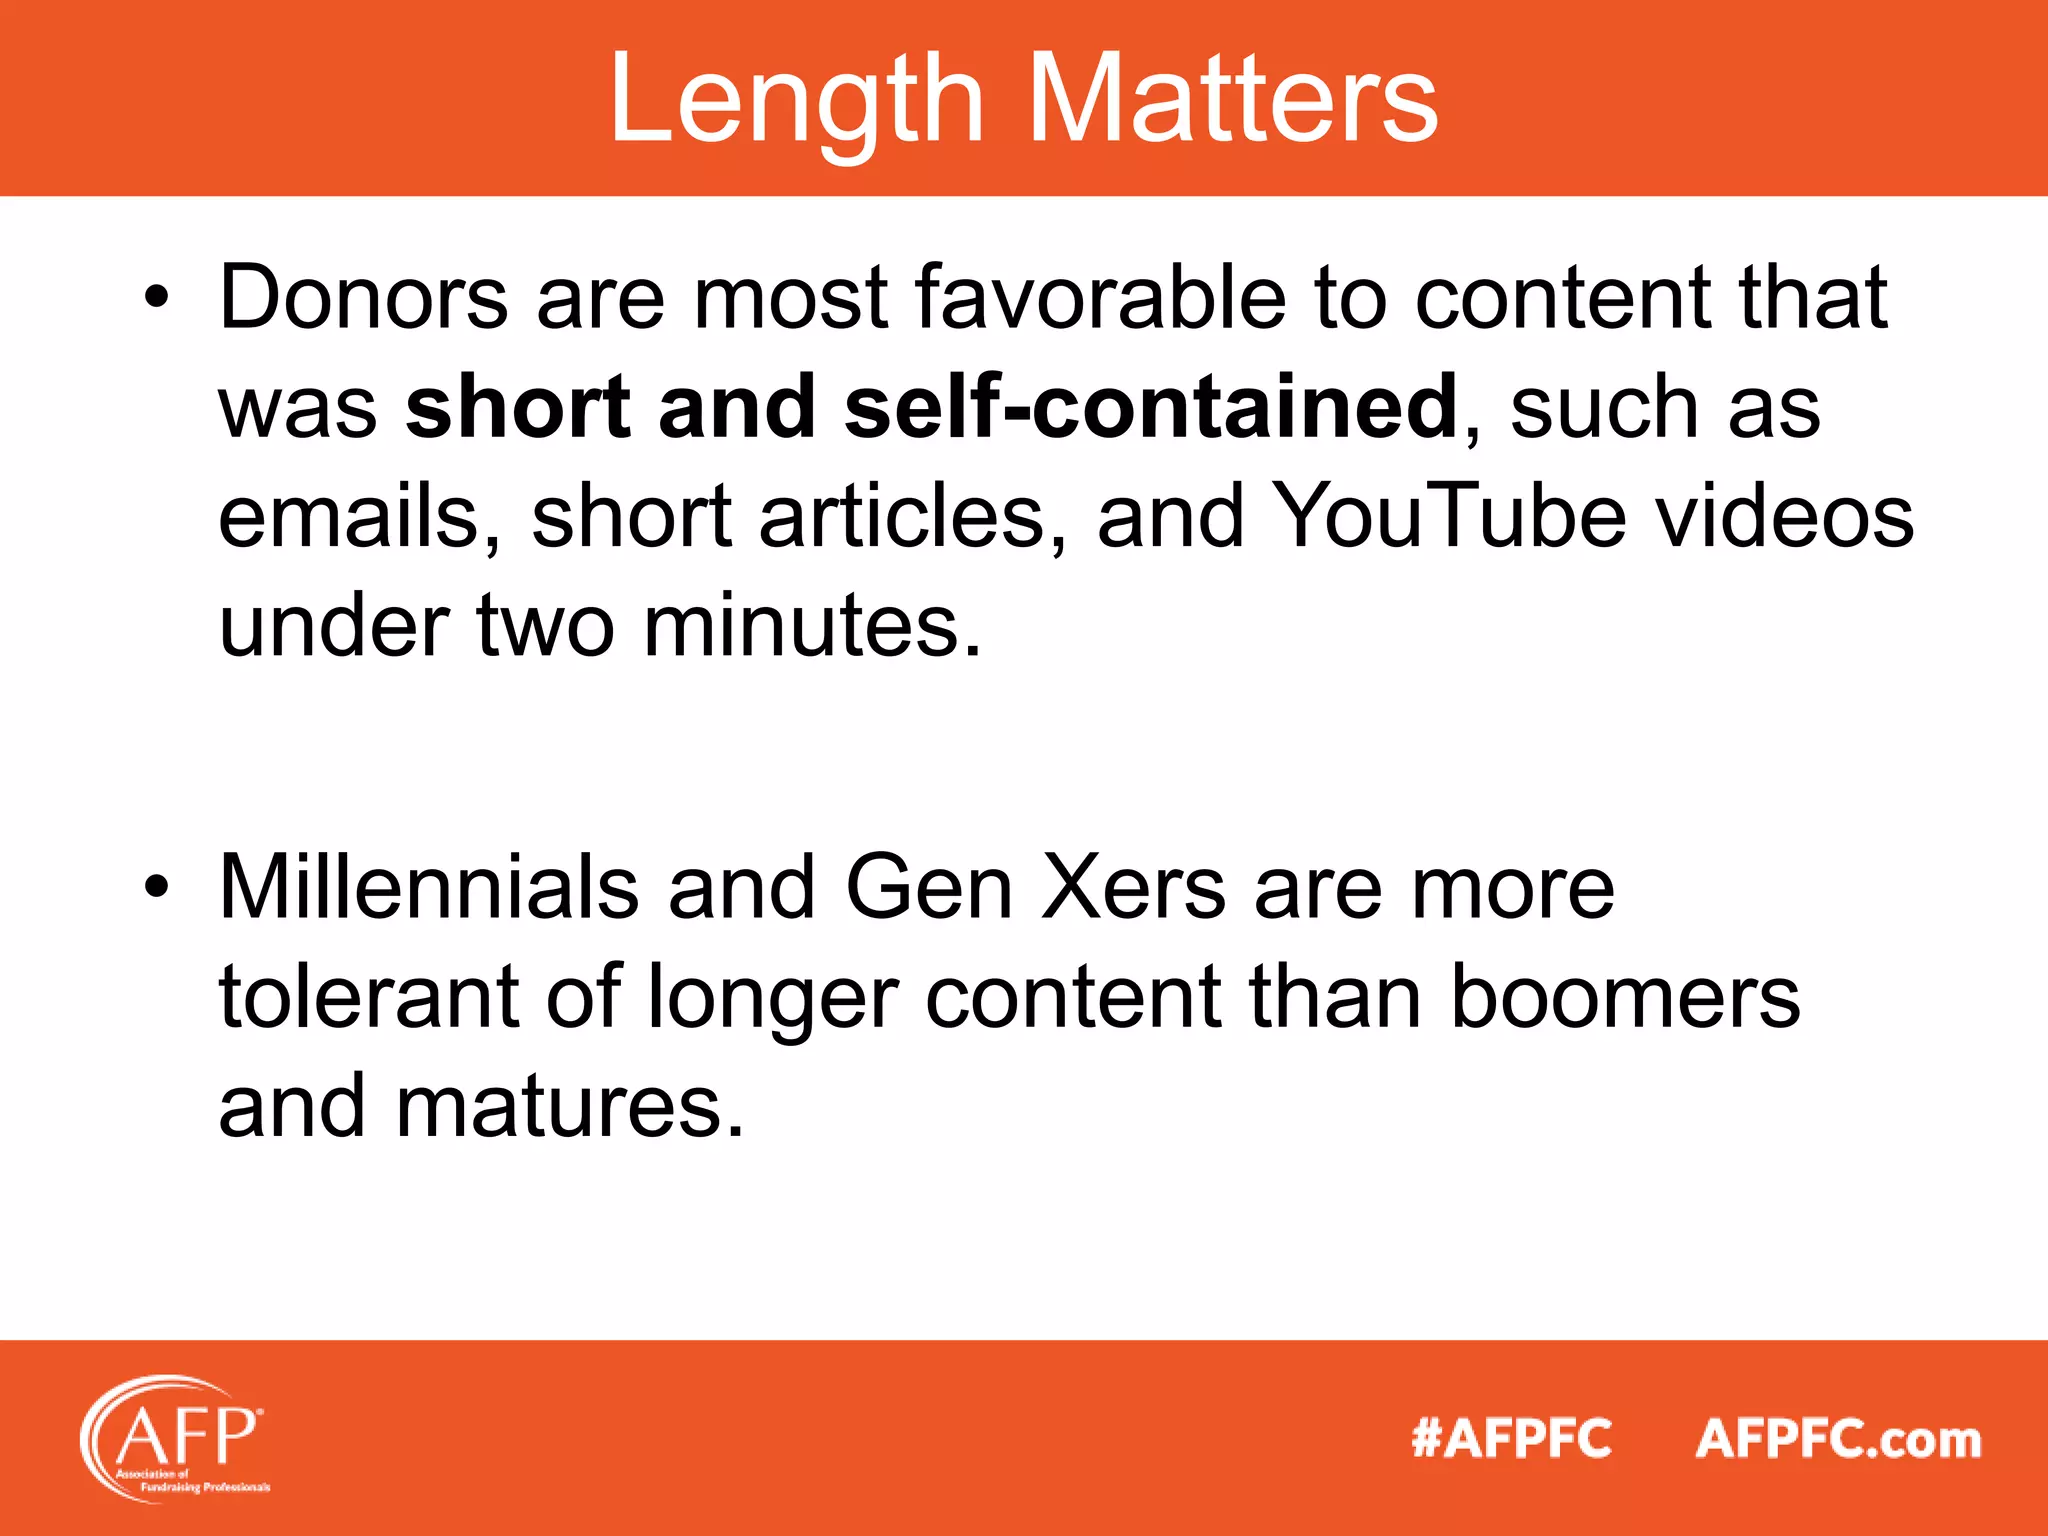
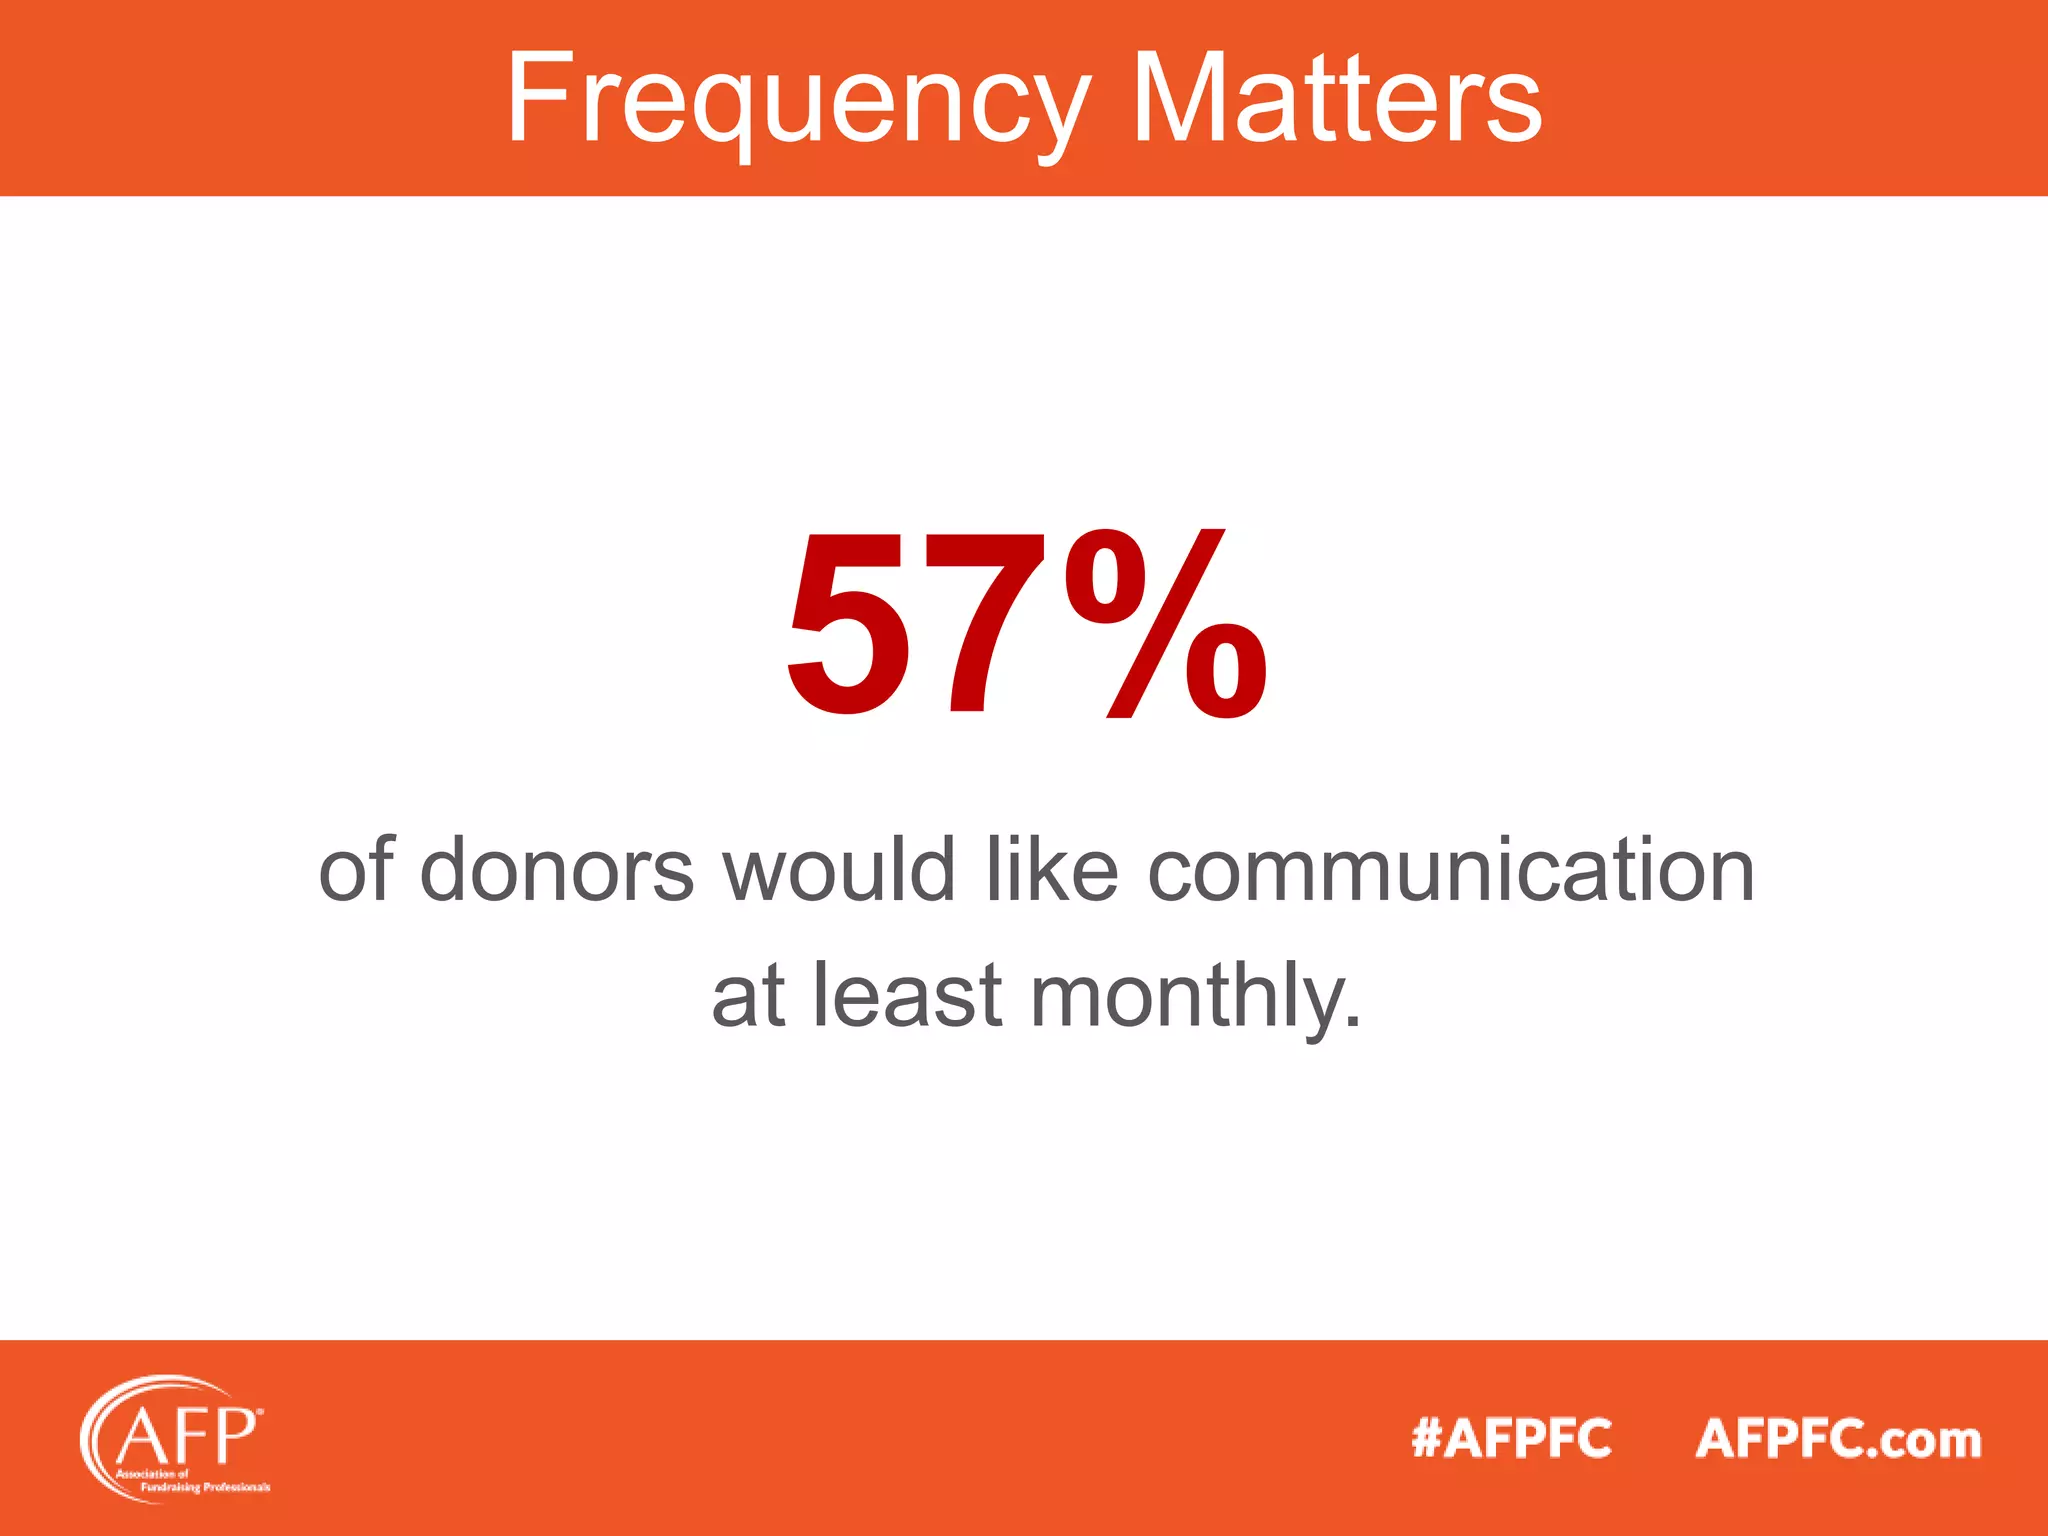
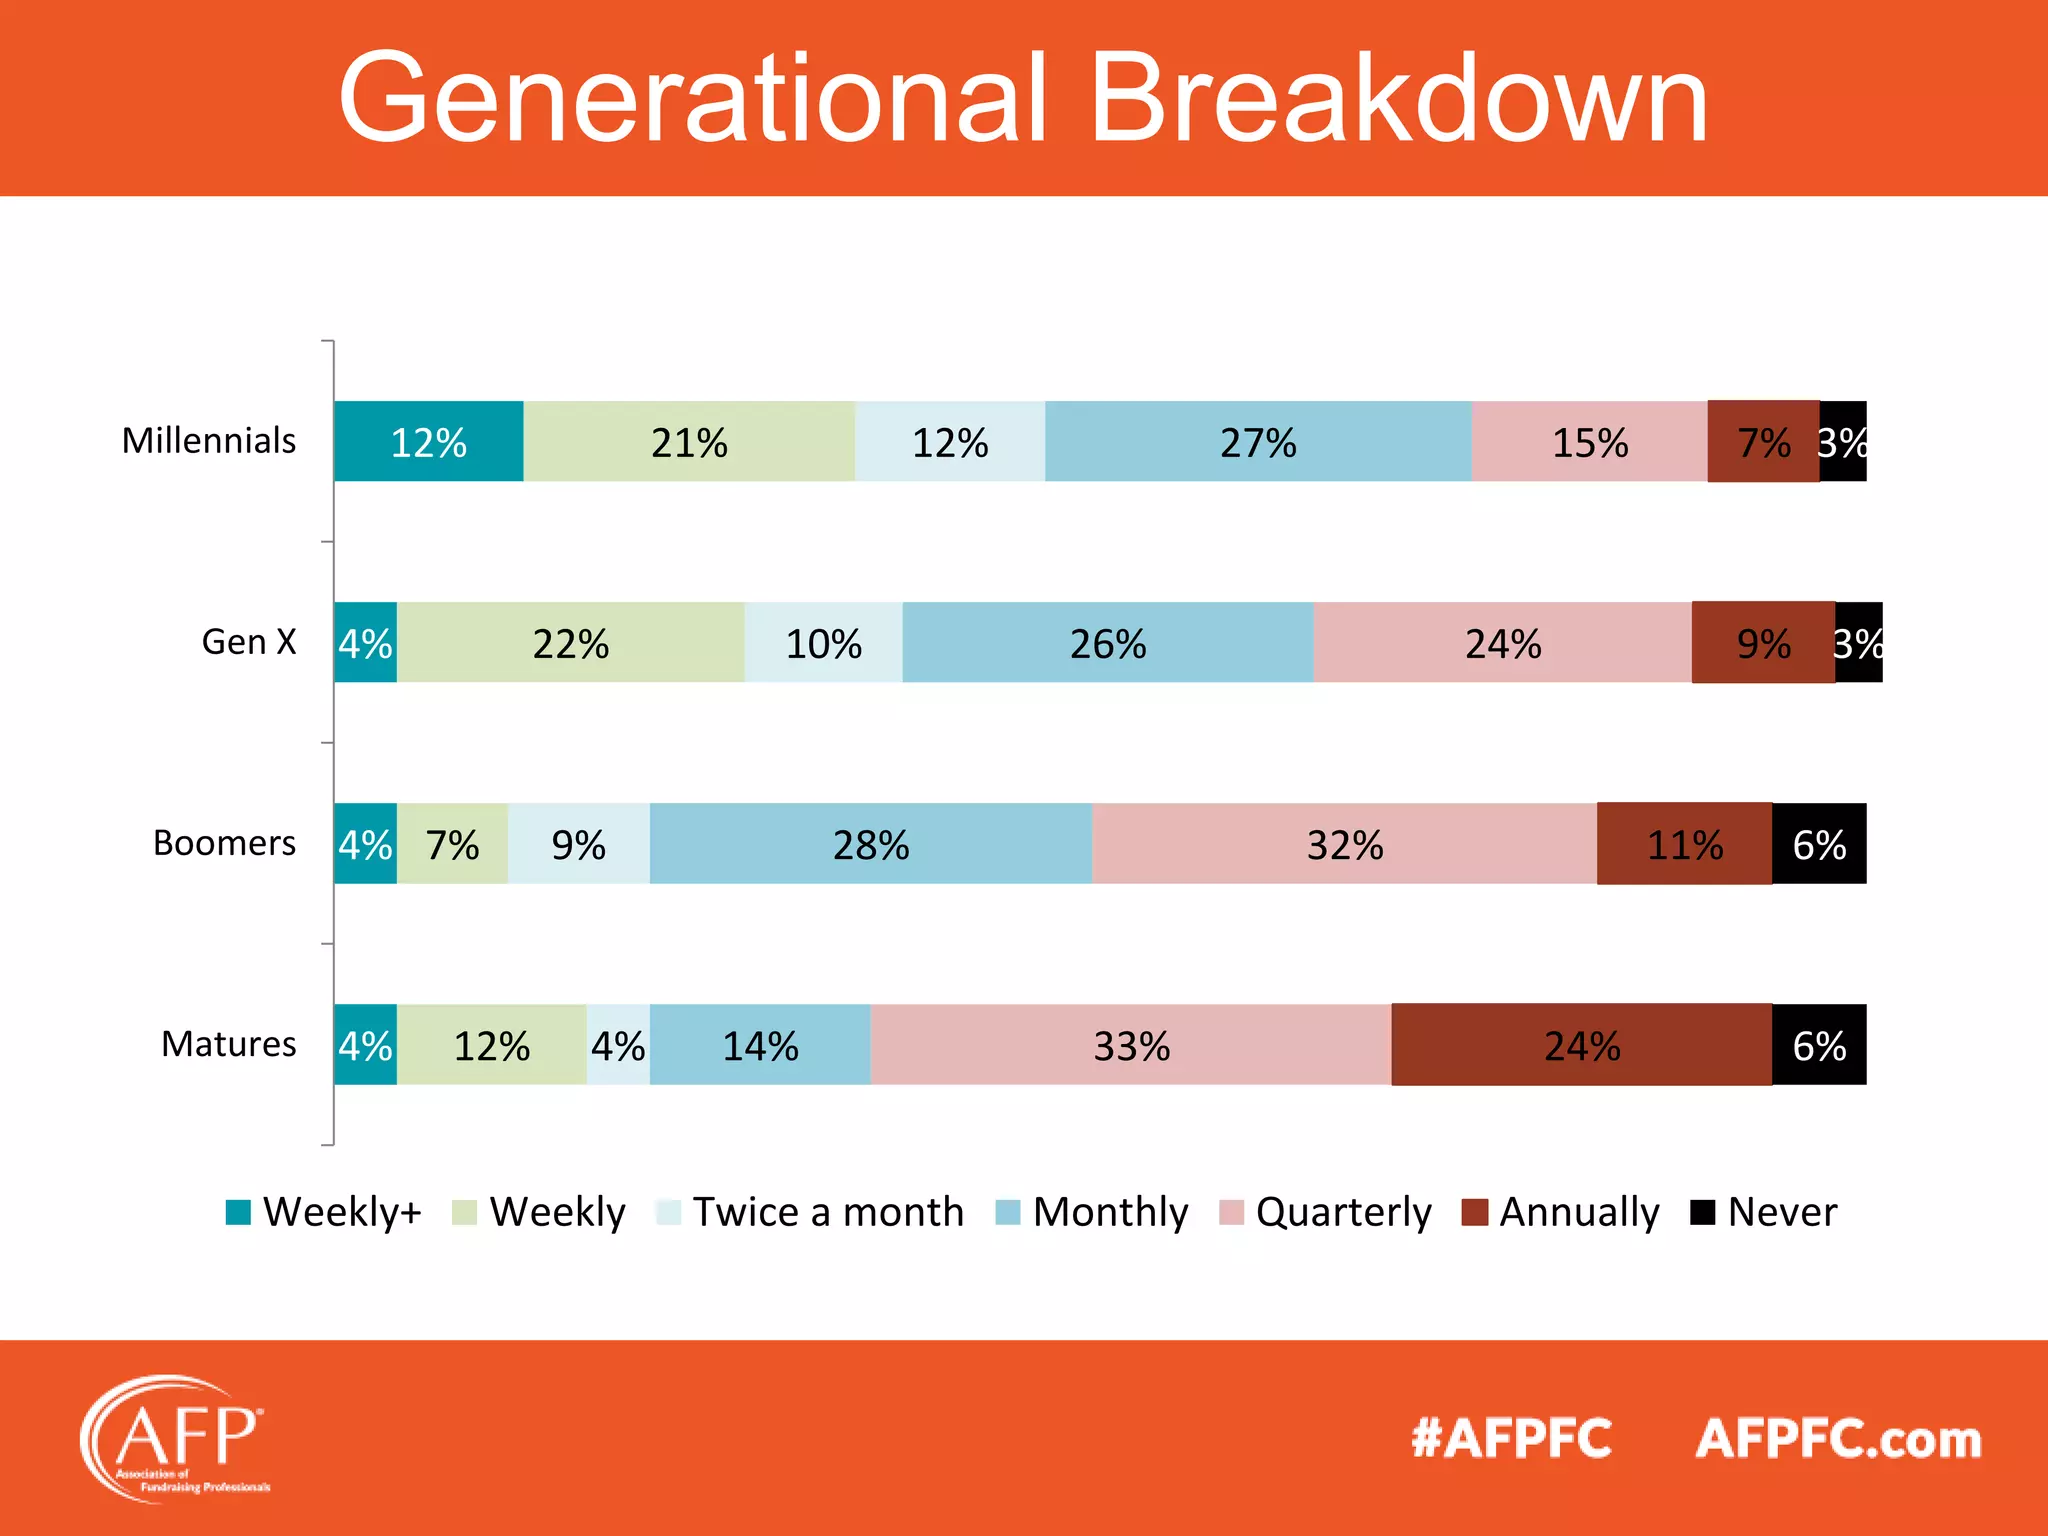
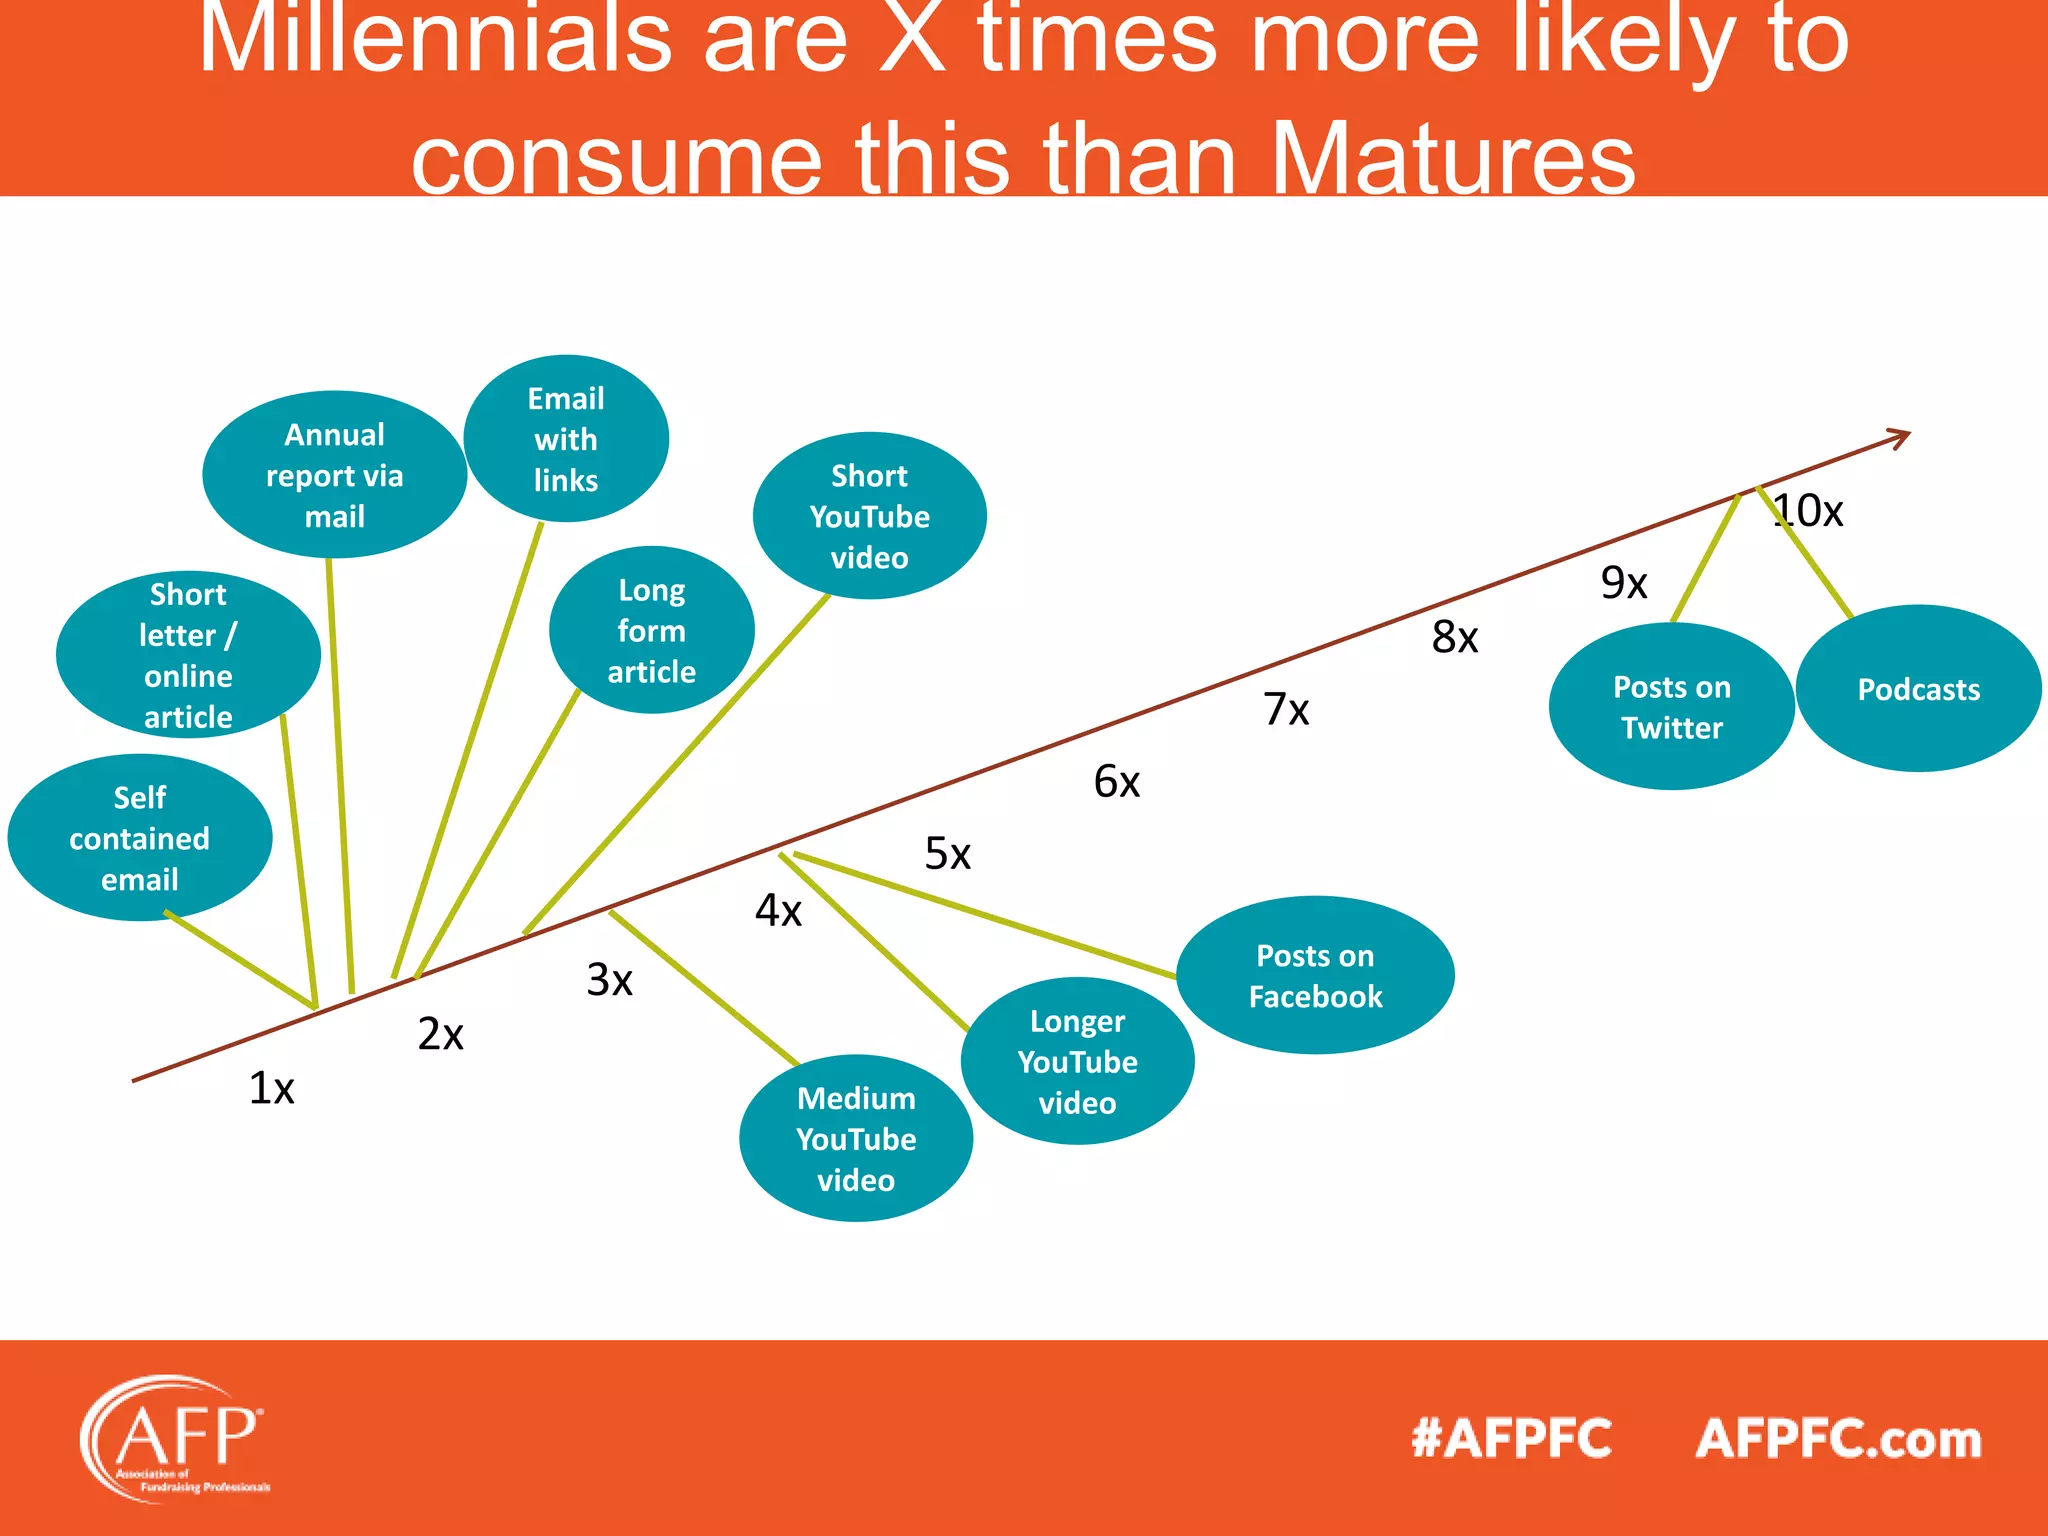
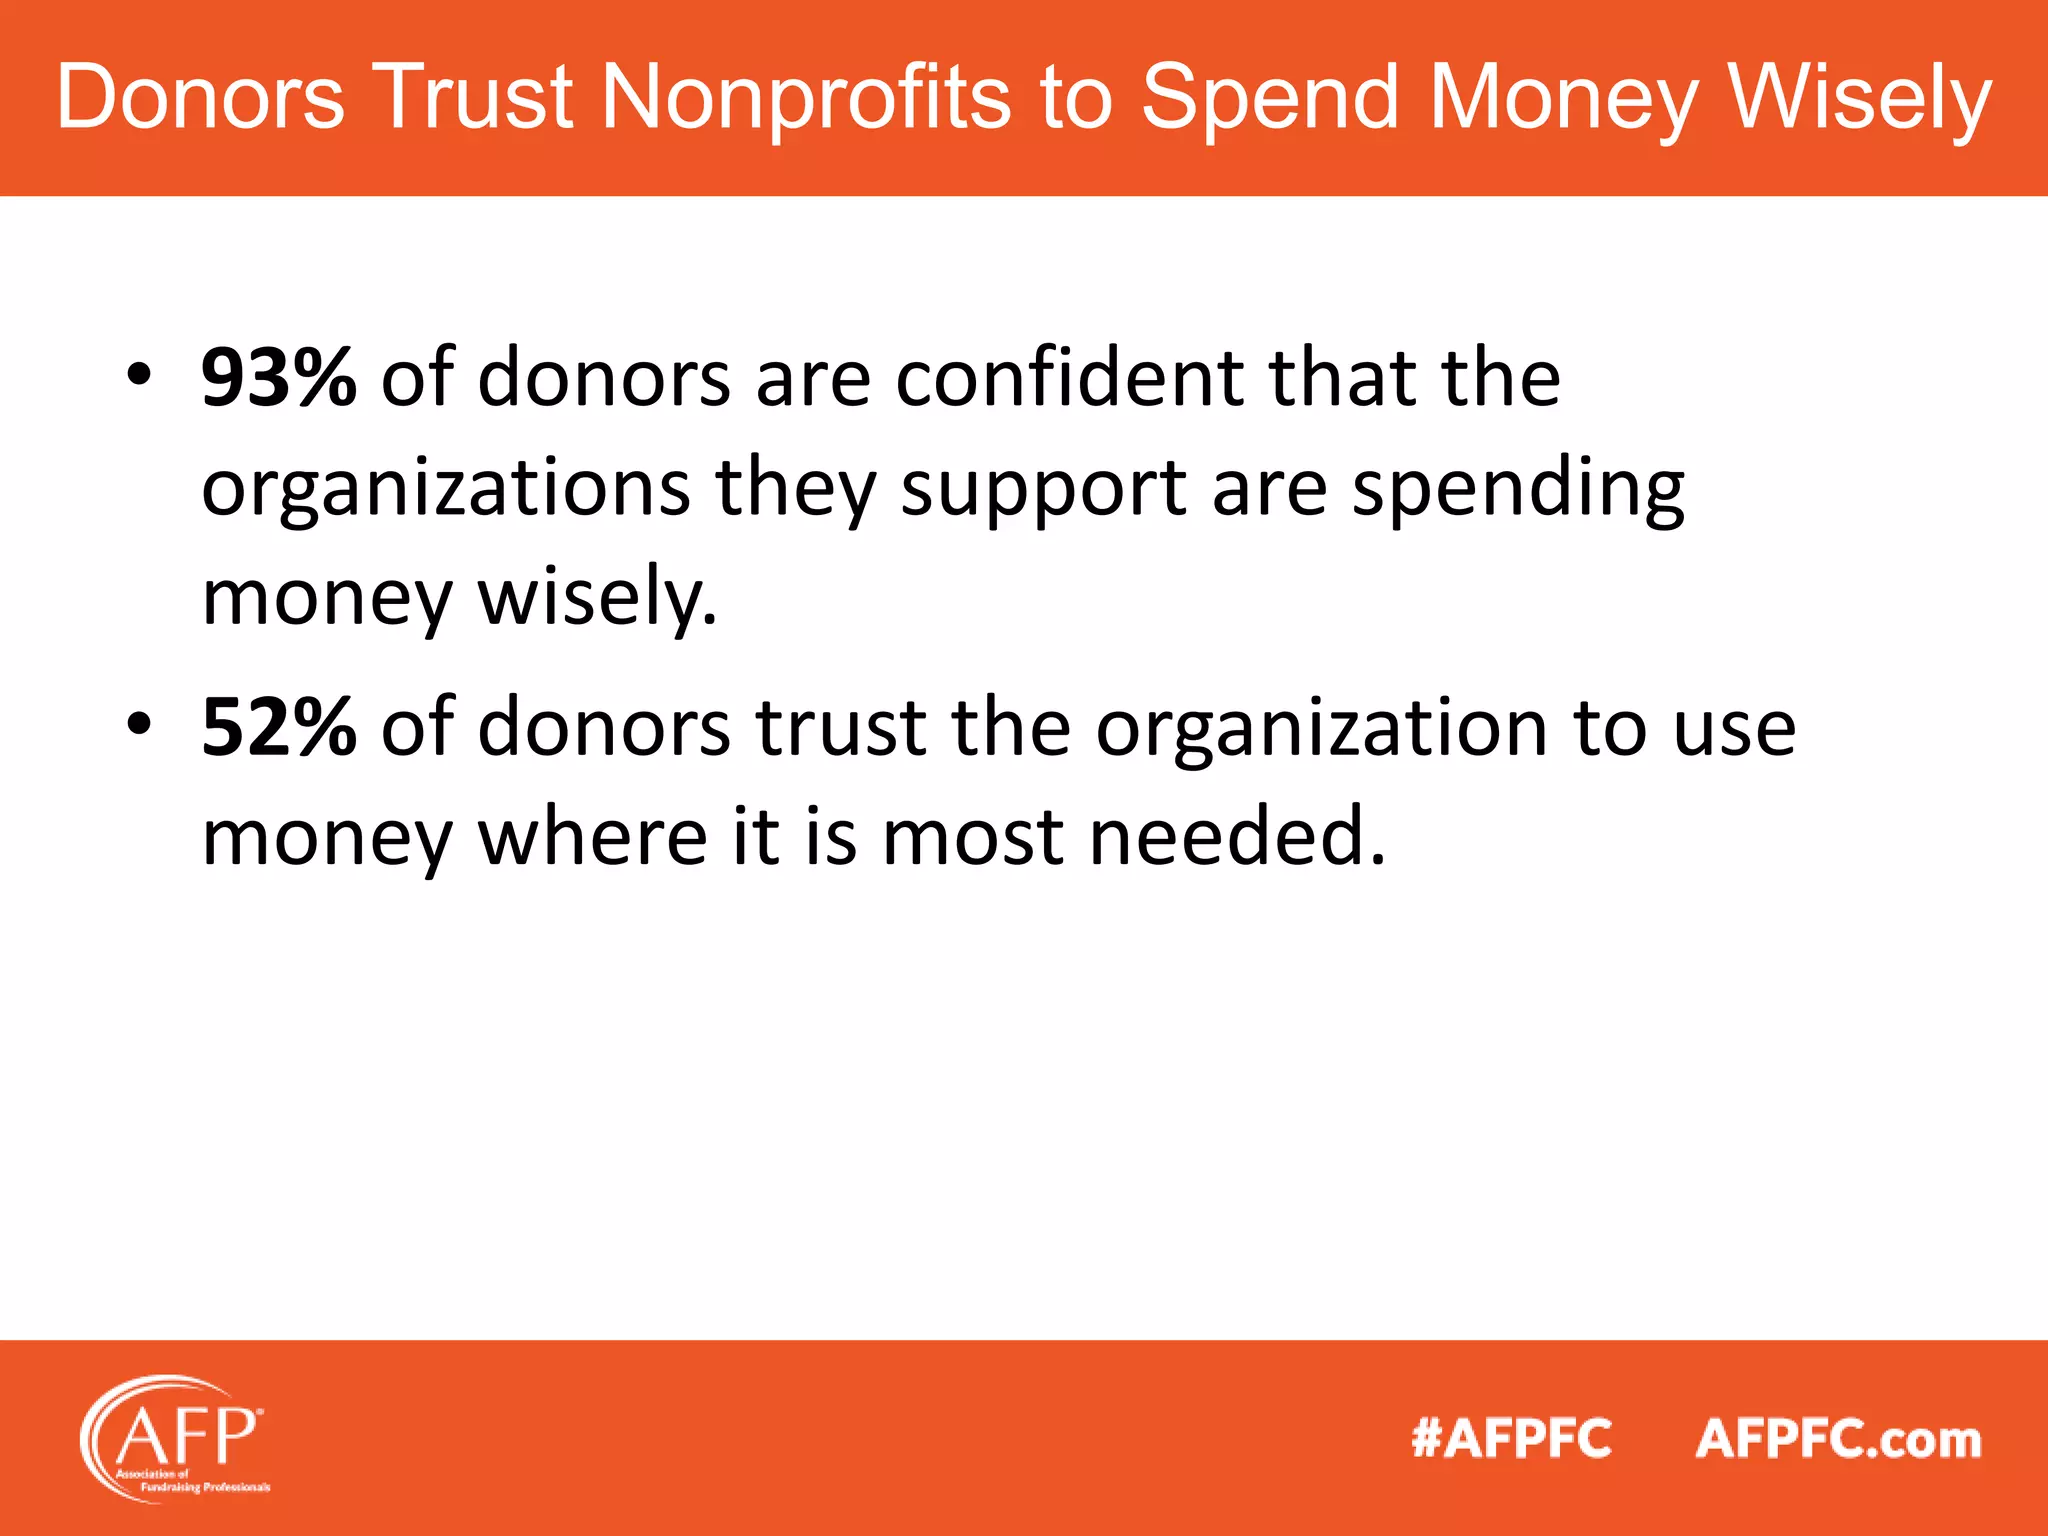
Digging Deeper Into
Donor Behavior & Preferences:
2016 Donor Loyalty Study
1
Last Year
2015
Donor Engagement
Study
We set out to find the
disconnect between nonprofit
practices and donor
preferences.
We conducted two online surveys:
• Donor Survey
• Nonprofit Professional Survey
Study released April 2015.
Sneak Peak @ AFPFC 2015
• Fundamentals are key for nonprofit organizations.
• Donors and organizations are misaligned on communication frequency.
• Critical content is more important than frequency or channel.
• Giving (or the act of giving) makes donors feel the most engaged.
• Age/generational engagement is a missed opportunity.
• Organizations are missing opportunities not using data to drive strategy.
Here’s What We Learned
What Matters Most to Donors
How Donors Feel Most Engaged
of donors feel that their top charity takes
their preferences into consideration.
Only 52%
Nonprofit Targeting
Segmenting
• Surveyed 1,136 donors
in the US who made at
least one donation in the
last 12 months.
• The survey took place
between Feb. 3 - Feb. 16
2016.
Donor Loyalty Study
Coming
Soon!
Study Releasing April 12.
How Donors Engage
10%
11%
13%
13%
16%
16%
17%
18%
21%
25%
27%
29%
36%
40%
44%
56%
Participatead in advocacy on behalf of the organization
Served in a volunteer leadership role, liike a committee or board
Gave money for an occasion such as a birthday or tribute to an…
Shared/retweeted/pinned info
Fundraised for the charity/group
Followed on social media
Sponsored a friend or family member raising money
Gave to a charity through their monthly giving program
Attended or pariticapted in a fundraising event
Stayed informed through emails and/or newsletters
Bought products that support them
Spread the word or told others about the charity/group
Volunteered your time
Donated money directly through the website
Donated money directly through a check
Donated goods and services like clothing
In which of the following ways have you been involved with a nonprofit organization in the past 12 months? select all that apply.
Ways Donors Engage
• Donating goods and services
• Giving money
• Buying products
Giving
• Volunteering
• Attending events
• Serving in leadership role
Doing
• Staying informed
• Engaging on social media
• Advocacy
Communicating
Giving
Engagement: Giving
56%
44%
40%
27%
18%
17%
16%
13%
Donated goods and services, like clothing
Donated money directly through a check in the mail
Donated money directly through the website
Bought products that support them
Gave to a charity through their monthly giving program
Sponsored a friend or family member raising money for a
nonprofit organization
Fundraised for the charity/group
Gave money for an occasion such as a birthday or in tribute
to an individual
In which of the following ways have you been involved with a nonprofit organization in the past 12 months? Select all that apply.
How Donors Give
31%
38%
52%
65%
39% 41% 41%
31%
Millennials Gen X Boomers Matures
Check through mail Through website
Main Reasons for Donating
59%
45%
33%
18%
16%
16%
13%
8%
8%
3%
I am passionate about the cause
I know that the organization I care about depends…
I know someone affected by their cause
Moved to donate in response to an event in the…
To memorialize someone
Someone I know directly asked me to donate
Awareness through ads/communication
As a gift to a friend or loved one (birthday,…
Saw a post on social media
Other
Top
Reasons
for
Donating
It’s all about me!
Generational Breakdown
63% 62%
56% 55%
36%
39%
51%
65%
33% 32% 34% 33%
15% 14%
19%
27%
Millennials Gen X Boomers Mature
Passionate about cause
Organization I care about depends on them
Know someone affected by cause
Moved to donate in response to event in news
Doing
Engagement: Doing
36%
21%
11%
Volunteered your time
Attended or participated in fundraising events
such as a party, run, walk, bike, music event,
etc.
Served in a volunteer leadership role, like a
committee or board
In which of the following ways have you been involved with a nonprofit organization in the past 12 months? Select all that apply.
Volunteering Drives Donations
45%
24%
73%
1%
Much
more/somewhat
more likely to
donate
Did not affect
my likelihood
Much
less/somewhat
less likely to
donate
What effect did volunteering have on your decision on whether to financially support the
nonprofit? Among those who said they had volunteered.
Event Attendance Drives Engagement
58%
1%
1%
95%
4%
Very/Somewhat
engaged
Not too/Not
engaged at all
Not sure
56% 23%
74%
0%
Much
more/somewhat
more likely to
donate
Did not affect my
likelihood
Much
less/somewhat less
likely to donate
What effect did attending the event have on your
decision on whether to financially support the
nonprofit?
How engaged with the organization did
attending that event make you feel?
**Among those who said they had attended an event**
Communicating
Engagement: Communicating
29%
25%
16%
13%
10%
Spread the word or told others about the
charity/group
Stayed informed through emails and/or
newsletters
Followed on social media
Shared/retweeted/pinned info
Participated in advocacy actions on behalf
of the organization
Content
Content is King.
Content is Money.
72% may stop donating to an organization
based on unsatisfactory content.
Content Matters
At least
one
would
affect
whether
I donate,
72%
None
would
affect
whether
I donate,
28%
35%
25%
24%
24%
19%
14%
12%
10%
Too vague
About programs I'm…
Dull and boring
Has incorrect info about me
In an inconvenient format
Not suited to my region
Not suited to my age
Isn't personalized
• Nearly three-quarters say quality matters
at least somewhat, with one-third who
feel that way strongly.
• Fewer than one-in-ten say it doesn’t
matter at all.
Quality Matters
Personalization Makes Donors Feel
More Engaged
30%
3%
14%
71%
15%
It makes me more
engaged
It make me less engaged
(It's a little creepy!)
Don't know
Which of the following statements comes closer to expressing your opinion
When I receive something from a nonprofit organization or charitable cause that I
support that is personalized to me and my activities specifically . . .
Content
Recommendations
Most Likely To Inspire Action
Short YouTube video
(Under 2 minutes)
Short letter or online article
(2-3 paragraphs)
Posts on Facebook
Easiest to Consume
Short YouTube video Short letter or online article Short, self-contained emailShort YouTube video
(Under 2 minutes)
Short letter or online article
(2-3 paragraphs)
Most Effective in Communicating Info
Short letter or online article Short YouTube video
(Under 2 minutes)
Short letter or online article
(2-3 paragraphs)
Most Powerful for Storytelling
Short YouTube video Medium-length YouTube video
(2-10 minutes)
Long-form article
(More than a page)
Short YouTube video
(Under 2 minutes)
Most Likely to Keep Donors Engaged
Short, self-contained emailPosts on FacebookShort letter or online article
(2-3 paragraphs)
• Donors are most favorable to content that
was short and self-contained, such as
emails, short articles, and YouTube videos
under two minutes.
• Millennials and Gen Xers are more
tolerant of longer content than boomers
and matures.
Length Matters
Length Matters: Video
67%
56%
45%
40%
25%
13%
10%
21%
32%
37%
52%
64%
1 minute or less
2 minutes
3 minutes
4 minutes
5 minutes
10 minutes
Still watching at X minutes . . . . . . Starting to lose patience at X minutes
Don’t know
(23%)
Length Matters: Written Content
67%
58%
44%
34%
20%
7%
7%
16%
30%
40%
54%
67%
1 paragraph or less
2 paragraphs
3 paragraphs
4 paragraphs
5 paragraphs
10 paragraphs
Still reading at X paragraphs . . . . . . Starting to lose patience at X paragraphs
Don’t know
(26%)
Frequency Matters
of donors would like communication
at least monthly.
57%
Generational Breakdown
12%
4%
4%
4%
21%
22%
7%
12%
12%
10%
9%
4%
27%
26%
28%
14%
15%
24%
32%
33%
7%
9%
11%
24%
3%
3%
6%
6%
Millennials
Gen X
Boomers
Matures
Weekly+ Weekly Twice a month Monthly Quarterly Annually Never
Millennials are X times more likely to
consume this than Matures
1x
2x
3x
4x
5x
6x
10x
Self
contained
email
Short
letter /
online
article
Annual
report via
mail
Email
with
links
Long
form
article
Short
YouTube
video
Medium
YouTube
video
Longer
YouTube
video
Posts on
Facebook
7x
8x
9x
PodcastsPosts on
Twitter
Money
Donors Trust Nonprofits to Spend Money Wisely
• 93% of donors are confident that the
organizations they support are spending
money wisely.
• 52% of donors trust the organization to use
money where it is most needed.
Restricted Funds
When you donate, are you more likely to donate to restricted funds that can only be used for
one purpose (such as a specific program the nonprofit runs), or to unrestricted funds that can
be used however the nonprofit decides?
15%
37%
12%
32%
23%
Restricted funds,
much/somewhat more often
Donate to both equally Unrestricted funds
somewhat/much more often
Debunking the Overhead Myth
85%
54%
50%
47%
46%
40%
35%
25%
26%
7%
25%
28%
28%
28%
27%
32%
34%
25%
5%
13%
14%
16%
17%
22%
20%
23%
23%
Directly helping those in need
Setting up events that help deliver on the nonprofit’s…
Setting up events that raise funds for the nonprofit
Publicizing and communicating the mission of the…
Reaching out to volunteers
Reaching out to other donors
Staffing the nonprofit
Going to administrative costs – such as computers,…
Lobbying efforts
Happy Fine with it Disappointed Angry
21%
12%
www.abila.com/donorloyaltystudy
Abila provides software and services to
associations and nonprofit organizations
and governmental entities that help them:
improve decision making
execute withgreater precision
increase engagement
generate more revenue
Q&A
Contact Rich Dietz
Rich.Dietz@abila.com
Contact Tad Druart
Tad.Druart@abila.com

Digging Deeper Into Donor Preferences | AFPFC 2016

  • 1.
    Digging Deeper Into DonorBehavior & Preferences: 2016 Donor Loyalty Study 1
  • 2.
    Last Year 2015 Donor Engagement Study Weset out to find the disconnect between nonprofit practices and donor preferences. We conducted two online surveys: • Donor Survey • Nonprofit Professional Survey Study released April 2015. Sneak Peak @ AFPFC 2015
  • 3.
    • Fundamentals arekey for nonprofit organizations. • Donors and organizations are misaligned on communication frequency. • Critical content is more important than frequency or channel. • Giving (or the act of giving) makes donors feel the most engaged. • Age/generational engagement is a missed opportunity. • Organizations are missing opportunities not using data to drive strategy. Here’s What We Learned
  • 4.
  • 5.
    How Donors FeelMost Engaged
  • 6.
    of donors feelthat their top charity takes their preferences into consideration. Only 52%
  • 7.
  • 9.
  • 11.
    • Surveyed 1,136donors in the US who made at least one donation in the last 12 months. • The survey took place between Feb. 3 - Feb. 16 2016. Donor Loyalty Study Coming Soon! Study Releasing April 12.
  • 12.
    How Donors Engage 10% 11% 13% 13% 16% 16% 17% 18% 21% 25% 27% 29% 36% 40% 44% 56% Participateadin advocacy on behalf of the organization Served in a volunteer leadership role, liike a committee or board Gave money for an occasion such as a birthday or tribute to an… Shared/retweeted/pinned info Fundraised for the charity/group Followed on social media Sponsored a friend or family member raising money Gave to a charity through their monthly giving program Attended or pariticapted in a fundraising event Stayed informed through emails and/or newsletters Bought products that support them Spread the word or told others about the charity/group Volunteered your time Donated money directly through the website Donated money directly through a check Donated goods and services like clothing In which of the following ways have you been involved with a nonprofit organization in the past 12 months? select all that apply.
  • 13.
    Ways Donors Engage •Donating goods and services • Giving money • Buying products Giving • Volunteering • Attending events • Serving in leadership role Doing • Staying informed • Engaging on social media • Advocacy Communicating
  • 14.
  • 15.
    Engagement: Giving 56% 44% 40% 27% 18% 17% 16% 13% Donated goodsand services, like clothing Donated money directly through a check in the mail Donated money directly through the website Bought products that support them Gave to a charity through their monthly giving program Sponsored a friend or family member raising money for a nonprofit organization Fundraised for the charity/group Gave money for an occasion such as a birthday or in tribute to an individual In which of the following ways have you been involved with a nonprofit organization in the past 12 months? Select all that apply.
  • 16.
    How Donors Give 31% 38% 52% 65% 39%41% 41% 31% Millennials Gen X Boomers Matures Check through mail Through website
  • 17.
    Main Reasons forDonating 59% 45% 33% 18% 16% 16% 13% 8% 8% 3% I am passionate about the cause I know that the organization I care about depends… I know someone affected by their cause Moved to donate in response to an event in the… To memorialize someone Someone I know directly asked me to donate Awareness through ads/communication As a gift to a friend or loved one (birthday,… Saw a post on social media Other Top Reasons for Donating It’s all about me!
  • 18.
    Generational Breakdown 63% 62% 56%55% 36% 39% 51% 65% 33% 32% 34% 33% 15% 14% 19% 27% Millennials Gen X Boomers Mature Passionate about cause Organization I care about depends on them Know someone affected by cause Moved to donate in response to event in news
  • 19.
  • 20.
    Engagement: Doing 36% 21% 11% Volunteered yourtime Attended or participated in fundraising events such as a party, run, walk, bike, music event, etc. Served in a volunteer leadership role, like a committee or board In which of the following ways have you been involved with a nonprofit organization in the past 12 months? Select all that apply.
  • 21.
    Volunteering Drives Donations 45% 24% 73% 1% Much more/somewhat morelikely to donate Did not affect my likelihood Much less/somewhat less likely to donate What effect did volunteering have on your decision on whether to financially support the nonprofit? Among those who said they had volunteered.
  • 22.
    Event Attendance DrivesEngagement 58% 1% 1% 95% 4% Very/Somewhat engaged Not too/Not engaged at all Not sure 56% 23% 74% 0% Much more/somewhat more likely to donate Did not affect my likelihood Much less/somewhat less likely to donate What effect did attending the event have on your decision on whether to financially support the nonprofit? How engaged with the organization did attending that event make you feel? **Among those who said they had attended an event**
  • 23.
  • 24.
    Engagement: Communicating 29% 25% 16% 13% 10% Spread theword or told others about the charity/group Stayed informed through emails and/or newsletters Followed on social media Shared/retweeted/pinned info Participated in advocacy actions on behalf of the organization
  • 25.
  • 26.
  • 27.
  • 28.
    72% may stopdonating to an organization based on unsatisfactory content. Content Matters At least one would affect whether I donate, 72% None would affect whether I donate, 28% 35% 25% 24% 24% 19% 14% 12% 10% Too vague About programs I'm… Dull and boring Has incorrect info about me In an inconvenient format Not suited to my region Not suited to my age Isn't personalized
  • 29.
    • Nearly three-quarterssay quality matters at least somewhat, with one-third who feel that way strongly. • Fewer than one-in-ten say it doesn’t matter at all. Quality Matters
  • 30.
    Personalization Makes DonorsFeel More Engaged 30% 3% 14% 71% 15% It makes me more engaged It make me less engaged (It's a little creepy!) Don't know Which of the following statements comes closer to expressing your opinion When I receive something from a nonprofit organization or charitable cause that I support that is personalized to me and my activities specifically . . .
  • 31.
  • 32.
    Most Likely ToInspire Action Short YouTube video (Under 2 minutes) Short letter or online article (2-3 paragraphs) Posts on Facebook
  • 33.
    Easiest to Consume ShortYouTube video Short letter or online article Short, self-contained emailShort YouTube video (Under 2 minutes) Short letter or online article (2-3 paragraphs)
  • 34.
    Most Effective inCommunicating Info Short letter or online article Short YouTube video (Under 2 minutes) Short letter or online article (2-3 paragraphs)
  • 35.
    Most Powerful forStorytelling Short YouTube video Medium-length YouTube video (2-10 minutes) Long-form article (More than a page) Short YouTube video (Under 2 minutes)
  • 36.
    Most Likely toKeep Donors Engaged Short, self-contained emailPosts on FacebookShort letter or online article (2-3 paragraphs)
  • 37.
    • Donors aremost favorable to content that was short and self-contained, such as emails, short articles, and YouTube videos under two minutes. • Millennials and Gen Xers are more tolerant of longer content than boomers and matures. Length Matters
  • 38.
    Length Matters: Video 67% 56% 45% 40% 25% 13% 10% 21% 32% 37% 52% 64% 1minute or less 2 minutes 3 minutes 4 minutes 5 minutes 10 minutes Still watching at X minutes . . . . . . Starting to lose patience at X minutes Don’t know (23%)
  • 39.
    Length Matters: WrittenContent 67% 58% 44% 34% 20% 7% 7% 16% 30% 40% 54% 67% 1 paragraph or less 2 paragraphs 3 paragraphs 4 paragraphs 5 paragraphs 10 paragraphs Still reading at X paragraphs . . . . . . Starting to lose patience at X paragraphs Don’t know (26%)
  • 40.
    Frequency Matters of donorswould like communication at least monthly. 57%
  • 41.
  • 42.
    Millennials are Xtimes more likely to consume this than Matures 1x 2x 3x 4x 5x 6x 10x Self contained email Short letter / online article Annual report via mail Email with links Long form article Short YouTube video Medium YouTube video Longer YouTube video Posts on Facebook 7x 8x 9x PodcastsPosts on Twitter
  • 43.
  • 44.
    Donors Trust Nonprofitsto Spend Money Wisely • 93% of donors are confident that the organizations they support are spending money wisely. • 52% of donors trust the organization to use money where it is most needed.
  • 45.
    Restricted Funds When youdonate, are you more likely to donate to restricted funds that can only be used for one purpose (such as a specific program the nonprofit runs), or to unrestricted funds that can be used however the nonprofit decides? 15% 37% 12% 32% 23% Restricted funds, much/somewhat more often Donate to both equally Unrestricted funds somewhat/much more often
  • 46.
    Debunking the OverheadMyth 85% 54% 50% 47% 46% 40% 35% 25% 26% 7% 25% 28% 28% 28% 27% 32% 34% 25% 5% 13% 14% 16% 17% 22% 20% 23% 23% Directly helping those in need Setting up events that help deliver on the nonprofit’s… Setting up events that raise funds for the nonprofit Publicizing and communicating the mission of the… Reaching out to volunteers Reaching out to other donors Staffing the nonprofit Going to administrative costs – such as computers,… Lobbying efforts Happy Fine with it Disappointed Angry 21% 12%
  • 47.
    www.abila.com/donorloyaltystudy Abila provides softwareand services to associations and nonprofit organizations and governmental entities that help them: improve decision making execute withgreater precision increase engagement generate more revenue Q&A Contact Rich Dietz Rich.Dietz@abila.com Contact Tad Druart Tad.Druart@abila.com

Editor's Notes

  • #13 In which of the following ways have you been involved with a nonprofit organization in the past 12 months? Please select all that apply.
  • #23 Bold thing
  • #30 Content that is thoughtful and with some level of professionalism
  • #33 Short YouTube videos, articles, and emails all scored high among a variety of dimensions. Medium-length YouTube videos and long-form articles were powerful for telling a story, while Facebook was ideal for inspiring action and keeping donors engaged.
  • #34 Short YouTube videos, articles, and emails all scored high among a variety of dimensions. Medium-length YouTube videos and long-form articles were powerful for telling a story, while Facebook was ideal for inspiring action and keeping donors engaged.
  • #35 Short YouTube videos, articles, and emails all scored high among a variety of dimensions. Medium-length YouTube videos and long-form articles were powerful for telling a story, while Facebook was ideal for inspiring action and keeping donors engaged.
  • #36 Short YouTube videos, articles, and emails all scored high among a variety of dimensions. Medium-length YouTube videos and long-form articles were powerful for telling a story, while Facebook was ideal for inspiring action and keeping donors engaged.
  • #37 Short YouTube videos, articles, and emails all scored high among a variety of dimensions. Medium-length YouTube videos and long-form articles were powerful for telling a story, while Facebook was ideal for inspiring action and keeping donors engaged.
  • #39 How long, in minutes, starts to be too long, and negatively affects your feelings towards the organization, when you are watching a video from a nonprofit?
  • #40 And how long, in paragraphs, starts to be too long, and negatively affects your feelings towards the organization, when reading content from a nonprofit? (If one paragraph, or less, please put “1”.)
  • #43 Every single type of content tested followed the same pattern*: It was most likely to be consumed (rated 6-10) by millennials, then gen Xers, then boomers, then matures. The line below shows the ratio of millennials’ consumption likelihood to matures’ consumption likelihood. A “5” means millennials are 5 times more likely to rank this a 6-10.