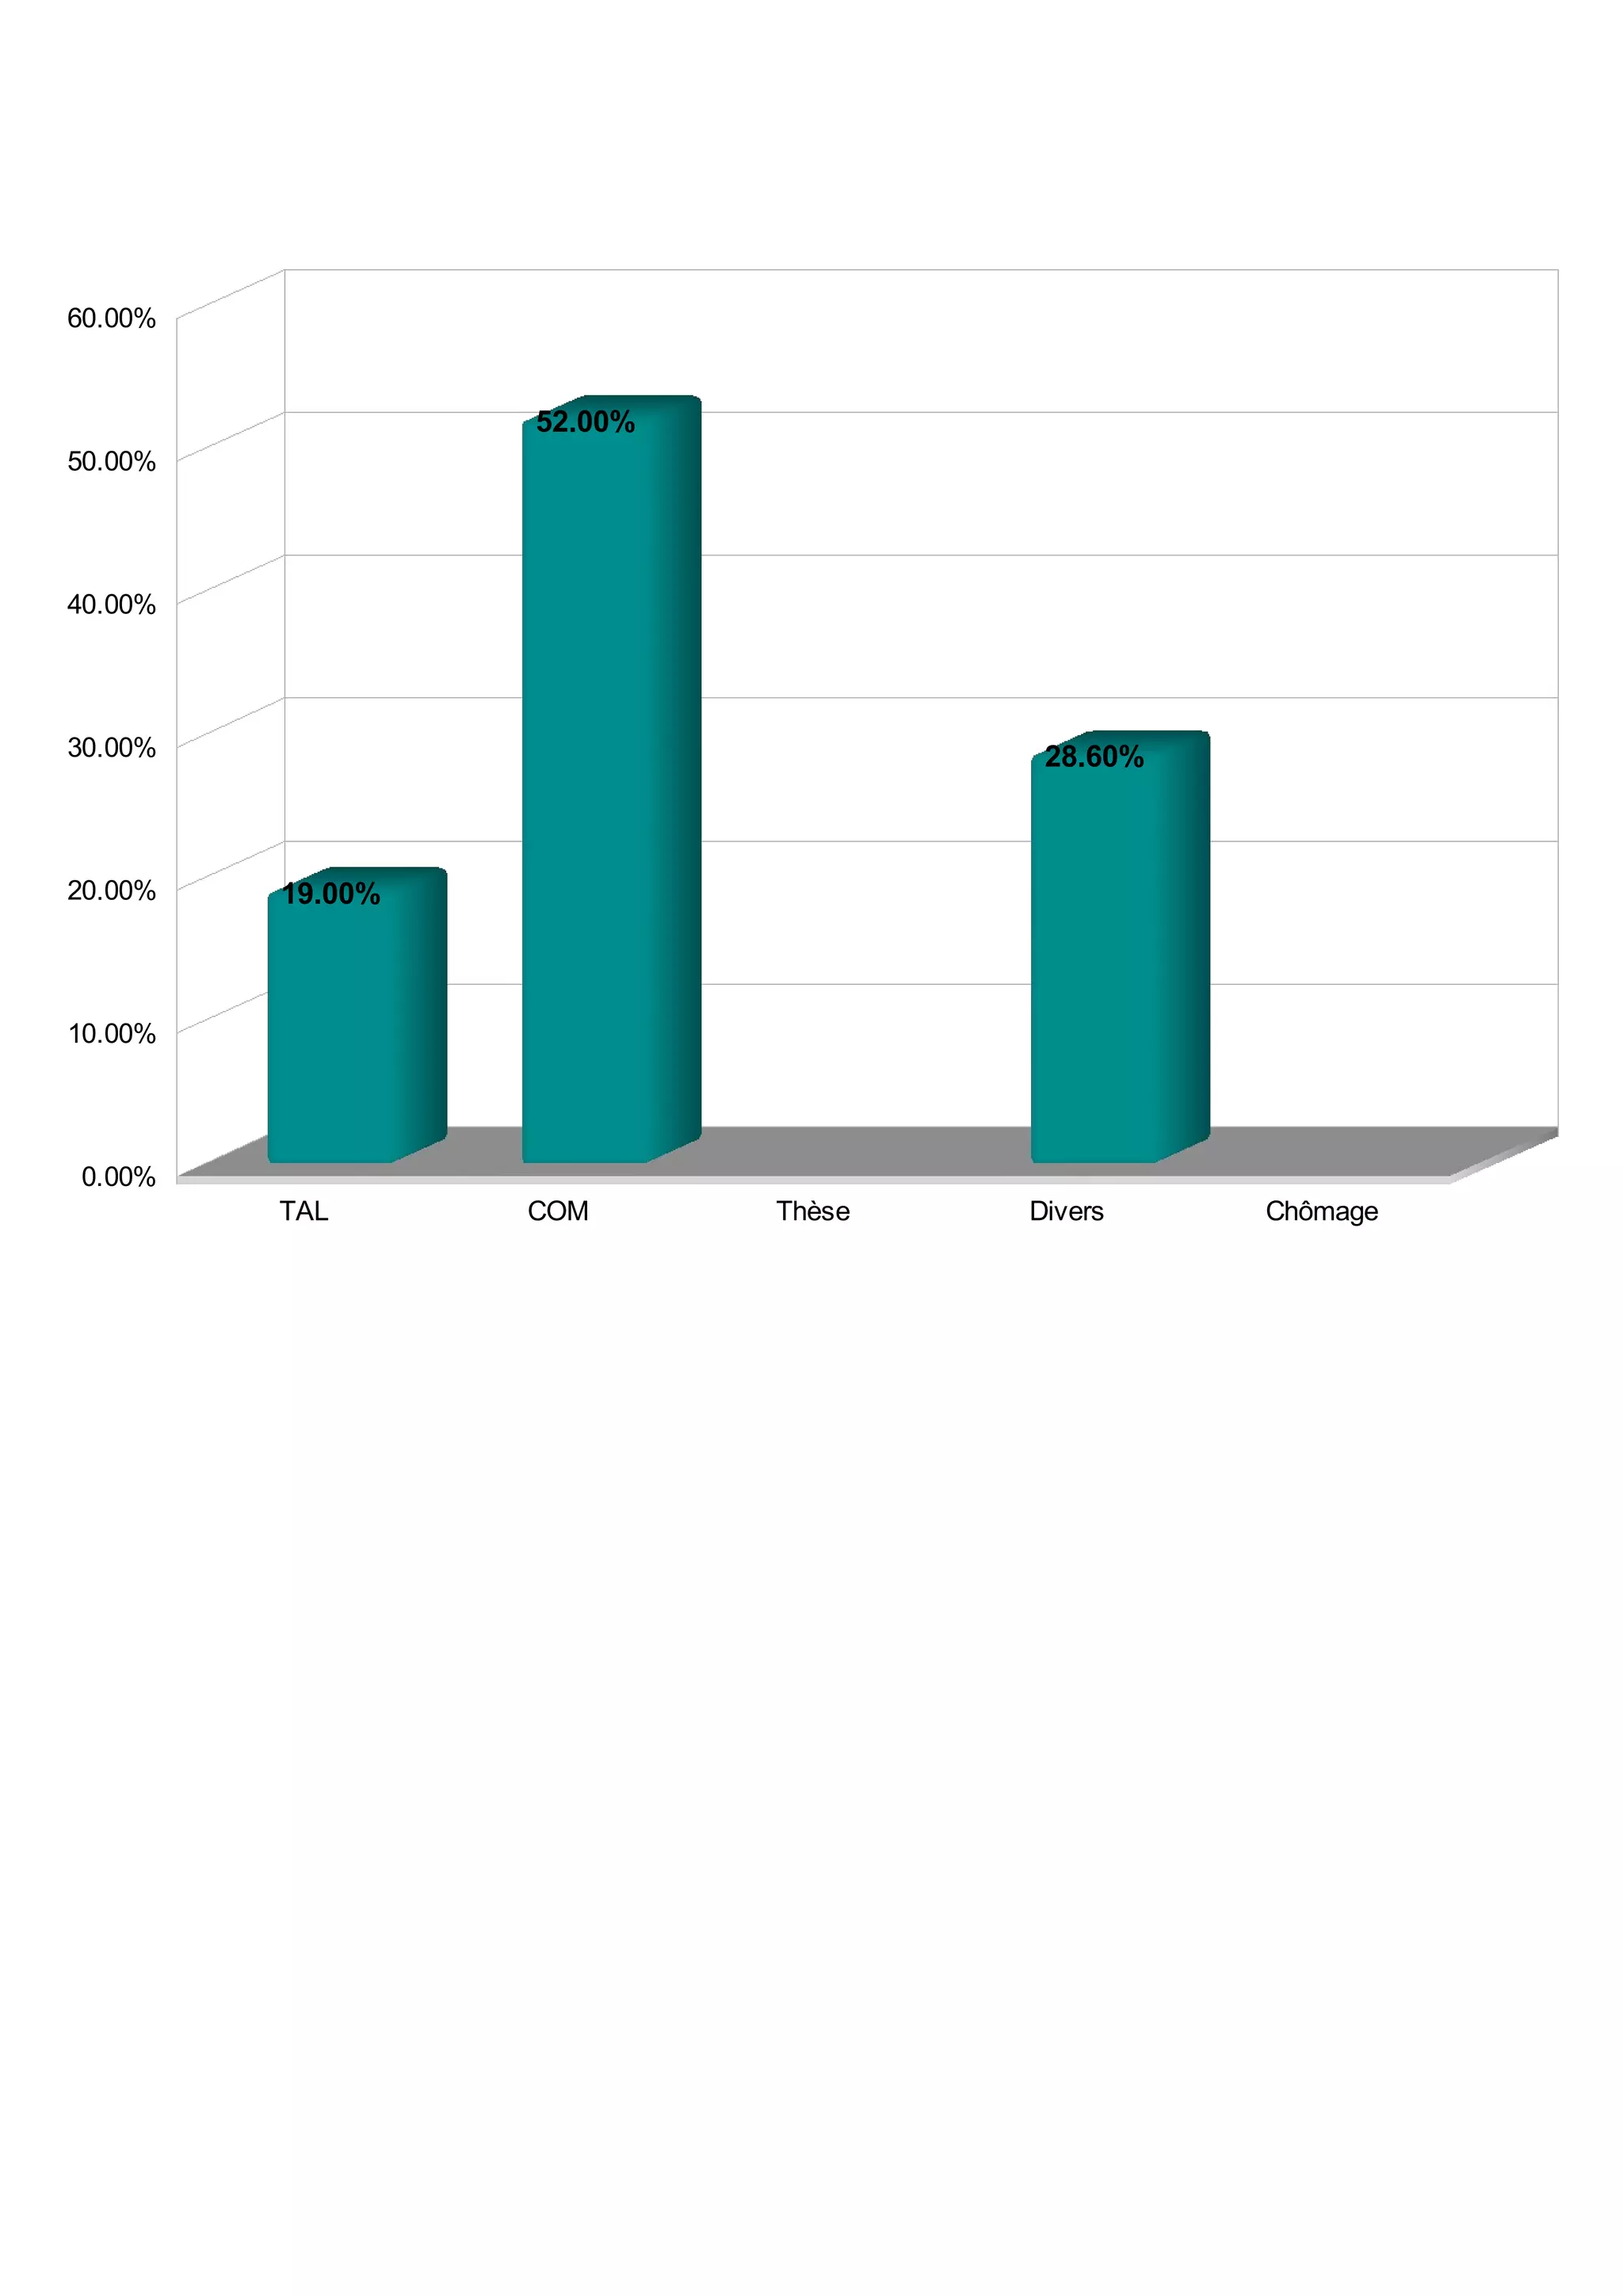
The document shows a bar graph comparing percentages across 5 categories: TAL at 60%, COM at 52%, Thèse at 28.6%, Divers at 19%, and Chômage at 0%. TAL has the highest percentage at 60% while Chômage has the lowest at 0%.