Building 10x Organizations with Modern Productivity Metrics
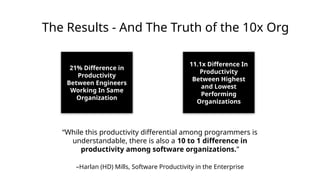
10x developers may be a myth, but 10x organizations are very real, as proven by the influential study performed in the 1980s, ‘The Coding War Games.’
Right now, here in early 2025, we seem to be experiencing YAPP (Yet Another Productivity Philosophy), and that philosophy is converging on developer experience. It seems that with every new method we invent for the delivery of products, whether physical or virtual, we reinvent productivity philosophies to go alongside them.
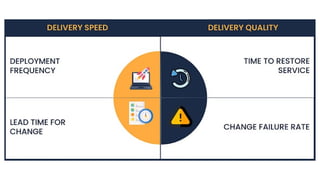
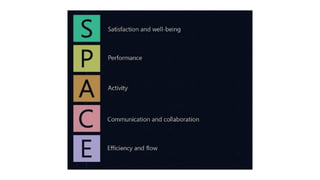
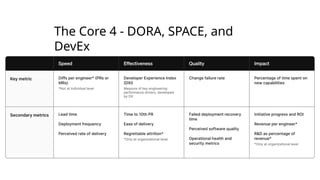
But which of these approaches actually work? DORA? SPACE? DevEx? What should we invest in and create urgency behind today, so that we don’t find ourselves having the same discussion again in a decade?


![[NYC Scrum] 4 bad ideas about productivity... and what Agilists should do ins...](https://cdn.slidesharecdn.com/ss_thumbnails/nycscrum4badideasaboutproductivity-250320014757-d85c2fbe-thumbnail.jpg?width=640&height=640&fit=bounds)