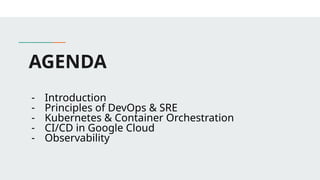
DevOps & Site Reliability
Engineering (SRE)
Leroy Mataa-Hewa Abiguime
DevOps , Cloud Engineer
2*Kubernetes Certified, AWS and GCP Certified
AGENDA
- Introduction
- Principles of DevOps & SRE
- Kubernetes & Container Orchestration
- CI/CD in Google Cloud
- Observability
Principles of DevOps & SRE
- What is DevOps?
- Culture > Tools
- What is SRE ?
- Origin at Google
- Differences and overlaps with DevOps
- The SRE 4 golden signals
- Core Concepts:
- SLIs, SLOs, SLAs
- Error budgets
- Toil and automation
What’s DevOps ?
DevOps is a philosophy that consolidates development teams and IT
operations in order to facilitate a collaborative effort throughout the software
development lifecycle. DevOps helps organizations maximize productivity and
performance while reducing the time from design to deployment.
Culture vs Tools
Tooling is an important component of DevOps, particularly given the emphasis
on managing change correctly—today, change management relies on highly
specific tools. Overall, however, proponents of DevOps strongly emphasize
organizational culture—rather than tooling—as the key to success in adopting
a new way of working. A good culture can work around broken tooling, but the
opposite rarely holds true. As the saying goes, culture eats strategy for
breakfast. Like operations, change itself is hard.
What’s SRE?
Origin at Google
- Web-scale reliability needs: Google was one of the first companies with
truly massive reliability needs. Google was on the frontier of a new type of
user experience that involved minimal downtime and latency. Building an
SRE team was an obvious step toward achieving that goal.
- Massive infrastructure:Along similar lines, Google was one of the first
companies with a truly massive, distributed infrastructure. . In 2003, the
public cloud was not yet a thing, and few businesses had hundreds of
thousands of servers spread across dozens of data centers to manage.
But Google did, which is why it needed a strategy that would enable
large-scale automation of reliability across this sprawling infrastructure.
- There was no DevOps: But, in 2003, DevOps didn’t yet exist, so Google
had to invent its own concept from scratch.
Differences and overlaps with DevOps ?
Focus:
- SRE focuses on the stability of the tools and features in production. It
seeks to maintain low failure rates and high reliability for end users. This
includes system scalability and robustness.
- DevOps focuses on using a collaborative approach for building tools and
features. It strives to identify and implement the best ideas by including
the development and operations teams.
Differences and overlaps with DevOps ?
Responsibility :
- SRE’s primary responsibility is system reliability. Regardless of the
features deployed to production, SRE ensures they don't cause
infrastructure issues, security risks, or increased failure rates.
- DevOps is responsible for building the features necessary to meet
customer needs. Unlike older approaches, DevOps increases its
efficiency through collaboration across the development and operations
teams.
Differences and overlaps with DevOps ?
Objectives :
- Objectives SRE strives for robust and reliable systems that allow
customers to perform their jobs without disruption.
- DevOps aims to deliver customer value through streamlining the product
development lifecycle and accelerating the rate of product releases.
The four golden signals
The four golden signals of monitoring are latency, traffic, errors, and saturation.
If you can only measure four metrics of your user-facing system, focus on
these four.
- Latency: The time it takes to service a request.
- Traffic: A measure of how much demand is being placed on your system,
measured in a high-level system-specific metric.
- Errors: The rate of requests that fail, either explicitly (e.g., HTTP 500s),
implicitly (for example, an HTTP 200 success response, but coupled with
the wrong content), or by policy (for example, "If you committed to one-
second response times, any request over one second is an error")
The four golden signals
The four golden signals of monitoring are latency, traffic, errors, and saturation.
If you can only measure four metrics of your user-facing system, focus on
these four.
- Saturation: How "full" your service is. A measure of your system fraction,
emphasizing the resources that are most constrained (e.g., in a memory-
constrained system, show memory; in an I/O-constrained system, show
I/O). Note that many systems degrade in performance before they
achieve 100% utilization, so having a utilization target is essential.
CORE CONCEPTS
- Service-Level Objective (SLO):
SRE begins with the idea that a prerequisite to success is availability. A
system that is unavailable cannot perform its function and will fail by
default. When we set out to define the terms of SRE, we wanted to set a
precise numerical target for system availability. We term this target the
availability Service-Level Objective (SLO) of our system. Any discussion
we have in the future about whether the system is running sufficiently
reliably and what design or architectural changes we should make to it
must be framed in terms of our system continuing to meet this SLO.
CORE CONCEPTS
- Service-Level Agreement (SLA):
An SLA normally involves a promise to someone using your service that
its availability SLO should meet a certain level over a certain period, and if
it fails to do so then some kind of penalty will be paid. This might be a
partial refund of the service subscription fee paid by customers for that
period, or additional subscription time added for free.
The concept is that going out of SLO is going to hurt the service team, so
they will push hard to stay within SLO. If you’re charging your customers
money, you will probably need an SLA. Because of this, and because of
the principle that availability shouldn’t be much better than the SLO, the
availability SLO in the SLA is normally a looser objective than the internal
availability SLO. This might be expressed in availability numbers: for
instance, an availability SLO of 99.9% over one month, with an internal
availability SLO of 99.95%.
CORE CONCEPTS
- Service-Level Indicator (SLI):
An SLA normally involves a promise to someone using your service that its
availability SLO should meet a certain level over a certain period, and if it fails to do
so then some kind of penalty will be paid. This might be a partial refund of the
service subscription fee paid by customers for that period, or additional subscription
time added for free.
We also have a direct measurement of a service’s behavior: the frequency of
successful probes of our system. This is a Service-Level Indicator (SLI). When we
evaluate whether our system has been running within SLO for the past week, we
look at the SLI to get the service availability percentage. If it goes below the
specified SLO, we have a problem and may need to make the system more
available in some way, such as running a second instance of the service in a
different city and load-balancing between the two. If you want to know how reliable
your service is, you must be able to measure the rates of successful and
unsuccessful queries as your SLIs.
CORE CONCEPTS
- Errors Budget:
In a nutshell, an error budget is the amount of error that your service can accumulate
over a certain period of time before your users start being unhappy. You can think of it as
the pain tolerance for your users, but applied to a certain dimension of your service:
availability, latency, and so forth.
A recommendation for defining an SLI, you’re likely using this SLI equation:
TOIL and Automation
- What’s TOIL ?
Toil is the kind of work tied to running a production service that tends to be manual,
repetitive, automatable, tactical, devoid of enduring value, and that scales linearly as a
service grows. Not every task deemed toil has all these attributes, but the more closely
work matches one or more of the following descriptions, the more likely it is to be toil:
- Manual
- Repetitive
- Automatable
Q & A
Kubernetes & Container
Orchestration
- What is Docker , Why Docker ?
- Kubernetes 101:
- Pods, Nodes, Services, Deployments
- How Kubernetes helps reliability and scaling
- Déclarative infrastructure
- Basic YAML manifest example
- Add-on tools: HELM, ArgoCD
What’s DOCKER
- Docker is an open platform for developing, shipping, and running
applications. Docker enables you to separate your applications from your
infrastructure so you can deliver software quickly. With Docker, you can
manage your infrastructure in the same ways you manage your
applications. By taking advantage of Docker's methodologies for shipping,
testing, and deploying code, you can significantly reduce the delay
between writing code and running it in production.
WHY DOCKER ?
- When optimizing the software development process: Docker offers its
user a reproducible environment. The whole application development
workflow has been streamlined, especially since its containers handle the
bulk of the configuration, development, and deployment processes.
- If you want to increase developer productivity and efficiency: Docker
enables you to distribute code and its dependencies among your team
members consistently.
- If you want to encourage CI/CD practices: Docker containerized
applications are created in standardized environments that have been
streamlined to save build time and run anywhere. Additionally, Docker has
a tool ecosystem and can be integrated with source control and
integration platforms like GitHub to help you handle environmental
conflicts. Hence, they are excellent for DevOps and Agile work processes.
Kubernetes 101
- https://kubernetes.io/docs/tutorials/kubernetes-basics/
- https://kubernetes.io/docs/concepts/workloads/pods/
- https://helm.sh/
- https://argo-cd.readthedocs.io/en/stable/
Q & A
CI/CD in Google Cloud
- CI vs CD: what’s the difference ?
- Tools on GCP: Cloud Build, Cloud Deploy, Artifact registry
- GitOps
What’s CI/CD
- Continuous Integration (CI), at its core, is about getting feedback early
and often, which makes it possible to identify and correct problems early
in the development process. With CI, you integrate your work frequently,
often multiple times a day, instead of waiting for one large integration later
on. Each integration is verified with an automated build, which enables
you to detect integration issues as quickly as possible and reduce
problems downstream.
- Continuous Delivery (CD) extends CI. CD is about packaging and
preparing the software with the goal of delivering incremental changes to
users. Deployment strategies such as red/black and canary deployments
can help reduce release risk and increase confidence in releases. CD
makes the release process safer, lower risk, faster, and, when done well,
boring. Once deployments are made painless with CD, developers can
focus on writing code, not tweaking deployment scripts.
CI vs CD
- Continuous Integration (CI) focuses on automating the integration of code
changes to ensure that new code is frequently tested and merged into a
shared repository.
- Continuous Delivery (CD) automates the delivery of this code to
production and ensures updates are always production-ready.
Cloud Build
Cloud Build is a fully-managed CI/CD platform that lets you build, test, and
deploy across hybrid and multi-cloud environments that include VMs,
serverless, Kubernetes, and Firebase. Cloud Build can import source code
from Cloud Storage, Cloud Source Repositories, GitHub, or Bitbucket; execute
a build to your specifications; and produce artifacts such as Docker container
images or Java archives.
Cloud Deploy
​
​
Google Cloud Deploy (in preview) is a managed, opinionated continuous
delivery service that makes continuous delivery to GKE easier, faster, and
more reliable. It has built in security controls and it can be integrated with your
existing DevOps ecosystem.
Artifact registry
Artifact Registry is a fully-managed package manager on Google Cloud that
provides a single place to store and manage container images and language
packages like Maven and npm. It integrates with Google Cloud tooling and
runtimes, simplifying the process of building, testing, and deploying
applications.
Q & A
Observability & Incident
Response
- Monitoring vs Observability
- The 3 pillars: Metrics, Logs, Traces
- Tools: Google Cloud Operations Suite
- Setup alerts, dashboards
- Incident -> Triage -> Mitigation -> Postmortem
- Role of on-call and SRE playbooks
Monitoring
The purpose of monitoring is to promote effective communication. In modern
IT, monitoring tells the DevOps or Site Reliability Engineering (SRE) teams how
well an observable system is doing its job.
What problems might cause a warning from your monitoring tools? There are
multiple possibilities, but here are some examples:
- Network latency Poor
- application response time
- Decreased I/O performance
- Failed database operations
Observability
According to Wikipedia, “observability is the measure of how well internal
states of a system can be inferred from knowledge of its external outputs."
Think of it in terms of a patient receiving routine medical care after
experiencing a nagging pain. From an IT perspective, the goal of observability
is to analyze external outputs—like symptoms—that provide windows into how
the system is functioning internally. Observability examines effects and then
correlates that to a specific cause.
Observability
An observable system's external outputs include metrics, events, traces and
logs. Some examples of how DevOps engineers can take advantage of
observability include: Security anomaly detection Cost analysis of cloud
resources Call trace analysis to determine how specific input values are
impacting program failure Identification of seasonal spikes in system load and
tying that back to a suboptimal load balancer
Monitoring vs Observability
Monitoring tells you that something is wrong. Observability uses data collection
to tell you what is wrong and why it happened.
The 3 pillars: Metrics, Logs, Traces
The three pillars of observability are logs, metrics, and traces. These three data
outputs provide different insights into the health and functions of systems in
cloud and microservices environments.
- Logs are the archival or historical records of system events and errors,
which can be plain text, binary, or structured with metadata.
- Metrics are numerical measurements of system performance and
behavior, such as CPU usage, response time, or error rate.
- Traces are the representations of individual requests or transactions that
flow through a system, which can help identify bottlenecks, dependencies,
and root causes of issues.
What is the operations
suite?
Google Cloud’s operations suite is made up of products to monitor, troubleshoot
and operate your services at scale, enabling your DevOps, SREs, or ITOps
teams to utilize the Google SRE best practices. It offers integrated capabilities
for monitoring, logging, and advanced observability services like trace,
debugger and profiler.
The end-to-end operations solution includes built-in telemetry, out-of-box
dashboards, recommendations, alerts and more: Capturing signals Monitoring
systems Managing incidents Troubleshooting issues
Concepts
- Incident:
This is when something goes wrong in your system — a service is down, latency is
spiking, or errors are increasing.
• Examples: Website returns 500 errors, database crash, CI/CD
pipeline failure.
• Goal: Detect it fast (via alerts, logs, dashboards).
🛠 Tools: Prometheus, Grafana, Cloud Monitoring, Alertmanager, PagerDuty.
Concepts
Triage
You investigate the issue, assess the impact, and prioritize it.
• Questions:
• What’s broken?
• Who is affected (users, teams)?
Concepts
Triage
You investigate the issue, assess the impact, and prioritize it.
• Can it cause cascading failures?
• Goal: Quickly understand the scope and severity.
🛠 Tools: Runbooks, Dashboards, Logs, SLO dashboards.
Concepts
Mitigation
You take immediate actions to contain or resolve the issue.
• Examples:
• Roll back a bad deploy
• Reboot a node
Concepts
Mitigation
• Scale up a service
• Redirect traffic
• Goal: Restore user-facing functionality ASAP — even if it’s a
quick patch or workaround.
🛠 Tools: Kubernetes, Terraform, Cloud Console, Rollback Scripts.
Concepts
Postmortem
After the fire is out, you document what happened.
• What you include:
• Timeline of the incident
• Root cause
Concepts
Postmortem
After the fire is out, you document what happened.
• What went well
• What went wrong
• Action items (e.g., fix broken alerts, add tests, improve on-call
rotation)
• Goal: Learn and prevent similar incidents. No blame — it’s about
improving systems & culture.
Role of On-Call in SRE
Being on-call means you’re the first responder when things go wrong in production. It’s
like being the “firefighter” for your systems.
✅ Responsibilities:
• Respond to alerts: From monitoring tools or uptime checks.
• Triage issues: Quickly understand if it’s real, critical, or noise.
• Mitigate incidents: Rollbacks, scaling, restarting services, etc.
• Escalate if needed: If it’s too big or outside your domain.
• Communicate status: Updates to teams or status pages.
Q & A Discussion
UseFul Links:
- https://www.atlassian.com/devops/frameworks/calms-framework
- https://cloud.google.com/blog/topics/developers-practitioners/devops-and-cicd-goo
gle-cloud-explained?hl=en
- https://cloud.google.com/build#documentation
- https://kubernetes.io/docs/tutorials/kubernetes-basics/
- https://cloud.google.com/blog/topics/developers-practitioners/introduction-google-c
louds-operations-suite?hl=en

DevOps & Site Reliability Engineering (SRE).pptx

  • 1.
    DevOps & SiteReliability Engineering (SRE) Leroy Mataa-Hewa Abiguime DevOps , Cloud Engineer 2*Kubernetes Certified, AWS and GCP Certified
  • 2.
    AGENDA - Introduction - Principlesof DevOps & SRE - Kubernetes & Container Orchestration - CI/CD in Google Cloud - Observability
  • 3.
    Principles of DevOps& SRE - What is DevOps? - Culture > Tools - What is SRE ? - Origin at Google - Differences and overlaps with DevOps - The SRE 4 golden signals - Core Concepts: - SLIs, SLOs, SLAs - Error budgets - Toil and automation
  • 4.
    What’s DevOps ? DevOpsis a philosophy that consolidates development teams and IT operations in order to facilitate a collaborative effort throughout the software development lifecycle. DevOps helps organizations maximize productivity and performance while reducing the time from design to deployment. Culture vs Tools Tooling is an important component of DevOps, particularly given the emphasis on managing change correctly—today, change management relies on highly specific tools. Overall, however, proponents of DevOps strongly emphasize organizational culture—rather than tooling—as the key to success in adopting a new way of working. A good culture can work around broken tooling, but the opposite rarely holds true. As the saying goes, culture eats strategy for breakfast. Like operations, change itself is hard.
  • 5.
    What’s SRE? Origin atGoogle - Web-scale reliability needs: Google was one of the first companies with truly massive reliability needs. Google was on the frontier of a new type of user experience that involved minimal downtime and latency. Building an SRE team was an obvious step toward achieving that goal. - Massive infrastructure:Along similar lines, Google was one of the first companies with a truly massive, distributed infrastructure. . In 2003, the public cloud was not yet a thing, and few businesses had hundreds of thousands of servers spread across dozens of data centers to manage. But Google did, which is why it needed a strategy that would enable large-scale automation of reliability across this sprawling infrastructure. - There was no DevOps: But, in 2003, DevOps didn’t yet exist, so Google had to invent its own concept from scratch.
  • 6.
    Differences and overlapswith DevOps ? Focus: - SRE focuses on the stability of the tools and features in production. It seeks to maintain low failure rates and high reliability for end users. This includes system scalability and robustness. - DevOps focuses on using a collaborative approach for building tools and features. It strives to identify and implement the best ideas by including the development and operations teams.
  • 7.
    Differences and overlapswith DevOps ? Responsibility : - SRE’s primary responsibility is system reliability. Regardless of the features deployed to production, SRE ensures they don't cause infrastructure issues, security risks, or increased failure rates. - DevOps is responsible for building the features necessary to meet customer needs. Unlike older approaches, DevOps increases its efficiency through collaboration across the development and operations teams.
  • 8.
    Differences and overlapswith DevOps ? Objectives : - Objectives SRE strives for robust and reliable systems that allow customers to perform their jobs without disruption. - DevOps aims to deliver customer value through streamlining the product development lifecycle and accelerating the rate of product releases.
  • 9.
    The four goldensignals The four golden signals of monitoring are latency, traffic, errors, and saturation. If you can only measure four metrics of your user-facing system, focus on these four. - Latency: The time it takes to service a request. - Traffic: A measure of how much demand is being placed on your system, measured in a high-level system-specific metric. - Errors: The rate of requests that fail, either explicitly (e.g., HTTP 500s), implicitly (for example, an HTTP 200 success response, but coupled with the wrong content), or by policy (for example, "If you committed to one- second response times, any request over one second is an error")
  • 10.
    The four goldensignals The four golden signals of monitoring are latency, traffic, errors, and saturation. If you can only measure four metrics of your user-facing system, focus on these four. - Saturation: How "full" your service is. A measure of your system fraction, emphasizing the resources that are most constrained (e.g., in a memory- constrained system, show memory; in an I/O-constrained system, show I/O). Note that many systems degrade in performance before they achieve 100% utilization, so having a utilization target is essential.
  • 11.
    CORE CONCEPTS - Service-LevelObjective (SLO): SRE begins with the idea that a prerequisite to success is availability. A system that is unavailable cannot perform its function and will fail by default. When we set out to define the terms of SRE, we wanted to set a precise numerical target for system availability. We term this target the availability Service-Level Objective (SLO) of our system. Any discussion we have in the future about whether the system is running sufficiently reliably and what design or architectural changes we should make to it must be framed in terms of our system continuing to meet this SLO.
  • 12.
    CORE CONCEPTS - Service-LevelAgreement (SLA): An SLA normally involves a promise to someone using your service that its availability SLO should meet a certain level over a certain period, and if it fails to do so then some kind of penalty will be paid. This might be a partial refund of the service subscription fee paid by customers for that period, or additional subscription time added for free. The concept is that going out of SLO is going to hurt the service team, so they will push hard to stay within SLO. If you’re charging your customers money, you will probably need an SLA. Because of this, and because of the principle that availability shouldn’t be much better than the SLO, the availability SLO in the SLA is normally a looser objective than the internal availability SLO. This might be expressed in availability numbers: for instance, an availability SLO of 99.9% over one month, with an internal availability SLO of 99.95%.
  • 13.
    CORE CONCEPTS - Service-LevelIndicator (SLI): An SLA normally involves a promise to someone using your service that its availability SLO should meet a certain level over a certain period, and if it fails to do so then some kind of penalty will be paid. This might be a partial refund of the service subscription fee paid by customers for that period, or additional subscription time added for free. We also have a direct measurement of a service’s behavior: the frequency of successful probes of our system. This is a Service-Level Indicator (SLI). When we evaluate whether our system has been running within SLO for the past week, we look at the SLI to get the service availability percentage. If it goes below the specified SLO, we have a problem and may need to make the system more available in some way, such as running a second instance of the service in a different city and load-balancing between the two. If you want to know how reliable your service is, you must be able to measure the rates of successful and unsuccessful queries as your SLIs.
  • 14.
    CORE CONCEPTS - Service-LevelIndicator (SLI): An SLA normally involves a promise to someone using your service that its availability SLO should meet a certain level over a certain period, and if it fails to do so then some kind of penalty will be paid. This might be a partial refund of the service subscription fee paid by customers for that period, or additional subscription time added for free. We also have a direct measurement of a service’s behavior: the frequency of successful probes of our system. This is a Service-Level Indicator (SLI). When we evaluate whether our system has been running within SLO for the past week, we look at the SLI to get the service availability percentage. If it goes below the specified SLO, we have a problem and may need to make the system more available in some way, such as running a second instance of the service in a different city and load-balancing between the two. If you want to know how reliable your service is, you must be able to measure the rates of successful and unsuccessful queries as your SLIs.
  • 15.
    CORE CONCEPTS - ErrorsBudget: In a nutshell, an error budget is the amount of error that your service can accumulate over a certain period of time before your users start being unhappy. You can think of it as the pain tolerance for your users, but applied to a certain dimension of your service: availability, latency, and so forth. A recommendation for defining an SLI, you’re likely using this SLI equation:
  • 16.
    TOIL and Automation -What’s TOIL ? Toil is the kind of work tied to running a production service that tends to be manual, repetitive, automatable, tactical, devoid of enduring value, and that scales linearly as a service grows. Not every task deemed toil has all these attributes, but the more closely work matches one or more of the following descriptions, the more likely it is to be toil: - Manual - Repetitive - Automatable
  • 17.
  • 18.
    Kubernetes & Container Orchestration -What is Docker , Why Docker ? - Kubernetes 101: - Pods, Nodes, Services, Deployments - How Kubernetes helps reliability and scaling - Déclarative infrastructure - Basic YAML manifest example - Add-on tools: HELM, ArgoCD
  • 19.
    What’s DOCKER - Dockeris an open platform for developing, shipping, and running applications. Docker enables you to separate your applications from your infrastructure so you can deliver software quickly. With Docker, you can manage your infrastructure in the same ways you manage your applications. By taking advantage of Docker's methodologies for shipping, testing, and deploying code, you can significantly reduce the delay between writing code and running it in production.
  • 20.
    WHY DOCKER ? -When optimizing the software development process: Docker offers its user a reproducible environment. The whole application development workflow has been streamlined, especially since its containers handle the bulk of the configuration, development, and deployment processes. - If you want to increase developer productivity and efficiency: Docker enables you to distribute code and its dependencies among your team members consistently. - If you want to encourage CI/CD practices: Docker containerized applications are created in standardized environments that have been streamlined to save build time and run anywhere. Additionally, Docker has a tool ecosystem and can be integrated with source control and integration platforms like GitHub to help you handle environmental conflicts. Hence, they are excellent for DevOps and Agile work processes.
  • 21.
    Kubernetes 101 - https://kubernetes.io/docs/tutorials/kubernetes-basics/ -https://kubernetes.io/docs/concepts/workloads/pods/ - https://helm.sh/ - https://argo-cd.readthedocs.io/en/stable/
  • 22.
  • 23.
    CI/CD in GoogleCloud - CI vs CD: what’s the difference ? - Tools on GCP: Cloud Build, Cloud Deploy, Artifact registry - GitOps
  • 24.
    What’s CI/CD - ContinuousIntegration (CI), at its core, is about getting feedback early and often, which makes it possible to identify and correct problems early in the development process. With CI, you integrate your work frequently, often multiple times a day, instead of waiting for one large integration later on. Each integration is verified with an automated build, which enables you to detect integration issues as quickly as possible and reduce problems downstream. - Continuous Delivery (CD) extends CI. CD is about packaging and preparing the software with the goal of delivering incremental changes to users. Deployment strategies such as red/black and canary deployments can help reduce release risk and increase confidence in releases. CD makes the release process safer, lower risk, faster, and, when done well, boring. Once deployments are made painless with CD, developers can focus on writing code, not tweaking deployment scripts.
  • 25.
    CI vs CD -Continuous Integration (CI) focuses on automating the integration of code changes to ensure that new code is frequently tested and merged into a shared repository. - Continuous Delivery (CD) automates the delivery of this code to production and ensures updates are always production-ready.
  • 26.
    Cloud Build Cloud Buildis a fully-managed CI/CD platform that lets you build, test, and deploy across hybrid and multi-cloud environments that include VMs, serverless, Kubernetes, and Firebase. Cloud Build can import source code from Cloud Storage, Cloud Source Repositories, GitHub, or Bitbucket; execute a build to your specifications; and produce artifacts such as Docker container images or Java archives.
  • 27.
    Cloud Deploy ​ ​ Google CloudDeploy (in preview) is a managed, opinionated continuous delivery service that makes continuous delivery to GKE easier, faster, and more reliable. It has built in security controls and it can be integrated with your existing DevOps ecosystem.
  • 28.
    Artifact registry Artifact Registryis a fully-managed package manager on Google Cloud that provides a single place to store and manage container images and language packages like Maven and npm. It integrates with Google Cloud tooling and runtimes, simplifying the process of building, testing, and deploying applications.
  • 30.
  • 31.
    Observability & Incident Response -Monitoring vs Observability - The 3 pillars: Metrics, Logs, Traces - Tools: Google Cloud Operations Suite - Setup alerts, dashboards - Incident -> Triage -> Mitigation -> Postmortem - Role of on-call and SRE playbooks
  • 32.
    Monitoring The purpose ofmonitoring is to promote effective communication. In modern IT, monitoring tells the DevOps or Site Reliability Engineering (SRE) teams how well an observable system is doing its job. What problems might cause a warning from your monitoring tools? There are multiple possibilities, but here are some examples: - Network latency Poor - application response time - Decreased I/O performance - Failed database operations
  • 33.
    Observability According to Wikipedia,“observability is the measure of how well internal states of a system can be inferred from knowledge of its external outputs." Think of it in terms of a patient receiving routine medical care after experiencing a nagging pain. From an IT perspective, the goal of observability is to analyze external outputs—like symptoms—that provide windows into how the system is functioning internally. Observability examines effects and then correlates that to a specific cause.
  • 34.
    Observability An observable system'sexternal outputs include metrics, events, traces and logs. Some examples of how DevOps engineers can take advantage of observability include: Security anomaly detection Cost analysis of cloud resources Call trace analysis to determine how specific input values are impacting program failure Identification of seasonal spikes in system load and tying that back to a suboptimal load balancer
  • 35.
    Monitoring vs Observability Monitoringtells you that something is wrong. Observability uses data collection to tell you what is wrong and why it happened.
  • 36.
    The 3 pillars:Metrics, Logs, Traces The three pillars of observability are logs, metrics, and traces. These three data outputs provide different insights into the health and functions of systems in cloud and microservices environments. - Logs are the archival or historical records of system events and errors, which can be plain text, binary, or structured with metadata. - Metrics are numerical measurements of system performance and behavior, such as CPU usage, response time, or error rate. - Traces are the representations of individual requests or transactions that flow through a system, which can help identify bottlenecks, dependencies, and root causes of issues.
  • 37.
    What is theoperations suite? Google Cloud’s operations suite is made up of products to monitor, troubleshoot and operate your services at scale, enabling your DevOps, SREs, or ITOps teams to utilize the Google SRE best practices. It offers integrated capabilities for monitoring, logging, and advanced observability services like trace, debugger and profiler. The end-to-end operations solution includes built-in telemetry, out-of-box dashboards, recommendations, alerts and more: Capturing signals Monitoring systems Managing incidents Troubleshooting issues
  • 38.
    Concepts - Incident: This iswhen something goes wrong in your system — a service is down, latency is spiking, or errors are increasing. • Examples: Website returns 500 errors, database crash, CI/CD pipeline failure. • Goal: Detect it fast (via alerts, logs, dashboards). 🛠 Tools: Prometheus, Grafana, Cloud Monitoring, Alertmanager, PagerDuty.
  • 39.
    Concepts Triage You investigate theissue, assess the impact, and prioritize it. • Questions: • What’s broken? • Who is affected (users, teams)?
  • 40.
    Concepts Triage You investigate theissue, assess the impact, and prioritize it. • Can it cause cascading failures? • Goal: Quickly understand the scope and severity. 🛠 Tools: Runbooks, Dashboards, Logs, SLO dashboards.
  • 41.
    Concepts Mitigation You take immediateactions to contain or resolve the issue. • Examples: • Roll back a bad deploy • Reboot a node
  • 42.
    Concepts Mitigation • Scale upa service • Redirect traffic • Goal: Restore user-facing functionality ASAP — even if it’s a quick patch or workaround. 🛠 Tools: Kubernetes, Terraform, Cloud Console, Rollback Scripts.
  • 43.
    Concepts Postmortem After the fireis out, you document what happened. • What you include: • Timeline of the incident • Root cause
  • 44.
    Concepts Postmortem After the fireis out, you document what happened. • What went well • What went wrong • Action items (e.g., fix broken alerts, add tests, improve on-call rotation) • Goal: Learn and prevent similar incidents. No blame — it’s about improving systems & culture.
  • 45.
    Role of On-Callin SRE Being on-call means you’re the first responder when things go wrong in production. It’s like being the “firefighter” for your systems. ✅ Responsibilities: • Respond to alerts: From monitoring tools or uptime checks. • Triage issues: Quickly understand if it’s real, critical, or noise. • Mitigate incidents: Rollbacks, scaling, restarting services, etc. • Escalate if needed: If it’s too big or outside your domain. • Communicate status: Updates to teams or status pages.
  • 46.
    Q & ADiscussion
  • 47.
    UseFul Links: - https://www.atlassian.com/devops/frameworks/calms-framework -https://cloud.google.com/blog/topics/developers-practitioners/devops-and-cicd-goo gle-cloud-explained?hl=en - https://cloud.google.com/build#documentation - https://kubernetes.io/docs/tutorials/kubernetes-basics/ - https://cloud.google.com/blog/topics/developers-practitioners/introduction-google-c louds-operations-suite?hl=en