This document provides materials for teaching social studies lessons on Philippine history during martial law and the People Power Revolution. It includes guide cards with learning objectives, activity cards with picture analyses and identification questions, an assessment card with a table to fill out, an enrichment card with additional information, and a reference card listing related resources. The materials were prepared by a social studies teacher and approved by the school principal to achieve a 90% correct response rate from students.
This document shows a demand curve graph with price on the y-axis and quantity demanded on the x-axis. It plots the relationship between various price points and the corresponding quantity demanded, showing that as price increases, quantity demanded decreases, following the inverse relationship defined by the demand function Qd=50-2P. The demand curve captures the negative slope between price and quantity demanded.
This document appears to be a score sheet containing a chart with points ranging from 0 to 35 on the x-axis. The y-axis contains pricing and profit information. There are 7 items labeled A through G with corresponding point values, prices, and current profits which are all listed as 0. The total points, pricing and profits are also listed as 0.
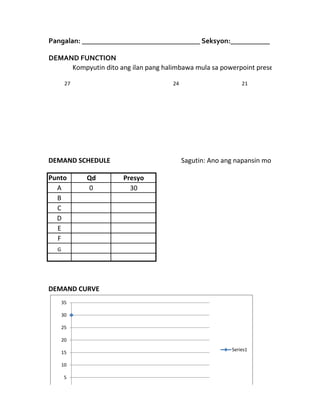
1. Pangalan: _________________________________ Seksyon:___________ Petsa: _______
DEMAND FUNCTION
Kompyutin dito ang ilan pang halimbawa mula sa powerpoint presentation
27 24 21
DEMAND SCHEDULE Sagutin: Ano ang napansin mo sa talahanayan?
Punto Qd Presyo
A 0 30
B
C
D
E
F
G
DEMAND CURVE
35
30
25
20
Series1
15
10
5