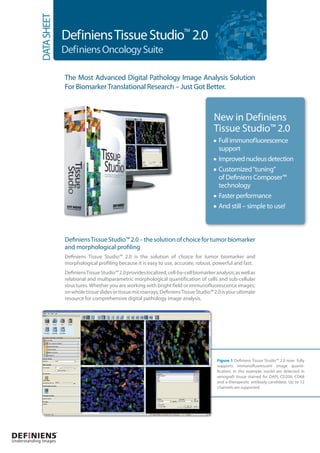
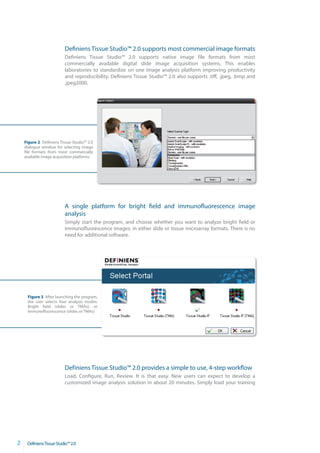
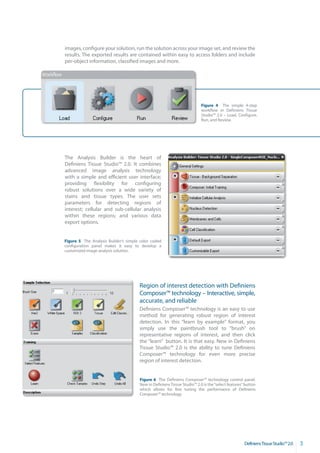
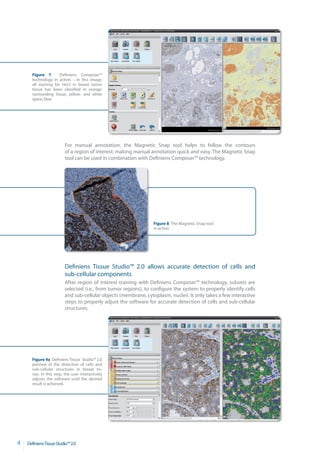
1. DATA SHEET
Definiens Tissue Studio 2.0
TM
Definiens Oncology Suite
The Most Advanced Digital Pathology Image Analysis Solution
For Biomarker Translational Research – Just Got Better.
New in Definiens
Tissue Studio™ 2.0
Full immunofluorescence
support
Improved nucleus detection
Customized “tuning”
of Definiens Composer™
technology
Faster performance
And still – simple to use!
Definiens Tissue Studio™ 2.0 – the solution of choice for tumor biomarker
and morphological profiling
Definiens Tissue Studio™ 2.0 is the solution of choice for tumor biomarker and
morphological profiling because it is easy to use, accurate, robust, powerful and fast.
Definiens Tissue Studio™ 2.0 provides localized, cell-by-cell biomarker analysis; as well as
relational and multiparametric morphological quantification of cells and sub-cellular
structures. Whether you are working with bright field or immunofluorescence images;
on whole tissue slides or tissue microarrays; Definiens Tissue Studio™ 2.0 is your ultimate
resource for comprehensive digital pathology image analysis.
Figure 1 Definiens Tissue Studio™ 2.0 now fully
supports immunofluorescent image quanti
fication. In this example, nuclei are detected in
xenograft tissue stained for DAPI, CD206, CD68
and a therapeutic antibody candidate. Up to 12
channels are supported.
Understanding Images
2. Definiens Tissue Studio™ 2.0 supports most commercial image formats
Definiens Tissue Studio™ 2.0 supports native image file formats from most
commercially available digital slide image acquisition systems. This enables
laboratories to standardize on one image analysis platform improving productivity
and reproducibility. Definiens Tissue Studio™ 2.0 also supports .tiff, .jpeg, .bmp and
.jpeg2000.
Figure 2 Definiens Tissue Studio™ 2.0
dialogue window for selecting image
file formats from most commercially
available image acquisition platforms.
A single platform for bright field and immunofluorescence image
analysis
Simply start the program, and choose whether you want to analyze bright field or
immunofluorescence images; in either slide or tissue microarray formats. There is no
need for additional software.
Figure 3 After launching the program,
the user selects four analysis modes:
Bright field (slides or TMAs); or
immunofluorescence (slides or TMAs)
Definiens Tissue Studio™ 2.0 provides a simple to use, 4-step workflow
Load, Configure, Run, Review. It is that easy. New users can expect to develop a
customized image analysis solution in about 20 minutes. Simply load your training
2 DefiniensTissueStudio™2.0
3. images, configure your solution, run the solution across your image set, and review the
results. The exported results are contained within easy to access folders and include
per-object information, classified images and more.
Figure 4 The simple 4-step
workflow in Definiens Tissue
Studio™ 2.0 – Load, Configure,
Run, and Review.
The Analysis Builder is the heart of
Definiens Tissue Studio™ 2.0. It combines
advanced image analysis technology
with a simple and efficient user interface;
providing flexibility for configuring
robust solutions over a wide variety of
stains and tissue types. The user sets
parameters for detecting regions of
interest; cellular and sub-cellular analysis
within these regions; and various data
export options.
Figure 5 The Analysis Builder’s simple color coded
configuration panel makes it easy to develop a
customized image analysis solution.
Region of interest detection with Definiens
Composer™ technology – Interactive, simple,
accurate, and reliable
Definiens Composer™ technology is an easy to use
method for generating robust region of interest
detection. In this “learn by example” format, you
simply use the paintbrush tool to “brush” on
representative regions of interest, and then click
the “learn” button. It is that easy. New in Definiens
Tissue Studio™ 2.0 is the ability to tune Definiens
Composer™ technology for even more precise
region of interest detection.
Figure 6 The Definiens Composer™ technology control panel.
New in Definiens Tissue Studio™ 2.0 is the “select features” button
which allows for fine tuning the performance of Definiens
Composer™ technology.
DefiniensTissueStudio™2.0 3
4. Figure 7 Definiens Composer™
technology in action – In this image,
all staining for Her2 in breast tumor
tissue has been classified in orange;
surrounding tissue, yellow; and white
space, blue.
For manual annotation, the Magnetic Snap tool helps to follow the contours
of a region of interest; making manual annotation quick and easy. The Magnetic Snap
tool can be used in combination with Definiens Composer™ technology.
Figure 8 The Magnetic Snap tool
in action
Definiens Tissue Studio™ 2.0 allows accurate detection of cells and
sub-cellular components
After region of interest training with Definiens Composer™ technology, subsets are
selected (i.e., from tumor regions), to configure the system to properly identify cells
and sub-cellular objects (membrane, cytoplasm, nuclei). It only takes a few interactive
steps to properly adjust the software for accurate detection of cells and sub-cellular
structures.
Figure 9a Definiens Tissue Studio™ 2.0
preview of the detection of cells and
sub-cellular structures in breast tis
sue. In this step, the user interactively
adjusts the software until the desired
result is achieved.
4 DefiniensTissueStudio™2.0
5. The next configuration step is to set the staining thresholds for biomarker
quantification. Although the software makes suggestions for default low, medium, and
high thresholds, this step is ultimately user defined which ensures accurate cell-by-cell
evaluation of biomarker expression.
Figure 9b Definiens Tissue Studio™ 2.0 staining
intensity preview (low, medium, or high). As in figure
9a, the user interactively adjusts the software until
the desired result is achieved. The solution is saved
aa and batch processing can now begin.
Definiens Tissue Studio™ 2.0 is also able to exclude cells from the analysis. In Figures
9a and 9b, all cells where nuclei were not present have been excluded from further
analysis. You can exclude cells based on area, length, width, distance from border, etc.
The most comprehensive biomarker and morphological quantification
available for digital pathology image analysis
Increasingly, the trend in the literature shows that in addition to localized biomarker
expression, tumor morphology plays a role in disease prognosis or therapeutic
response prediction. Definiens Tissue Studio™ 2.0 provides the world’s most
comprehensive digital pathology image analysis for tumor morphological quantification.
Figure 10 The image object table and
image object information tables are
displayed. Clicking on any object (cell,
nucleus, cytoplasm, region of interest,
etc.) will yield all quantified features for
that particular object.
Length, area, width, elliptic fit, circularity, and dozens more intensity-, shape- and
context-based features can be measured. You can even create your own attributes to
quantify, and there is no limit to how many parameters can be measured
or exported. Further, there is no “speed limit” for comprehensive image analysis
processing. Turnaround times are the same whether you are measuring marker
intensity; percent stain; percent positive or negative nuclei; or for example, 15 different
morphological attributes of an individual cell.
DefiniensTissueStudio™2.0 5
6. Figure 11 Example data generated
from a typical Definiens Tissue Studio
analysis. Over 50 intensity-, shape-, and
context-based features are available.
Full tissue microarray support for retrospective studies
Tissue microarrays are often utilized for retrospective studies involving tumor
biomarker and morphological profiling. In these settings, researchers look for
correlations between biomarker expression, tumor morphology, and clinical
endpoints of interest. Definiens Tissue Studio™ 2.0 provides full tissue microarray
support, for both bright field and immunofluorescent images, and supports
metadata import on a per core basis. Even with heavily skewed tissue microarrays,
Definiens Tissue Studio™ 2.0 easily matches cores.
Figure 12 a-d In these images, a non-small cancer tissue microarray was analyzed for the nuclear expression of SOX2. The study
concluded that SOX2 over-expression correlates to longer survival in patients with squamous non-small cell lung cancer (Images
courtesy of Sven Perner and Theresia Wilbertz; University of Tuebingen).
6 DefiniensTissueStudio™2.0
7. Definiens Tissue Studio™ 2.0 delivers:
DEEPER INSIGHTS
Quantifies nuclear, membrane and cytoplasmic biomarkers on a cell-by-cell basis
Supports all standard bright field and immunofluorescent stains
Analyzes all slides and TMA images from most commercially available
image acquisition systems
FASTER RESULTS
Identifies regions of interest automatically
Operates through a simple, intuitive user interface
Offers unlimited throughput with parallel batch processing
BETTER DECISIONS
Delivers extremely accurate and reproducible results
Enables multiparametric investigations to identify underlying correlations
Supports translational research through rapid iterative investigation of biomarkers
Multiparametric and morphological features measured
IHC and IF
No. and % of:
No. of positive nuclei – Nuclei with small area
No. of negative nuclei – Nuclei with medium area
Positive index – Nuclei with large area
Cell and membrane features: No. and % of:
– Mean cell size (μm²) – Cells of negative intensity (0)
– Mean marker intensity (Cell) – Cells of low intensity (1+)
– Mean marker intensity (Cytoplasm) – Cells of medium intensity (2+)
– Mean marker intensity (Membrane) – Cells of high intensity (3+)
– Mean ratio marker intensity
No. and % of:
membrane to cytoplasm
– Cells with small area
Marker area features:
– Cells with medium area
– IHC: Marker area (μm²)
– Cells with large area
– Fluorescence: For up to three chosen
channels as well as co-localization areas: H & E
– Marker area (μm²) Region of interest area
– Marker intensity
Custom data export is also supported: Over 50
No. and % of: intensity, shape, and context related features are
– Nuclei of low intensity available including: Area, length, width, length/
– Nuclei of medium intensity width, roundness, compactness, density, circularity,
– Nuclei of high intensity elliptic fit, shape index, and many more.
See http://www.tissuestudio.com for the
complete feature listing.
DefiniensTissueStudio™2.0 7