More Related Content
Similar to Decision Model to Select Best Quote
Similar to Decision Model to Select Best Quote (11)
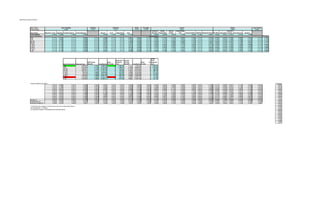
Decision Model to Select Best Quote
- 1. Select Best Insurance Program
Main Criteria Cashflow Admin Coverage Loss Control
Priority Weight 0.1679 0.1510 0.1753 0.0076
Sub-Criteria Retention Levels Agg Stop Variable Expense Limits Adequacy Amount Form Adjustment Cost
Financial
Strength
Claims
Paying Rep
Service
Quality
Underwriting
Flex Communication Systems Responsiveness Bundled Unbundled
Service
Quality Cost Structure Systems
Priority Weight 0.5701 0.0493 0.1225 0.2581 0.6402 0.1551 0.0896 0.1151 0.0630 0.2804 0.2410 0.1289 0.0901 0.1080 0.0887 0.0522 0.0541 0.2427 0.5144 0.1366
Quote Alternatives Priorities
T3M 0.1111 0.1522 0.1111 0.0400 0.1111 0.3058 0.1111 0.1111 0.3061 0.3644 0.1111 0.2467 0.1273 0.1633 0.0261 0.1304 0.1111 0.0727 0.1837 0.0244 0.1069 0.0359 0.1910 0.1111 0.1644
T5M 0.1111 0.0505 0.1111 0.3600 0.1111 0.3058 0.1111 0.1111 0.3061 0.3501 0.1111 0.2467 0.1273 0.1633 0.0261 0.1304 0.1111 0.0727 0.1837 0.0244 0.1069 0.0359 0.1910 0.1111 0.1799
OR 3M 0.1111 0.1139 0.1111 0.0400 0.1111 0.1679 0.1111 0.1111 0.1663 0.0392 0.1111 0.0226 0.1273 0.0629 0.2669 0.1304 0.1111 0.2881 0.0204 0.2195 0.1263 0.1788 0.0347 0.1111 0.1058
OR 5M 0.1111 0.1139 0.1111 0.3600 0.1111 0.0979 0.1111 0.1111 0.0972 0.0392 0.1111 0.0226 0.1273 0.0629 0.2669 0.1304 0.1111 0.2881 0.0204 0.2195 0.1263 0.1788 0.0347 0.1111 0.1170
C 3M U 0.1111 0.1139 0.1111 0.0400 0.1111 0.0410 0.1111 0.1111 0.0414 0.0392 0.1111 0.0522 0.0424 0.0290 0.1272 0.0435 0.1111 0.0313 0.0204 0.2195 0.1329 0.1699 0.0582 0.1111 0.0888
C 3M B 0.1111 0.1139 0.1111 0.0400 0.1111 0.0410 0.1111 0.1111 0.0414 0.0428 0.1111 0.0522 0.0524 0.0290 0.1272 0.0435 0.1111 0.0313 0.1837 0.0244 0.0620 0.0802 0.0549 0.1111 0.0838
A 3M U 0.1111 0.1139 0.1111 0.0400 0.1111 0.0159 0.1111 0.1111 0.0162 0.0396 0.1111 0.1331 0.1067 0.1633 0.0551 0.1304 0.1111 0.0607 0.0204 0.2195 0.1329 0.1633 0.1041 0.1111 0.0889
A 3M B 0.1111 0.1139 0.1111 0.0400 0.1111 0.0161 0.1111 0.1111 0.0165 0.0428 0.1111 0.1331 0.1502 0.1633 0.0551 0.1304 0.1111 0.0607 0.1837 0.0244 0.0596 0.0842 0.1532 0.1111 0.0853
L 3M 0.1111 0.1139 0.1111 0.0400 0.1111 0.0087 0.1111 0.1111 0.0089 0.0428 0.1111 0.0908 0.1390 0.1633 0.0494 0.1304 0.1111 0.0944 0.1837 0.0244 0.1462 0.0730 0.1780 0.1111 0.0860
Quote Alternatives Expected Cost
AHP Priority
(Benefit) Cost/Benefit
Rank
(9 is best)
Break-Even
Expected
Cost
Entropy
Priority
(Benefit) Cost/Benefit
Rank (9
is best)
Break-
Even
Expected
Cost
T3M 1,096,023 0.1644 6,665,072 9 1,096,023 0.1413 7,759,340 9 1,096,023
T5M 1,216,330 0.1799 6,761,536 8 1,198,977 0.1505 8,080,047 8 1,168,052
OR 3M 1,089,391 0.1058 10,300,926 5 704,875 0.1207 9,023,532 6 936,768
OR 5M 1,305,391 0.1170 11,153,178 4 780,094 0.1287 10,141,661 4 998,749
C 3M U 758,169 0.0888 8,538,064 7 591,850 0.0866 8,755,353 7 671,919
C 3M B 758,169 0.0838 9,047,339 6 558,534 0.0790 9,602,690 5 612,629
A 3M U 1,156,669 0.0889 13,006,196 3 592,739 0.0994 11,632,062 3 771,573
A 3M B 1,156,669 0.0853 13,553,274 1 568,813 0.0957 12,087,433 1 742,506
L 3M 1,160,630 0.0860 13,496,411 2 573,166 0.0981 11,832,198 2 761,120
Entropy weighting calculation Transpose
0.2441 0.2866 0.2441 0.1288 0.2441 0.3623 0.2441 0.2441 0.3624 0.3679 0.2441 0.3453 0.2624 0.2959 0.0952 0.2657 0.2441 0.1906 0.3113 0.0906 0.2391 0.1195 0.3162 0.2441 4.06%
0.2441 0.1508 0.2441 0.3678 0.2441 0.3623 0.2441 0.2441 0.3624 0.3674 0.2441 0.3453 0.2624 0.2959 0.0952 0.2657 0.2441 0.1906 0.3113 0.0906 0.2391 0.1195 0.3162 0.2441 4.07%
0.2441 0.2474 0.2441 0.1288 0.2441 0.2996 0.2441 0.2441 0.2983 0.1270 0.2441 0.0857 0.2624 0.1740 0.3525 0.2657 0.2441 0.3585 0.0794 0.3329 0.2613 0.3078 0.1167 0.2441 4.06%
0.2441 0.2474 0.2441 0.3678 0.2441 0.2275 0.2441 0.2441 0.2266 0.1270 0.2441 0.0857 0.2624 0.1740 0.3525 0.2657 0.2441 0.3585 0.0794 0.3329 0.2613 0.3078 0.1167 0.2441 4.39%
0.2441 0.2474 0.2441 0.1288 0.2441 0.1309 0.2441 0.2441 0.1318 0.1270 0.2441 0.1541 0.1341 0.1026 0.2622 0.1363 0.2441 0.1083 0.0794 0.3329 0.2682 0.3011 0.1656 0.2441 4.06%
0.2441 0.2474 0.2441 0.1288 0.2441 0.1309 0.2441 0.2441 0.1318 0.1348 0.2441 0.1541 0.1544 0.1026 0.2622 0.1363 0.2441 0.1083 0.3113 0.0906 0.1723 0.2023 0.1594 0.2441 4.36%
0.2441 0.2474 0.2441 0.1288 0.2441 0.0658 0.2441 0.2441 0.0669 0.1279 0.2441 0.2684 0.2388 0.2959 0.1597 0.2657 0.2441 0.1701 0.0794 0.3329 0.2682 0.2959 0.2355 0.2441 4.06%
0.2441 0.2474 0.2441 0.1288 0.2441 0.0665 0.2441 0.2441 0.0676 0.1348 0.2441 0.2684 0.2847 0.2959 0.1597 0.2657 0.2441 0.1701 0.3113 0.0906 0.1680 0.2084 0.2874 0.2441 4.06%
0.2441 0.2474 0.2441 0.1288 0.2441 0.0413 0.2441 0.2441 0.0419 0.1348 0.2441 0.2179 0.2743 0.2959 0.1486 0.2657 0.2441 0.2228 0.3113 0.0906 0.2811 0.1910 0.3072 0.2441 4.36%
Entropy (1) 0.2441 0.2410 0.2441 0.1819 0.2441 0.1875 0.2441 0.2441 0.1877 0.1832 0.2441 0.2139 0.2373 0.2258 0.2098 0.2369 0.2441 0.2087 0.2082 0.1983 0.2399 0.2282 0.2246 0.2441 4.38%
Diversification (2) 0.7559 0.7590 0.7559 0.8181 0.7559 0.8125 0.7559 0.7559 0.8123 0.8168 0.7559 0.7861 0.7627 0.7742 0.7902 0.7631 0.7559 0.7913 0.7918 0.8017 0.7601 0.7718 0.7754 0.7559 4.06%
Importance Weight (3) 4.06% 4.07% 4.06% 4.39% 4.06% 4.36% 4.06% 4.06% 4.36% 4.38% 4.06% 4.22% 4.09% 4.15% 4.24% 4.09% 4.06% 4.25% 4.25% 4.30% 4.08% 4.14% 4.16% 4.06% 4.22%
4.09%
(1) Entropy is the average of -p*lnp for each cell in the corresponding column. 4.15%
(2) Diversification = 1-Entropy 4.24%
(3) Importance Weight= Diversification/Sum(Diversifications) 4.09%
4.06%
4.25%
4.25%
4.30%
4.08%
4.14%
4.16%
4.06%
Cost Variability Collateral Insurer Claims
Priority Weights
0.2269 0.1412 0.0441 0.0860