Downloaded 37 times
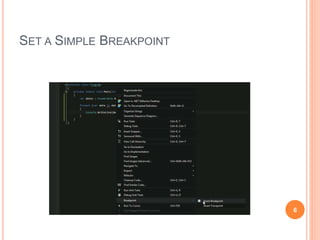
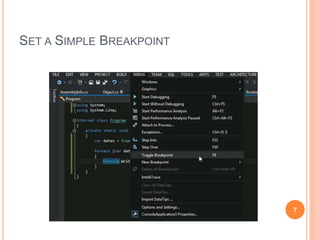
![SET A SIMPLE BREAKPOINT
1. [Debug | Toggle Breakpoint]
2. [Breakpoint | Insert Breakpoint] from context
menu in source window.
3. Click on left margin
4. Shortcut
F9
5](https://image.slidesharecdn.com/debugginginvisualstudiobasiclevel-150402010816-conversion-gate01/85/Debugging-in-visual-studio-basic-level-5-320.jpg)
![SET A BREAKPOINT ON A FUNCTION CALL
FROM THE CALL STACK WINDOW
[Breakpoint | Insert Breakpoint] from context
menu in Call Stack window.
8](https://image.slidesharecdn.com/debugginginvisualstudiobasiclevel-150402010816-conversion-gate01/85/Debugging-in-visual-studio-basic-level-8-320.jpg)
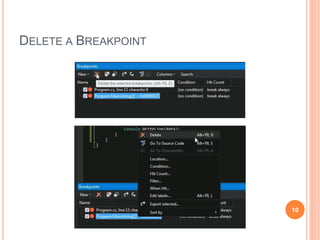
![DELETE A BREAKPOINT
In the Breakpoints window, choose a breakpoint,
and click Delete button from the toolbar
In the Breakpoints window, right-click on a
breakpoint, and choose [Delete] from context menu.
In a source window or Disassembly window, click
on the breakpoint glyph.
Shortcut
F9
9](https://image.slidesharecdn.com/debugginginvisualstudiobasiclevel-150402010816-conversion-gate01/85/Debugging-in-visual-studio-basic-level-9-320.jpg)
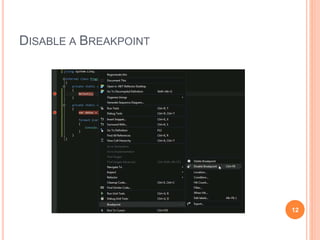
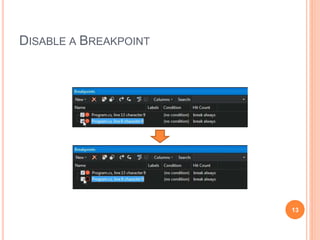
![DISABLE A BREAKPOINT
In a source, Disassembly, or Call Stack window,
right-click on a line containing an enabled
breakpoint glyph and choose [Breakpoint |
Disable Breakpoint] from the shortcut menu.
In the Breakpoints window, clear the checkbox
next to an enabled breakpoint.
Shortcut
Ctrl + F9
11](https://image.slidesharecdn.com/debugginginvisualstudiobasiclevel-150402010816-conversion-gate01/85/Debugging-in-visual-studio-basic-level-11-320.jpg)
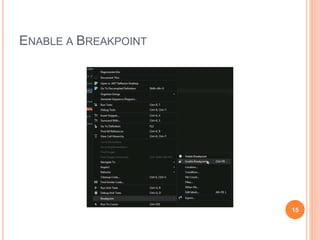
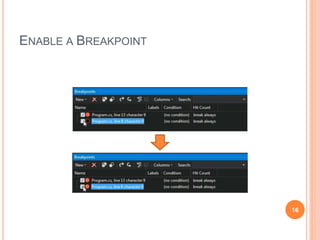
![ENABLE A BREAKPOINT
In a source, Disassembly, or Call Stack window,
right-click on a line containing a disabled
breakpoint glyph and choose [Breakpoint |
Enable Breakpoint] from the shortcut menu.
In the Breakpoints window, set the checkbox next
to a disabled breakpoint.
Shortcut
Ctrl + F9
14](https://image.slidesharecdn.com/debugginginvisualstudiobasiclevel-150402010816-conversion-gate01/85/Debugging-in-visual-studio-basic-level-14-320.jpg)
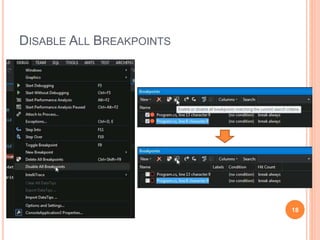
![DISABLE ALL BREAKPOINTS
[Debug | Disable All Breakpoints]
In the Breakpoints window, click disable-all button
in toolbar.
17](https://image.slidesharecdn.com/debugginginvisualstudiobasiclevel-150402010816-conversion-gate01/85/Debugging-in-visual-studio-basic-level-17-320.jpg)
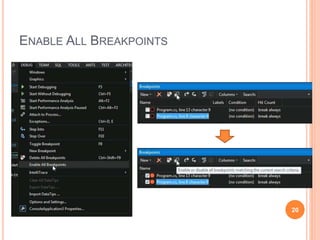
![ENABLE ALL BREAKPOINTS
[Debug | Enable All Breakpoints]
In the Breakpoints window, click enable-all button
in toolbar.
19](https://image.slidesharecdn.com/debugginginvisualstudiobasiclevel-150402010816-conversion-gate01/85/Debugging-in-visual-studio-basic-level-19-320.jpg)
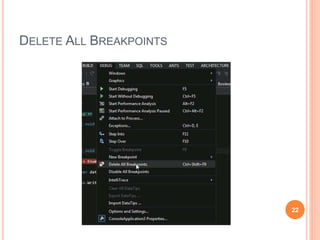
![DELETE ALL BREAKPOINTS
[Debug | Delete All Breakpoints]
21](https://image.slidesharecdn.com/debugginginvisualstudiobasiclevel-150402010816-conversion-gate01/85/Debugging-in-visual-studio-basic-level-21-320.jpg)
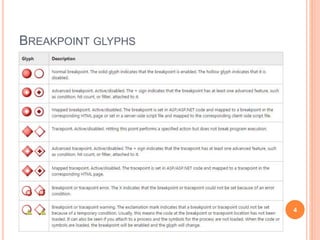
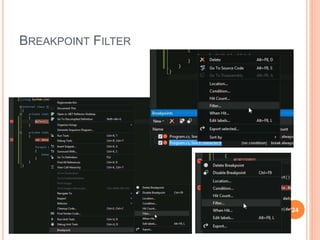
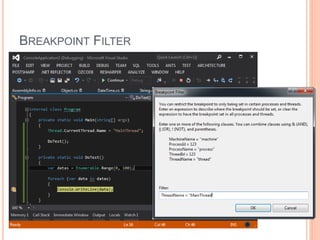
![BREAKPOINT FILTER
Function
Limit the behavior of a breakpoint to specified machines,
processes, and threads.
[Filter] from the context menu in the Breakpoints
window.
In a source, Disassembly, or Call Stack, right-click a
line containing a breakpoint glyph and
choose Filter from Breakpoints in the shortcut
menu.
[Filter] from context menu in breakpoint glyph.
23](https://image.slidesharecdn.com/debugginginvisualstudiobasiclevel-150402010816-conversion-gate01/85/Debugging-in-visual-studio-basic-level-23-320.jpg)
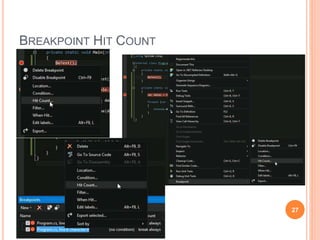
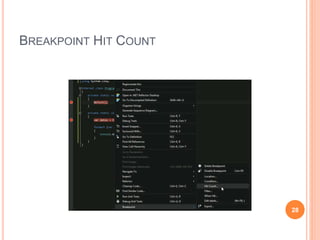
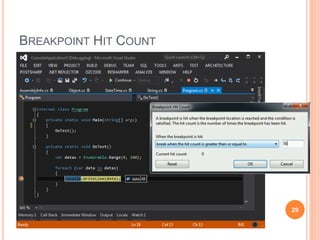
![BREAKPOINT HIT COUNT
Function
Keep track of how many times a breakpoint is hit.
In the Breakpoints window, right-click on a
breakpoint and choose Hit Count from the shortcut
menu.
[Hit Count…] from context menu in breakpoint
glyph.
In a source, Disassembly, or Call Stack window,
right-click on a line containing a breakpoint and
choose [Breakpoints | Hit Count] in the shortcut
menu.
26](https://image.slidesharecdn.com/debugginginvisualstudiobasiclevel-150402010816-conversion-gate01/85/Debugging-in-visual-studio-basic-level-26-320.jpg)
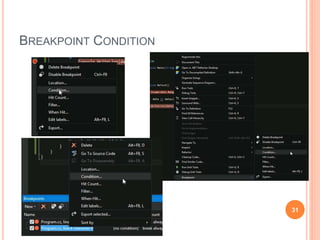
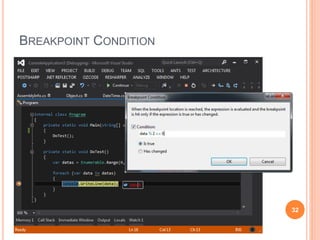
![BREAKPOINT CONDITION
Function
An expression that the debugger evaluates when a
breakpoint is reached.
In the Breakpoints window, right-click the line
containing a breakpoint glyph and
choose Condition from the shortcut menu.
In a source, Disassembly, or Call Stack, right-click a
line containing a breakpoint glyph and
choose Condition from Breakpoints in the
shortcut menu.
[Condition…] from context menu in breakpoint
glyph. 30](https://image.slidesharecdn.com/debugginginvisualstudiobasiclevel-150402010816-conversion-gate01/85/Debugging-in-visual-studio-basic-level-30-320.jpg)
![REFERENCE
Breakpoints and Tracepoints
https://msdn.microsoft.com/en-
us/library/ktf38f66(v=vs.90).aspx
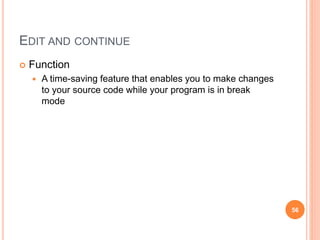
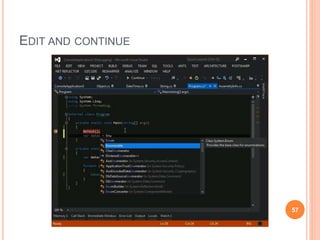
Edit and Continue
https://msdn.microsoft.com/en-us/library/bcew296c.aspx
Debugger Tips, Tricks and Tools #6 - Gooey Bugs -
Site Home - MSDN Blogs
http://blogs.msdn.com/b/jimgries/archive/2005/11/16/49
3431.aspx
[C#][Visual Studio]Debug With Object ID - Level
Up- 點部落
http://www.dotblogs.com.tw/larrynung/archive/2011/05/0
5/24296.aspx 60](https://image.slidesharecdn.com/debugginginvisualstudiobasiclevel-150402010816-conversion-gate01/85/Debugging-in-visual-studio-basic-level-60-320.jpg)
![REFERENCE
[Visual Studio]追蹤點(Tracepoint)的使用 - Level Up-
點部落
http://www.dotblogs.com.tw/larrynung/archive/2009/11/0
4/11399.aspx
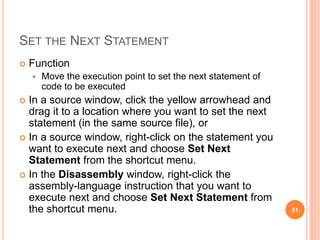
How to: Set the Next Statement
https://msdn.microsoft.com/en-
us/library/09yze4a9%28VS.80%29.aspx
Start, Break, Step, Run through Code, and Stop
Debugging in Visual Studio
https://msdn.microsoft.com/en-us/library/y740d9d3.aspx
61](https://image.slidesharecdn.com/debugginginvisualstudiobasiclevel-150402010816-conversion-gate01/85/Debugging-in-visual-studio-basic-level-61-320.jpg)

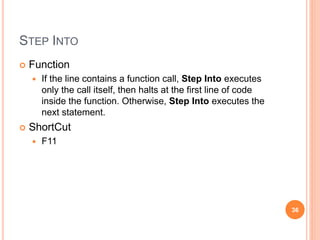
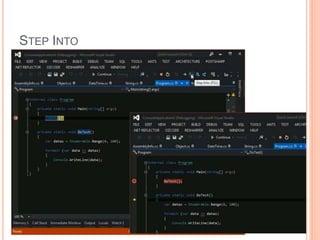
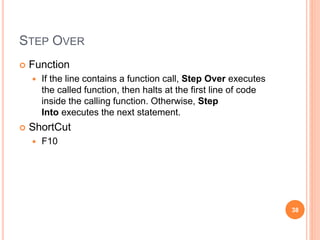
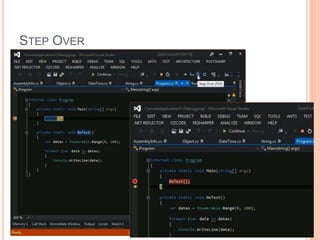
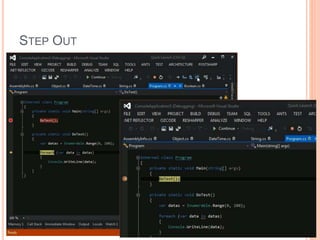
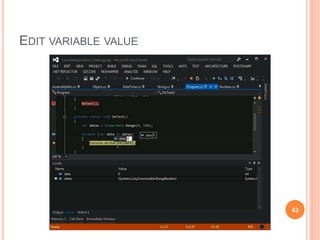
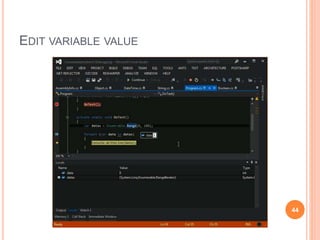
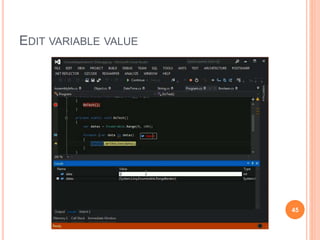
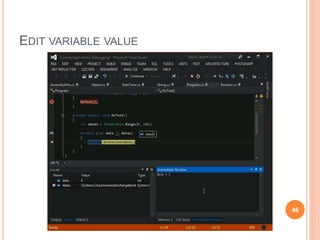
This document provides an overview of debugging techniques in Visual Studio, including how to set breakpoints, tracepoints, step through code, edit variable values, debug with object IDs, set the next statement, and use edit and continue. Breakpoints can be set, deleted, disabled, enabled, and filtered. Stepping allows debugging line-by-line through code using step into, step over, and step out commands. Variables can be edited during debugging. Edit and continue enables editing code while debugging.